Databricks
UK

The table below provides summary statistics for permanent job vacancies with a requirement for knowledge and experience of Databricks products and/or services. Included is a benchmarking guide to the salaries offered in vacancies that have cited Databricks over the 6 months to 7 May 2024 with a comparison to the same period in the previous 2 years.

The figures below represent the IT labour market in general and are not representative of salaries within Databricks.

6 months to
7 May 2024
Same period 2023 Same period 2022
Rank 267 412 427
Rank change year-on-year +145 +15 +30
Permanent jobs citing Databricks 1,112 784 1,372
As % of all permanent jobs advertised in the UK 1.13% 0.77% 0.87%
As % of the Vendors category 3.06% 1.84% 2.24%
Number of salaries quoted 558 603 662
10th Percentile £50,000 £47,500 £46,300
25th Percentile £60,000 £57,500 £53,813
Median annual salary (50th Percentile) £80,000 £77,500 £70,000
Median % change year-on-year +3.23% +10.71% +3.70%
75th Percentile £95,000 £95,000 £85,938
90th Percentile £110,000 £106,250 £98,625
UK excluding London median annual salary £67,500 £65,000 £66,000
% change year-on-year +3.85% -1.52% +10.00%

All Vendors
UK

Databricks is in the Vendor Products and Services category. The following table is for comparison with the above and provides summary statistics for all permanent job vacancies with a requirement for knowledge or experience of vendor products and services.

Permanent vacancies with a requirement for knowledge or experience of vendor products and services 36,372 42,516 61,223
As % of all permanent jobs advertised in the UK 36.93% 41.86% 38.89%
Number of salaries quoted 24,910 24,257 32,962
10th Percentile £26,695 £31,250 £30,000
25th Percentile £35,924 £41,250 £40,000
Median annual salary (50th Percentile) £50,000 £57,500 £55,000
Median % change year-on-year -13.04% +4.55% +4.76%
75th Percentile £68,750 £75,500 £75,000
90th Percentile £87,500 £92,500 £90,000
UK excluding London median annual salary £45,000 £50,000 £47,500
% change year-on-year -10.00% +5.26% +3.26%

Databricks
Job Vacancy Trend

Job postings citing Databricks as a proportion of all IT jobs advertised.
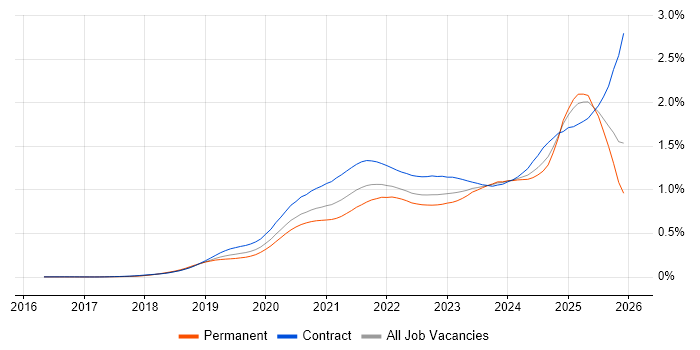
Job vacancy trend for Databricks in the UK

Databricks
Salary Trend

3-month moving average salary quoted in jobs citing Databricks.

Salary trend for Databricks in the UK

Databricks
Salary Histogram

Salary distribution for jobs citing Databricks over the 6 months to 7 May 2024.

Salary histogram for Databricks in the UK

Databricks
Top 17 Job Locations

The table below looks at the demand and provides a guide to the median salaries quoted in IT jobs citing Databricks within the UK over the 6 months to 7 May 2024. The 'Rank Change' column provides an indication of the change in demand within each location based on the same 6 month period last year.

Location Rank Change
on Same Period
Last Year
Matching
Permanent
IT Job Ads
Median Salary
Past 6 Months
Median Salary
% Change
on Same Period
Last Year
Live
Jobs
England +96 799 £80,000 - 235
UK excluding London +150 597 £67,500 +3.85% 134
Work from Home +99 470 £80,000 +6.67% 142
London +149 467 £85,000 -5.03% 117
Scotland +124 278 £66,500 +10.83% 14
Midlands +61 101 £57,500 +0.88% 29
North of England +38 96 £83,750 +11.67% 32
West Midlands +64 72 £57,500 -11.54% 12
North West +47 69 £85,000 +30.77% 18
South East -26 66 £70,000 - 23
South West -32 31 £66,250 -17.19% 16
East Midlands -2 29 £60,000 +9.09% 17
East of England +18 22 £92,500 +48.00% 12
Yorkshire +43 19 £80,000 +4.92% 12
North East -4 8 £53,750 -27.36% 2
Wales +7 3 £46,131 -7.74% 5
Isle of Man - 2 £82,500 -

Databricks
Co-occurring Skills and Capabilities by Category

The follow tables expand on the table above by listing co-occurrences grouped by category. The same employment type, locality and period is covered with up to 20 co-occurrences shown in each of the following categories:

Application Platforms
1 260 (23.38%) Apache Spark
2 85 (7.64%) Apache
3 77 (6.92%) Apache Airflow
4 7 (0.63%) SharePoint
5 4 (0.36%) SAS
6 2 (0.18%) Luigi
7 1 (0.090%) Apache Pig
7 1 (0.090%) Apache Synapse
7 1 (0.090%) Confluence
7 1 (0.090%) IIS
7 1 (0.090%) Microsoft Exchange
7 1 (0.090%) Tuxedo
Applications
1 31 (2.79%) Microsoft Excel
2 8 (0.72%) Microsoft Office
3 3 (0.27%) Microsoft PowerPoint
4 1 (0.090%) MS Visio
Business Applications
1 4 (0.36%) Primavera
2 3 (0.27%) Dynamics CRM
3 2 (0.18%) SAP S/4HANA
4 1 (0.090%) Data Workbench
4 1 (0.090%) Dynamics NAV
4 1 (0.090%) Salesforce CRM
Cloud Services
1 607 (54.59%) Azure
2 500 (44.96%) AWS
3 237 (21.31%) Power Platform
4 236 (21.22%) Azure Data Factory
5 172 (15.47%) Azure Synapse Analytics
6 127 (11.42%) Azure DevOps
7 111 (9.98%) GCP
8 90 (8.09%) Snowflake
9 51 (4.59%) Cloud Computing
9 51 (4.59%) Serverless
10 29 (2.61%) GitHub
11 28 (2.52%) Azure Cosmos DB
12 25 (2.25%) Matillion
12 25 (2.25%) Microsoft Purview
13 18 (1.62%) Amazon Kinesis
13 18 (1.62%) PaaS
14 17 (1.53%) Amazon EKS
14 17 (1.53%) PowerApps
15 16 (1.44%) Amazon SageMaker
16 14 (1.26%) Azure Logic Apps
Communications & Networking
1 20 (1.80%) Wireless
2 18 (1.62%) DSL
3 11 (0.99%) Network Security
4 9 (0.81%) Firewall
5 6 (0.54%) DNS
6 3 (0.27%) NetScaler
7 1 (0.090%) 3GPP
7 1 (0.090%) 5G
7 1 (0.090%) HTTP
Database & Business Intelligence
1 286 (25.72%) Data Lake
2 231 (20.77%) Power BI
3 218 (19.60%) Data Warehouse
4 200 (17.99%) Big Data
5 193 (17.36%) Tableau
6 184 (16.55%) NoSQL
7 158 (14.21%) SQL Server
8 118 (10.61%) Apache Hive
9 104 (9.35%) Hadoop
10 103 (9.26%) HBase
11 75 (6.74%) Azure SQL Database
12 71 (6.38%) Delta Lake
13 62 (5.58%) Data Vault
14 58 (5.22%) Metadata
15 54 (4.86%) SQL Server Integration Services
16 42 (3.78%) SQL Server Analysis Services
17 33 (2.97%) BigQuery
17 33 (2.97%) MongoDB
18 31 (2.79%) SQL Server Reporting Services
19 30 (2.70%) DB2
Development Applications
1 257 (23.11%) Git
2 119 (10.70%) Jenkins
3 86 (7.73%) Bitbucket Server
4 54 (4.86%) JIRA
5 18 (1.62%) MLflow
6 8 (0.72%) CircleCI
6 8 (0.72%) Selenium
7 6 (0.54%) GitLab
7 6 (0.54%) RStudio
8 4 (0.36%) Visual Studio
9 3 (0.27%) Deequ
9 3 (0.27%) ERwin
10 2 (0.18%) ER Studio
10 2 (0.18%) JMeter
10 2 (0.18%) Maven
10 2 (0.18%) Postman
10 2 (0.18%) SpecFlow
10 2 (0.18%) Visual Studio Team System
11 1 (0.090%) Cucumber
11 1 (0.090%) SoapUI
General
1 404 (36.33%) Finance
2 296 (26.62%) Social Skills
3 295 (26.53%) Inclusion and Diversity
4 279 (25.09%) Law
5 197 (17.72%) Analytical Skills
6 180 (16.19%) Legal
7 133 (11.96%) Presentation Skills
8 121 (10.88%) Retail
9 115 (10.34%) Marketing
10 46 (4.14%) Banking
11 32 (2.88%) Financial Institution
12 21 (1.89%) Public Sector
13 20 (1.80%) Investment Banking
14 12 (1.08%) Games
14 12 (1.08%) Influencing Skills
15 10 (0.90%) Retail Banking
16 9 (0.81%) Pharmaceutical
17 8 (0.72%) Manufacturing
18 7 (0.63%) Electronics
19 6 (0.54%) Billing
Job Titles
1 400 (35.97%) Data Engineer
2 293 (26.35%) Senior
3 223 (20.05%) Software Engineer
4 138 (12.41%) Analyst
5 136 (12.23%) Lead
6 134 (12.05%) Architect
7 119 (10.70%) AWS Engineer
8 117 (10.52%) AWS Software Engineer
9 115 (10.34%) Data Analyst
10 111 (9.98%) Senior Data Engineer
11 105 (9.44%) Data Architect
12 100 (8.99%) Developer
13 89 (8.00%) Senior Analyst
14 84 (7.55%) Python Engineer
15 78 (7.01%) Senior Data Analyst
16 73 (6.56%) Azure Engineer
17 66 (5.94%) Azure Data Engineer
18 64 (5.76%) Database Engineer
19 58 (5.22%) Python Software Engineer
20 57 (5.13%) Data Scientist
Libraries, Frameworks & Software Standards
1 188 (16.91%) PySpark
2 75 (6.74%) Kafka
3 49 (4.41%) TensorFlow
4 44 (3.96%) Pandas
5 42 (3.78%) scikit-learn
6 39 (3.51%) React
7 29 (2.61%) Spring
8 25 (2.25%) .NET
9 23 (2.07%) Apache NiFi
9 23 (2.07%) REST
10 16 (1.44%) Apache Beam
10 16 (1.44%) JPA
11 14 (1.26%) PyTorch
12 13 (1.17%) Spring Boot
13 12 (1.08%) AngularJS
13 12 (1.08%) JSON
14 9 (0.81%) .NET Framework
14 9 (0.81%) Spark Streaming
14 9 (0.81%) XML
15 8 (0.72%) Apache Avro
Miscellaneous
1 240 (21.58%) Algorithms
2 74 (6.65%) Cloud Native
3 73 (6.56%) Public Cloud
4 67 (6.03%) Data Structures
5 64 (5.76%) Product Ownership
6 51 (4.59%) Reinsurance
7 43 (3.87%) Management Information System
8 42 (3.78%) Onboarding
9 34 (3.06%) Greenfield Project
10 26 (2.34%) Enterprise Software
11 22 (1.98%) Taxonomies
12 16 (1.44%) Data Centre
13 15 (1.35%) Legacy Systems
14 13 (1.17%) Distributed Systems
15 12 (1.08%) Cyberattack
15 12 (1.08%) Data Fabric
16 9 (0.81%) Data Protection Act
16 9 (0.81%) Distributed Applications
16 9 (0.81%) IoT
16 9 (0.81%) NHS
Operating Systems
1 129 (11.60%) Unix
2 29 (2.61%) Linux
3 23 (2.07%) Windows
4 12 (1.08%) zOS
5 8 (0.72%) Windows Server
6 1 (0.090%) Solaris
6 1 (0.090%) VMS
6 1 (0.090%) Windows Vista
Processes & Methodologies
1 451 (40.56%) Agile
2 447 (40.20%) Analytics
3 442 (39.75%) Machine Learning
4 414 (37.23%) Visualisation
5 381 (34.26%) CI/CD
6 355 (31.92%) ETL
7 352 (31.65%) Data Pipeline
8 322 (28.96%) Artificial Intelligence
9 305 (27.43%) Data Modelling
10 303 (27.25%) Software Engineering
11 279 (25.09%) Data Analysis
12 260 (23.38%) Continuous Improvement
13 259 (23.29%) SDLC
14 250 (22.48%) Business Intelligence
15 242 (21.76%) Operational Stability
16 226 (20.32%) Data Engineering
17 220 (19.78%) Problem-Solving
18 214 (19.24%) DevOps
19 212 (19.06%) Community of Practice
20 188 (16.91%) Data Science
Programming Languages
1 820 (73.74%) SQL
2 740 (66.55%) Python
3 171 (15.38%) Java
4 111 (9.98%) PL/SQL
5 72 (6.47%) T-SQL
6 71 (6.38%) Scala
7 45 (4.05%) Data Analysis Expressions
8 33 (2.97%) R
9 31 (2.79%) C#
10 17 (1.53%) PowerShell
11 11 (0.99%) Kotlin
12 10 (0.90%) JavaScript
13 9 (0.81%) U-SQL
14 8 (0.72%) TypeScript
15 5 (0.45%) C
16 4 (0.36%) VBA
17 2 (0.18%) C++
18 1 (0.090%) Bicep
Qualifications
1 210 (18.88%) Degree
2 145 (13.04%) DBS Check
3 42 (3.78%) Master's Degree
4 35 (3.15%) Microsoft Certification
5 26 (2.34%) Computer Science Degree
6 22 (1.98%) Azure Certification
6 22 (1.98%) Security Cleared
7 21 (1.89%) SC Cleared
8 8 (0.72%) DV Cleared
9 5 (0.45%) BPSS Clearance
10 4 (0.36%) AWS Certification
10 4 (0.36%) CIMA
10 4 (0.36%) PMI Certification
11 3 (0.27%) ISTQB
12 2 (0.18%) MCSA
12 2 (0.18%) MCSE
12 2 (0.18%) Numerate Degree
13 1 (0.090%) (ISC)2 CCSP
13 1 (0.090%) AWS Certified Solutions Architect
13 1 (0.090%) TOGAF Certification
Quality Assurance & Compliance
1 148 (13.31%) Data Quality
2 40 (3.60%) GDPR
3 32 (2.88%) QA
4 18 (1.62%) SLA
5 7 (0.63%) Accessibility
6 5 (0.45%) California Consumer Privacy Act
7 1 (0.090%) Cyber Essentials
7 1 (0.090%) HIPAA
7 1 (0.090%) ISO/IEC 27001
7 1 (0.090%) NCSC
7 1 (0.090%) NIST
7 1 (0.090%) NIST 800
System Software
1 110 (9.89%) HDFS
2 13 (1.17%) Docker
3 7 (0.63%) Virtual Machines
4 4 (0.36%) Active Directory
5 1 (0.090%) Apache Flume
5 1 (0.090%) Virtual Desktop
Systems Management
1 145 (13.04%) Terraform
2 73 (6.56%) Kubernetes
3 2 (0.18%) Ansible
3 2 (0.18%) Oracle Identity Management
Vendors
1 198 (17.81%) Microsoft
2 146 (13.13%) Informatica
3 114 (10.25%) Oracle
4 81 (7.28%) Cloudera
5 44 (3.96%) Alteryx
6 34 (3.06%) Google
7 18 (1.62%) Cognos
7 18 (1.62%) Sybase
8 12 (1.08%) F5
9 9 (0.81%) Dataiku
10 8 (0.72%) YouTube
11 6 (0.54%) SAP
12 4 (0.36%) Salesforce
13 3 (0.27%) CheckPoint
13 3 (0.27%) Citrix
14 2 (0.18%) MuleSoft
14 2 (0.18%) ServiceNow
14 2 (0.18%) SnapLogic
14 2 (0.18%) Snow
15 1 (0.090%) Sparx