Role-Based Access Control (RBAC, Role-Based Security)
UK

The table below provides summary statistics for permanent job vacancies requiring RBAC skills. It includes a benchmarking guide to the annual salaries offered in vacancies that cited RBAC over the 6 months leading up to 11 May 2025, comparing them to the same period in the previous two years.

6 months to
11 May 2025
Same period 2024 Same period 2023
Rank 603 784 459
Rank change year-on-year +181 -325 +618
Permanent jobs citing RBAC 103 114 657
As % of all permanent jobs advertised in the UK 0.19% 0.11% 0.65%
As % of the Processes & Methodologies category 0.20% 0.13% 0.68%
Number of salaries quoted 63 68 72
10th Percentile £47,500 £47,125 £38,650
25th Percentile £55,000 £48,788 £47,500
Median annual salary (50th Percentile) £65,000 £59,000 £75,000
Median % change year-on-year +10.17% -21.33% -
75th Percentile £88,750 £68,750 £89,063
90th Percentile £95,000 £85,225 £97,500
UK excluding London median annual salary £55,000 £57,500 £57,500
% change year-on-year -4.35% - -0.86%

All Process and Methodology Skills
UK

RBAC falls under the Processes and Methodologies category. For comparison with the information above, the following table provides summary statistics for all permanent job vacancies requiring process or methodology skills.

Permanent vacancies with a requirement for process or methodology skills 51,302 84,920 96,579
As % of all permanent jobs advertised in the UK 93.76% 85.59% 95.61%
Number of salaries quoted 27,015 59,883 56,845
10th Percentile £30,000 £29,008 £34,000
25th Percentile £42,500 £40,000 £45,000
Median annual salary (50th Percentile) £57,500 £55,000 £61,180
Median % change year-on-year +4.55% -10.10% +1.97%
75th Percentile £75,000 £72,500 £81,250
90th Percentile £98,474 £92,500 £100,000
UK excluding London median annual salary £52,500 £50,000 £55,000
% change year-on-year +5.00% -9.09% +4.76%

RBAC
Job Vacancy Trend

Job postings citing RBAC as a proportion of all IT jobs advertised.
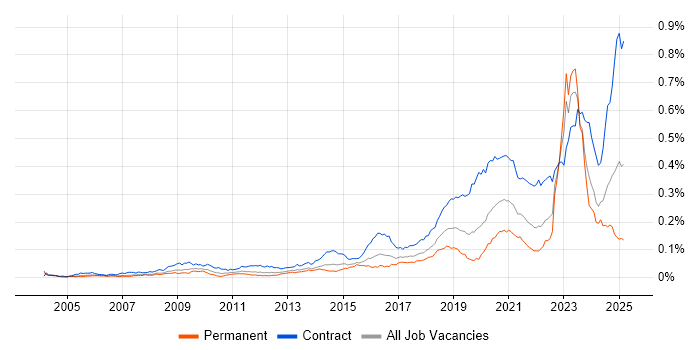
Job vacancy trend for RBAC in the UK

RBAC
Salary Trend

3-month moving average salary quoted in jobs citing RBAC.

Salary trend for RBAC in the UK

RBAC
Salary Histogram

Salary distribution for jobs citing RBAC over the 6 months to 11 May 2025.

Salary histogram for RBAC in the UK

RBAC
Top 14 Job Locations

The table below looks at the demand and provides a guide to the median salaries quoted in IT jobs citing RBAC within the UK over the 6 months to 11 May 2025. The 'Rank Change' column provides an indication of the change in demand within each location based on the same 6 month period last year.

Location Rank Change
on Same Period
Last Year
Matching
Permanent
IT Job Ads
Median Salary
Past 6 Months
Median Salary
% Change
on Same Period
Last Year
Live
Jobs
England +156 95 £67,500 +14.41% 129
UK excluding London +170 61 £55,000 -4.35% 87
London +116 39 £90,000 +33.33% 58
Work from Home +158 33 £80,000 +35.59% 78
South East +105 18 £66,250 +12.29% 35
South West +110 14 £51,500 -1.90% 10
Midlands +59 13 £65,000 -10.34% 18
North of England +64 8 £55,000 +10.00% 12
West Midlands +52 7 £65,000 -10.34% 7
Scotland +125 6 £55,000 +10.00% 4
East Midlands +46 6 £80,000 - 10
North West +2 5 £55,000 +12.82% 4
Yorkshire +69 3 - - 8
East of England +28 2 £47,500 -17.39% 9

RBAC
Co-occurring Skills and Capabilities by Category

The follow tables expand on the table above by listing co-occurrences grouped by category. The same employment type, locality and period is covered with up to 20 co-occurrences shown in each of the following categories:

Application Platforms
1 8 (7.77%) SharePoint
2 7 (6.80%) Microsoft Exchange
3 5 (4.85%) Oracle Workflow
4 2 (1.94%) Confluence
5 1 (0.97%) Apache
5 1 (0.97%) Apache Spark
5 1 (0.97%) NetWeaver
Applications
1 2 (1.94%) Oracle Smart View
1 2 (1.94%) Spreadsheet
2 1 (0.97%) Microsoft Excel
2 1 (0.97%) Microsoft PowerPoint
2 1 (0.97%) MS Visio
Business Applications
1 3 (2.91%) NetSuite
2 2 (1.94%) Oracle Assets
2 2 (1.94%) Oracle Cash Management
2 2 (1.94%) Oracle ERP
2 2 (1.94%) Oracle Financials
2 2 (1.94%) Oracle General Ledger
2 2 (1.94%) Oracle Payables
2 2 (1.94%) Oracle Receivables
3 1 (0.97%) Magento
3 1 (0.97%) SAP HCM
3 1 (0.97%) Shopify
3 1 (0.97%) Workday HCM
Cloud Services
1 65 (63.11%) Azure
2 40 (38.83%) Entra ID
3 32 (31.07%) AWS
4 31 (30.10%) Power Platform
5 27 (26.21%) PaaS
6 24 (23.30%) Azure DevOps
6 24 (23.30%) Azure Monitor
7 21 (20.39%) IaaS
7 21 (20.39%) SaaS
8 20 (19.42%) Azure ExpressRoute
9 19 (18.45%) Azure Key Vault
9 19 (18.45%) Power Automate
10 16 (15.53%) Azure AI
10 16 (15.53%) Azure Service Bus
11 13 (12.62%) GCP
12 12 (11.65%) OpenShift
13 10 (9.71%) Microsoft Purview
14 9 (8.74%) Collibra
14 9 (8.74%) GitHub
15 7 (6.80%) Serverless
Communications & Networking
1 34 (33.01%) Firewall
2 27 (26.21%) DNS
3 20 (19.42%) SD-WAN
3 20 (19.42%) WAN
4 19 (18.45%) VPN
5 12 (11.65%) Network Security
6 8 (7.77%) DHCP
7 7 (6.80%) SMTP
8 6 (5.83%) Kerberos
8 6 (5.83%) Remote Desktop
9 2 (1.94%) LAN
10 1 (0.97%) Intranet
10 1 (0.97%) SSL
Database & Business Intelligence
1 28 (27.18%) Power BI
2 18 (17.48%) Data Lake
3 16 (15.53%) MySQL
4 9 (8.74%) IBM InfoSphere
4 9 (8.74%) Metadata
4 9 (8.74%) Tableau
5 6 (5.83%) Amazon RDS
6 3 (2.91%) Azure SQL Database
6 3 (2.91%) Data Warehouse
6 3 (2.91%) Oracle Reports
7 2 (1.94%) Azure SQL Data Warehouse
7 2 (1.94%) HDInsight
7 2 (1.94%) NoSQL
7 2 (1.94%) SQL Server
8 1 (0.97%) Big Data
8 1 (0.97%) Hadoop
8 1 (0.97%) Neo4j
8 1 (0.97%) SQL Server Integration Services
8 1 (0.97%) SQL Server Reporting Services
8 1 (0.97%) Sybase ASE
Development Applications
1 16 (15.53%) Git
2 4 (3.88%) JIRA
2 4 (3.88%) Postman
2 4 (3.88%) SoapUI
3 3 (2.91%) Cypress.io
3 3 (2.91%) JMeter
3 3 (2.91%) Mocha
3 3 (2.91%) MSTest
3 3 (2.91%) NUnit
3 3 (2.91%) Oracle Forms
3 3 (2.91%) Selenium
3 3 (2.91%) SpecFlow
4 2 (1.94%) GitLab
4 2 (1.94%) Octopus Deploy
5 1 (0.97%) Burp Suite
5 1 (0.97%) Metasploit
5 1 (0.97%) REST Assured
5 1 (0.97%) SQL Server Management Studio (SSMS)
5 1 (0.97%) TeamCity
General
1 31 (30.10%) Finance
1 31 (30.10%) Social Skills
2 12 (11.65%) Marketing
3 10 (9.71%) Analytical Skills
4 9 (8.74%) Inclusion and Diversity
4 9 (8.74%) Law
5 7 (6.80%) Public Sector
6 6 (5.83%) Banking
7 3 (2.91%) Documentation Skills
7 3 (2.91%) Front Office
7 3 (2.91%) Legal
7 3 (2.91%) Presentation Skills
8 2 (1.94%) Advertising
8 2 (1.94%) General Ledger
8 2 (1.94%) Local Government
8 2 (1.94%) Retail
9 1 (0.97%) Automotive
9 1 (0.97%) Telecoms
Job Titles
1 23 (22.33%) Architect
2 17 (16.50%) Cloud Architect
3 16 (15.53%) Lead
4 12 (11.65%) Analyst
4 12 (11.65%) Azure Engineer
5 11 (10.68%) Cloud Engineer
5 11 (10.68%) Infrastructure Engineer
6 9 (8.74%) Data Steward
7 7 (6.80%) Cybersecurity Analyst
7 7 (6.80%) Security Analyst
8 6 (5.83%) Infrastructure Support
8 6 (5.83%) Infrastructure Support Engineer
8 6 (5.83%) Senior
8 6 (5.83%) Support Engineer
9 5 (4.85%) Cloud Platform Engineer
9 5 (4.85%) Identity and Access Management Engineer
9 5 (4.85%) Identity Management Engineer
9 5 (4.85%) Platform Engineer
10 4 (3.88%) Active Directory Engineer
10 4 (3.88%) Azure Infrastructure Engineer
Libraries, Frameworks & Software Standards
1 9 (8.74%) OAuth
2 8 (7.77%) OpenID
2 8 (7.77%) SAML
3 6 (5.83%) LDAP
4 5 (4.85%) SailPoint
5 4 (3.88%) REST
5 4 (3.88%) YAML
6 3 (2.91%) Jest
6 3 (2.91%) Playwright
6 3 (2.91%) Swagger
6 3 (2.91%) Web Services
6 3 (2.91%) WebdriverIO
7 2 (1.94%) ARM Templates
7 2 (1.94%) Oracle Fusion
7 2 (1.94%) SOAP
8 1 (0.97%) Blazor
8 1 (0.97%) JDBC
8 1 (0.97%) jQuery
8 1 (0.97%) JWT
8 1 (0.97%) OAuth2
Miscellaneous
1 16 (15.53%) Data Centre
1 16 (15.53%) NHS
2 13 (12.62%) PKI
3 9 (8.74%) Onboarding
4 6 (5.83%) Clustering
4 6 (5.83%) Legacy Systems
5 5 (4.85%) Product Ownership
6 4 (3.88%) Cloud Native
7 3 (2.91%) Foreign Exchange (FX)
7 3 (2.91%) Management Information System
8 2 (1.94%) CMDB
8 2 (1.94%) Enterprise Cloud
8 2 (1.94%) Enterprise Software
8 2 (1.94%) Hybrid Cloud
8 2 (1.94%) Security Posture
8 2 (1.94%) Self-Motivation
8 2 (1.94%) Virtual Team
9 1 (0.97%) Cloud Security Posture
9 1 (0.97%) IoT
9 1 (0.97%) Private Cloud
Operating Systems
1 20 (19.42%) Windows
2 13 (12.62%) Windows Server
3 8 (7.77%) Linux
4 1 (0.97%) Red Hat Enterprise Linux
4 1 (0.97%) VMS
4 1 (0.97%) Windows Server 2003
Processes & Methodologies
1 35 (33.98%) Agile
2 34 (33.01%) CI/CD
2 34 (33.01%) Infrastructure as Code
3 32 (31.07%) DevOps
4 28 (27.18%) Analytics
4 28 (27.18%) Data Integration
5 26 (25.24%) Problem-Solving
6 25 (24.27%) Migration
7 23 (22.33%) Log Analytics
8 22 (21.36%) Project Management
9 20 (19.42%) ITIL
10 19 (18.45%) Network Virtualisation
11 18 (17.48%) B2B
11 18 (17.48%) Roadmaps
11 18 (17.48%) Service Management
12 17 (16.50%) Artificial Intelligence
12 17 (16.50%) TOGAF
13 16 (15.53%) Data Analysis
13 16 (15.53%) Waterfall
13 16 (15.53%) Zachman Framework
Programming Languages
1 44 (42.72%) PowerShell
2 32 (31.07%) SQL
3 18 (17.48%) Bicep
4 12 (11.65%) Python
5 6 (5.83%) JavaScript
6 4 (3.88%) C#
6 4 (3.88%) Java
7 3 (2.91%) TypeScript
8 2 (1.94%) Bash
9 1 (0.97%) ABAP
9 1 (0.97%) Cypher
9 1 (0.97%) Scala
9 1 (0.97%) T-SQL
9 1 (0.97%) VBScript
Qualifications
1 23 (22.33%) Azure Certification
2 18 (17.48%) DBS Check
2 18 (17.48%) Security Cleared
3 12 (11.65%) DV Cleared
4 8 (7.77%) CISSP
4 8 (7.77%) Degree
5 7 (6.80%) SC Cleared
6 6 (5.83%) Microsoft Certification
7 5 (4.85%) CISM
8 4 (3.88%) ISTQB
8 4 (3.88%) ISTQB Foundation Certification
9 2 (1.94%) BPSS Clearance
9 2 (1.94%) CTC Cleared
10 1 (0.97%) (ISC)2 CCSP
10 1 (0.97%) AWS Certification
10 1 (0.97%) AWS Certified Solutions Architect
10 1 (0.97%) CCSP
10 1 (0.97%) Cisco Certification
10 1 (0.97%) Computer Science Degree
Quality Assurance & Compliance
1 25 (24.27%) GDPR
2 16 (15.53%) Accessibility
3 9 (8.74%) Data Quality
3 9 (8.74%) NIST
4 4 (3.88%) QA
5 3 (2.91%) ISO/IEC 27001
6 1 (0.97%) Cyber Essentials
6 1 (0.97%) NCSC
System Software
1 30 (29.13%) Active Directory
2 19 (18.45%) Virtual Machines
3 12 (11.65%) Docker
4 8 (7.77%) VMware Infrastructure
5 7 (6.80%) Hyper-V
6 6 (5.83%) BitLocker
6 6 (5.83%) Microsoft App-V
6 6 (5.83%) Terminal Services
6 6 (5.83%) VMware ESXi
6 6 (5.83%) vSphere
7 1 (0.97%) Virtual Desktop
Systems Management
1 27 (26.21%) Single Sign-On
2 21 (20.39%) Terraform
3 18 (17.48%) Kubernetes
4 7 (6.80%) Ansible
5 6 (5.83%) Nagios
5 6 (5.83%) Puppet
5 6 (5.83%) vCenter Server
5 6 (5.83%) vMotion
6 5 (4.85%) QRadar
7 4 (3.88%) Microsoft Intune
8 2 (1.94%) Active Directory Federation Services
9 1 (0.97%) Nessus
9 1 (0.97%) SCCM
9 1 (0.97%) SCOM
Vendors
1 35 (33.98%) Microsoft
2 19 (18.45%) Databricks
3 17 (16.50%) Meraki
4 13 (12.62%) VMware
5 9 (8.74%) IBM
5 9 (8.74%) Informatica
6 8 (7.77%) Citrix
7 6 (5.83%) Google
7 6 (5.83%) HP
7 6 (5.83%) Oracle
7 6 (5.83%) Splunk
7 6 (5.83%) Symantec
8 5 (4.85%) SolarWinds
9 3 (2.91%) Ping Identity
9 3 (2.91%) ServiceNow
10 2 (1.94%) SAP
11 1 (0.97%) Red Hat
11 1 (0.97%) Sybase
11 1 (0.97%) Workday
11 1 (0.97%) Zscaler