Kanban Jobs with Hybrid/Remote/WFH Options

Kanban
UK > Work from Home

The table below provides summary statistics for permanent remote or hybrid work requiring Kanban skills. It includes a benchmarking guide to the annual salaries offered in vacancies that cited Kanban over the 6 months leading up to 7 May 2025, comparing them to the same period in the previous two years.

6 months to
7 May 2025
Same period 2024 Same period 2023
Rank 259 135 184
Rank change year-on-year -124 +49 -59
Permanent jobs citing Kanban 178 783 818
As % of all permanent jobs with a WFH option 1.08% 2.31% 1.93%
As % of the Processes & Methodologies category 1.16% 2.52% 2.01%
Number of salaries quoted 108 623 383
10th Percentile £46,250 £43,329 £45,102
25th Percentile £52,500 £48,750 £51,634
Median annual salary (50th Percentile) £60,000 £62,500 £67,500
Median % change year-on-year -4.00% -7.41% +8.00%
75th Percentile £80,000 £83,750 £83,750
90th Percentile £98,875 £88,500 £96,250
UK median annual salary £65,000 £65,000 £69,447
% change year-on-year - -6.40% +6.84%

All Process and Methodology Skills
Work from Home

Kanban falls under the Processes and Methodologies category. For comparison with the information above, the following table provides summary statistics for all permanent job vacancies with remote or hybrid options requiring process or methodology skills.

Permanent vacancies with a requirement for process or methodology skills 15,361 31,014 40,730
As % of all permanent jobs with a WFH option 93.62% 91.60% 96.11%
Number of salaries quoted 9,801 23,557 28,305
10th Percentile £29,913 £33,750 £37,500
25th Percentile £45,000 £42,500 £47,500
Median annual salary (50th Percentile) £60,000 £57,500 £62,500
Median % change year-on-year +4.35% -8.00% +4.17%
75th Percentile £77,500 £75,000 £82,500
90th Percentile £102,500 £95,000 £100,000
UK median annual salary £57,500 £55,000 £61,500
% change year-on-year +4.55% -10.57% +2.50%

Kanban
Trend for Jobs with a WFH Option

Job vacancies with remote working options citing Kanban as a proportion of all IT jobs advertised.
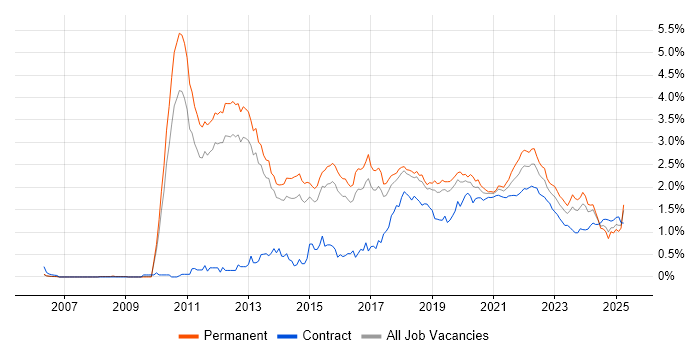
Kanban trend for jobs with Hybrid/Remote/WFH options

Kanban
Salary Trend for Jobs with a WFH Option

3-month moving average salary quoted in job vacancies with remote working options citing Kanban.

Kanban salary trend for jobs with a WFH option

Kanban
Salary Histogram for Jobs with a WFH Option

Salary distribution for jobs with remote working options citing Kanban over the 6 months to 7 May 2025.

Kanban salary histogram for jobs with a WFH option

Kanban
Co-occurring Skills and Capabilities with WFH Options by Category

The follow tables expand on the table above by listing co-occurrences grouped by category. The same employment type, locality and period is covered with up to 20 co-occurrences shown in each of the following categories:

Application Platforms
1 10 (5.62%) Confluence
2 2 (1.12%) Apache
2 2 (1.12%) Apache Spark
2 2 (1.12%) CMS
Applications
1 5 (2.81%) Trello
2 4 (2.25%) Microsoft Excel
3 2 (1.12%) Microsoft Project
4 1 (0.56%) Microsoft Office
4 1 (0.56%) MS Visio
4 1 (0.56%) Simulink
Business Applications
1 9 (5.06%) NetSuite
2 2 (1.12%) Magento
3 1 (0.56%) Shopify
Cloud Services
1 118 (66.29%) AWS
2 97 (54.49%) Azure
3 50 (28.09%) AWS CloudFormation
4 49 (27.53%) Amazon EKS
5 34 (19.10%) Serverless
6 32 (17.98%) AWS Lambda
7 13 (7.30%) GCP
8 12 (6.74%) SaaS
9 11 (6.18%) Azure DevOps
10 10 (5.62%) Boomi
11 9 (5.06%) GitHub
11 9 (5.06%) Power Platform
12 7 (3.93%) PaaS
13 4 (2.25%) Azure Cosmos DB
13 4 (2.25%) Google Analytics
13 4 (2.25%) Google Data Studio
13 4 (2.25%) Google Sheets
13 4 (2.25%) Google Tag Manager
14 3 (1.69%) AWS Step Functions
14 3 (1.69%) Azure Logic Apps
Communications & Networking
1 1 (0.56%) Firewall
1 1 (0.56%) Internet
Database & Business Intelligence
1 61 (34.27%) Elasticsearch
2 32 (17.98%) DynamoDB
3 20 (11.24%) MongoDB
4 16 (8.99%) Azure SQL Database
5 13 (7.30%) SQL Server
6 11 (6.18%) Relational Database
7 9 (5.06%) Power BI
8 5 (2.81%) NoSQL
9 4 (2.25%) PostgreSQL
9 4 (2.25%) Power Query
10 3 (1.69%) MySQL
11 2 (1.12%) Cloud Spanner
11 2 (1.12%) Electronic Patient Records
12 1 (0.56%) Amazon Aurora
12 1 (0.56%) Amazon RDS
12 1 (0.56%) Big Data
12 1 (0.56%) Oracle Database
12 1 (0.56%) Pinecone
12 1 (0.56%) Tableau
12 1 (0.56%) Triplestore
Development Applications
1 23 (12.92%) JIRA
2 12 (6.74%) Git
3 5 (2.81%) Jenkins
4 4 (2.25%) GitLab
4 4 (2.25%) JMeter
4 4 (2.25%) Visual Studio
5 3 (1.69%) Cypress.io
5 3 (1.69%) Gatling
5 3 (1.69%) Selenium
6 2 (1.12%) REST Assured
7 1 (0.56%) Babel
7 1 (0.56%) Bitbucket
7 1 (0.56%) Locust
7 1 (0.56%) MSTest
7 1 (0.56%) Oracle APEX
7 1 (0.56%) Postman
7 1 (0.56%) SonarQube
7 1 (0.56%) TestRail
7 1 (0.56%) webpack
7 1 (0.56%) xUnit.net
General
1 58 (32.58%) Analytical Skills
2 51 (28.65%) Inclusion and Diversity
3 37 (20.79%) Social Skills
4 22 (12.36%) Finance
5 9 (5.06%) Retail
6 7 (3.93%) Public Sector
7 6 (3.37%) Back Office
7 6 (3.37%) Marketing
8 3 (1.69%) Front Office
9 2 (1.12%) Advertising
9 2 (1.12%) Banking
9 2 (1.12%) Manufacturing
9 2 (1.12%) Organisational Skills
10 1 (0.56%) Aerospace
10 1 (0.56%) Electronics
10 1 (0.56%) Law
10 1 (0.56%) Military
10 1 (0.56%) Police
10 1 (0.56%) Presentation Skills
Job Titles
1 119 (66.85%) Developer
2 70 (39.33%) Software Developer
3 57 (32.02%) Senior
4 45 (25.28%) Senior Developer
5 21 (11.80%) .NET Developer
6 19 (10.67%) Senior Software Developer
7 14 (7.87%) Full-Stack Developer
8 11 (6.18%) Senior Full-Stack Developer
9 10 (5.62%) Delivery Manager
10 9 (5.06%) Architect
10 9 (5.06%) NetSuite Developer
10 9 (5.06%) Solutions Architect
10 9 (5.06%) Technical Developer
11 8 (4.49%) Software Engineer
12 7 (3.93%) Agile Delivery Manager
13 6 (3.37%) Analyst
13 6 (3.37%) Senior .NET Developer
14 5 (2.81%) Applications Architect
14 5 (2.81%) Senior Architect
14 5 (2.81%) Senior Solutions Architect
Libraries, Frameworks & Software Standards
1 97 (54.49%) Node.js
2 79 (44.38%) .NET
3 50 (28.09%) React
4 49 (27.53%) Pandas
5 33 (18.54%) GraphQL
6 20 (11.24%) .NET Core
7 18 (10.11%) ASP.NET Web API
8 13 (7.30%) .NET Framework
8 13 (7.30%) AngularJS
8 13 (7.30%) CSS
8 13 (7.30%) Entity Framework
8 13 (7.30%) HTML
9 12 (6.74%) ASP.NET
9 12 (6.74%) ASP.NET MVC
9 12 (6.74%) Vue
10 9 (5.06%) Middleware
10 9 (5.06%) OAuth
10 9 (5.06%) SAML
10 9 (5.06%) Web Services
10 9 (5.06%) XML
Miscellaneous
1 49 (27.53%) Cyberattack
2 11 (6.18%) Virtual Team
3 10 (5.62%) Product Ownership
4 6 (3.37%) Management Information System
5 4 (2.25%) PMI
5 4 (2.25%) Social Media
6 3 (1.69%) Public Cloud
7 2 (1.12%) Cloud Native
7 2 (1.12%) Data Centre
7 2 (1.12%) Private Cloud
8 1 (0.56%) Algorithms
8 1 (0.56%) Data Structures
8 1 (0.56%) Distributed Architecture
8 1 (0.56%) Distributed Systems
8 1 (0.56%) Enterprise Software
8 1 (0.56%) IoT
8 1 (0.56%) Legacy Systems
8 1 (0.56%) Self-Motivation
8 1 (0.56%) Team-Oriented Environment
8 1 (0.56%) VLSI
Operating Systems
1 51 (28.65%) Linux
2 49 (27.53%) Android
3 1 (0.56%) Debian
Processes & Methodologies
1 142 (79.78%) Agile
2 81 (45.51%) Secure Coding
3 77 (43.26%) Scrum
4 70 (39.33%) CI/CD
5 68 (38.20%) Software Engineering
6 64 (35.96%) Collaborative Working
7 59 (33.15%) OOP
8 58 (32.58%) Design Patterns
9 57 (32.02%) Containerisation
10 55 (30.90%) Microservices
11 51 (28.65%) Mathematics
11 51 (28.65%) OWASP
12 50 (28.09%) OO
13 49 (27.53%) Android Development
13 49 (27.53%) Full-Stack Development
13 49 (27.53%) Line Management
13 49 (27.53%) Statistics
14 41 (23.03%) Test Automation
15 33 (18.54%) Clean Code
15 33 (18.54%) Functional Programming
Programming Languages
1 78 (43.82%) JavaScript
2 59 (33.15%) Python
3 58 (32.58%) Java
4 52 (29.21%) TypeScript
5 51 (28.65%) Go
6 49 (27.53%) C++
6 49 (27.53%) Rust
7 39 (21.91%) SQL
8 35 (19.66%) C#
9 3 (1.69%) Ruby
10 2 (1.12%) Scala
11 1 (0.56%) Ada
11 1 (0.56%) Bash
11 1 (0.56%) MATLAB
11 1 (0.56%) PHP
11 1 (0.56%) PowerShell
11 1 (0.56%) SHACL
11 1 (0.56%) SPARQL
11 1 (0.56%) T-SQL
Qualifications
1 60 (33.71%) Security Cleared
2 49 (27.53%) DV Cleared
3 11 (6.18%) Degree
4 10 (5.62%) SC Cleared
5 5 (2.81%) BPSS Clearance
6 4 (2.25%) AWS Certification
6 4 (2.25%) Azure Certification
6 4 (2.25%) Computer Science Degree
6 4 (2.25%) PMI Certification
7 3 (1.69%) AWS Certified Solutions Architect
7 3 (1.69%) CSPO
7 3 (1.69%) ISTQB
7 3 (1.69%) PMP
7 3 (1.69%) TOGAF Certification
8 2 (1.12%) ISTQB Foundation Certification
9 1 (0.56%) CISSP
9 1 (0.56%) DBS Check
9 1 (0.56%) ITIL Certification
9 1 (0.56%) PRINCE2 Certification
Quality Assurance & Compliance
1 6 (3.37%) QA
2 1 (0.56%) Accessibility
2 1 (0.56%) Data Quality
2 1 (0.56%) DO-254
2 1 (0.56%) GDPR
2 1 (0.56%) PMO
System Software
1 54 (30.34%) Docker
2 1 (0.56%) Firmware
2 1 (0.56%) VMware ESXi
2 1 (0.56%) VMware Infrastructure
Systems Management
1 53 (29.78%) Kubernetes
2 51 (28.65%) Terraform
3 50 (28.09%) Ansible
4 9 (5.06%) Single Sign-On
5 1 (0.56%) Argo
5 1 (0.56%) HP Quality Center
5 1 (0.56%) Progress Chef
5 1 (0.56%) Puppet
5 1 (0.56%) vCenter Server
Vendors
1 18 (10.11%) Microsoft
2 12 (6.74%) Google
3 10 (5.62%) MuleSoft
4 6 (3.37%) Oracle
5 5 (2.81%) IBM
5 5 (2.81%) Salesforce
6 4 (2.25%) Splunk
7 2 (1.12%) Adobe
8 1 (0.56%) Atlassian
8 1 (0.56%) Facebook
8 1 (0.56%) New Relic
8 1 (0.56%) OpenAI
8 1 (0.56%) Red Hat
8 1 (0.56%) VMware
8 1 (0.56%) Xilinx
8 1 (0.56%) YouTube