Accessibility Jobs with Hybrid/Remote/WFH Options

Accessibility (a11y)
UK > Work from Home

The table below provides summary statistics for permanent remote or hybrid work requiring Accessibility skills. It includes a benchmarking guide to the annual salaries offered in vacancies that cited Accessibility over the 6 months leading up to 10 May 2025, comparing them to the same period in the previous two years.

6 months to
10 May 2025
Same period 2024 Same period 2023
Rank 131 265 271
Rank change year-on-year +134 +6 -48
Permanent jobs citing Accessibility 440 401 510
As % of all permanent jobs with a WFH option 2.63% 1.19% 1.23%
As % of the Quality Assurance & Compliance category 14.28% 9.35% 8.40%
Number of salaries quoted 138 294 326
10th Percentile £40,875 £33,250 £36,250
25th Percentile £50,000 £40,988 £47,500
Median annual salary (50th Percentile) £56,001 £57,500 £58,750
Median % change year-on-year -2.61% -2.13% +10.62%
75th Percentile £68,750 £65,000 £75,000
90th Percentile £87,500 £97,500 £90,000
UK median annual salary £57,500 £52,500 £57,500
% change year-on-year +9.52% -8.70% +8.26%

All Quality Assurance and Compliance Skills
Work from Home

Accessibility falls under the Quality Assurance and Compliance category. For comparison with the information above, the following table provides summary statistics for all permanent job vacancies with remote or hybrid options requiring quality assurance or compliance skills.

Permanent vacancies with a requirement for quality assurance or compliance skills 3,081 4,288 6,071
As % of all permanent jobs with a WFH option 18.40% 12.70% 14.64%
Number of salaries quoted 1,811 3,245 4,106
10th Percentile £37,170 £34,500 £36,250
25th Percentile £47,500 £42,500 £46,250
Median annual salary (50th Percentile) £64,000 £57,500 £60,000
Median % change year-on-year +11.30% -4.17% +9.09%
75th Percentile £75,000 £73,750 £77,500
90th Percentile £93,750 £95,000 £92,500
UK median annual salary £60,000 £52,500 £57,500
% change year-on-year +14.29% -8.70% +4.55%

Accessibility
Trend for Jobs with a WFH Option

Job vacancies with remote working options citing Accessibility as a proportion of all IT jobs advertised.
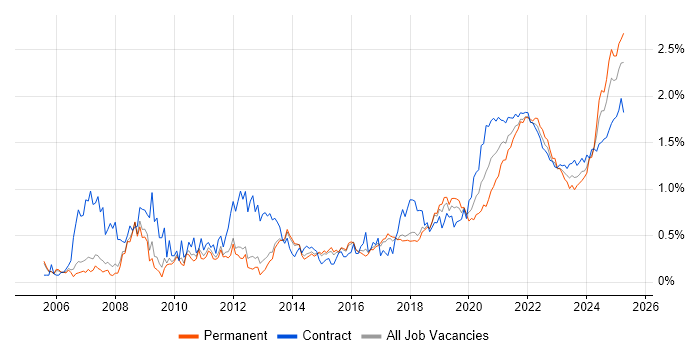
Accessibility trend for jobs with Hybrid/Remote/WFH options

Accessibility
Salary Trend for Jobs with a WFH Option

3-month moving average salary quoted in job vacancies with remote working options citing Accessibility.

Accessibility salary trend for jobs with a WFH option

Accessibility
Salary Histogram for Jobs with a WFH Option

Salary distribution for jobs with remote working options citing Accessibility over the 6 months to 10 May 2025.

Accessibility salary histogram for jobs with a WFH option

Accessibility
Co-occurring Skills and Capabilities with WFH Options by Category

The follow tables expand on the table above by listing co-occurrences grouped by category. The same employment type, locality and period is covered with up to 20 co-occurrences shown in each of the following categories:

Application Platforms
1 40 (9.09%) CMS
2 26 (5.91%) WordPress
3 12 (2.73%) Apache
4 10 (2.27%) Apache Spark
5 9 (2.05%) Apache Airflow
6 7 (1.59%) Umbraco
7 6 (1.36%) Confluence
7 6 (1.36%) Drupal
8 3 (0.68%) GemFire
8 3 (0.68%) SharePoint
9 2 (0.45%) Adobe Experience Manager
9 2 (0.45%) ColdFusion
9 2 (0.45%) IBM Domino
10 1 (0.23%) nginx
Applications
1 13 (2.95%) Adobe XD
2 8 (1.82%) Photoshop
3 7 (1.59%) Microsoft Excel
3 7 (1.59%) Sketch
4 6 (1.36%) Microsoft PowerPoint
5 5 (1.14%) Adobe Illustrator
6 4 (0.91%) Adobe Premiere
6 4 (0.91%) Microsoft Project
6 4 (0.91%) Trello
7 3 (0.68%) Adobe Creative Suite
7 3 (0.68%) Microsoft Office
7 3 (0.68%) MS Visio
8 2 (0.45%) Chatbot
9 1 (0.23%) InVision
9 1 (0.23%) Simulink
9 1 (0.23%) Spreadsheet
Business Applications
1 11 (2.50%) JDE OneWorld
1 11 (2.50%) NetSuite
2 8 (1.82%) NEC Housing
3 4 (0.91%) Endur
3 4 (0.91%) Oracle Applications
3 4 (0.91%) Oracle EBS
4 3 (0.68%) Dynamics CRM
5 1 (0.23%) Fidessa
5 1 (0.23%) Salesforce CRM
5 1 (0.23%) SAP ERP
5 1 (0.23%) SAP Oil and Gas
Cloud Services
1 92 (20.91%) Azure
2 75 (17.05%) AWS
3 28 (6.36%) Power Platform
4 19 (4.32%) Azure DevOps
4 19 (4.32%) Figma
5 15 (3.41%) Dynamics 365
6 14 (3.18%) Google Analytics
7 12 (2.73%) OpenShift
7 12 (2.73%) PowerApps
8 11 (2.50%) Boomi
9 8 (1.82%) GitHub
9 8 (1.82%) SaaS
10 7 (1.59%) Stripe
11 6 (1.36%) Azure Data Factory
11 6 (1.36%) npm
12 5 (1.14%) GCP
12 5 (1.14%) Google Ads
13 4 (0.91%) Adobe Analytics
13 4 (0.91%) Serverless
13 4 (0.91%) Yarn
Communications & Networking
1 5 (1.14%) Intranet
2 2 (0.45%) HTTP
3 1 (0.23%) FIX Connectivity
3 1 (0.23%) Internet
Database & Business Intelligence
1 62 (14.09%) SQL Server
2 20 (4.55%) NoSQL
3 17 (3.86%) Data Warehouse
4 12 (2.73%) Oracle Database
4 12 (2.73%) Power BI
4 12 (2.73%) Relational Database
5 9 (2.05%) Hadoop
6 8 (1.82%) Apache Hudi
6 8 (1.82%) Apache Iceberg
6 8 (1.82%) Delta Lake
6 8 (1.82%) MongoDB
7 6 (1.36%) GIS
8 5 (1.14%) BigQuery
8 5 (1.14%) MySQL
8 5 (1.14%) Tableau
9 4 (0.91%) Big Data
9 4 (0.91%) Oracle Exadata
9 4 (0.91%) PostgreSQL
9 4 (0.91%) Redis
10 3 (0.68%) InterSystems Cache
Development Applications
1 67 (15.23%) JIRA
2 62 (14.09%) Bitbucket
3 57 (12.95%) Selenium
4 55 (12.50%) GitLab
5 54 (12.27%) Cucumber
5 54 (12.27%) Maven
5 54 (12.27%) SonarQube
5 54 (12.27%) Sonatype Nexus
6 22 (5.00%) Git
7 14 (3.18%) webpack
8 9 (2.05%) Jenkins
9 8 (1.82%) Cypress.io
9 8 (1.82%) Vite
10 7 (1.59%) Axure RP
10 7 (1.59%) Balsamiq
11 5 (1.14%) TeamCity
12 4 (0.91%) Babel
12 4 (0.91%) Eclipse
13 3 (0.68%) MSTest
13 3 (0.68%) NUnit
General
1 207 (47.05%) Finance
2 140 (31.82%) Banking
3 85 (19.32%) Inclusion and Diversity
4 73 (16.59%) Social Skills
5 66 (15.00%) Retail
6 58 (13.18%) Law
7 57 (12.95%) Investment Banking
8 54 (12.27%) Corporate Banking
9 37 (8.41%) Legal
10 35 (7.95%) Analytical Skills
11 32 (7.27%) Public Sector
12 25 (5.68%) Marketing
13 22 (5.00%) Tech for Good
14 17 (3.86%) Organisational Skills
15 15 (3.41%) Local Government
16 14 (3.18%) Games
17 10 (2.27%) Front Office
18 9 (2.05%) Influencing Skills
18 9 (2.05%) Police
18 9 (2.05%) Publishing
Job Titles
1 107 (24.32%) Senior
2 74 (16.82%) Designer
3 72 (16.36%) Software Engineer
4 68 (15.45%) Developer
5 55 (12.50%) UX Designer
6 46 (10.45%) Senior Designer
7 45 (10.23%) Senior UX Designer
8 27 (6.14%) Lead
9 21 (4.77%) UX Developer
10 20 (4.55%) Analyst
11 19 (4.32%) Senior Developer
12 18 (4.09%) Front-End Developer (Client-Side Developer)
13 15 (3.41%) Gen AI Engineer
14 14 (3.18%) Development Manager
15 13 (2.95%) Application Development Manager
15 13 (2.95%) Applications Development Manager
15 13 (2.95%) Applications Manager
16 12 (2.73%) Data Engineer
17 11 (2.50%) Front-End Engineer (Client-Side Engineer)
17 11 (2.50%) NetSuite Developer
Libraries, Frameworks & Software Standards
1 118 (26.82%) CSS
2 116 (26.36%) HTML
3 90 (20.45%) React
4 86 (19.55%) REST
5 78 (17.73%) CSS3
6 66 (15.00%) HTML5
7 65 (14.77%) Kafka
7 65 (14.77%) RESTful
8 60 (13.64%) Jest
8 60 (13.64%) Spring
9 58 (13.18%) Redux
10 55 (12.50%) Sass
10 55 (12.50%) Spring Boot
11 54 (12.27%) JPA
12 25 (5.68%) .NET
13 16 (3.64%) JSON
13 16 (3.64%) SOAP
13 16 (3.64%) Web Services
14 13 (2.95%) Vue
15 12 (2.73%) jQuery
Miscellaneous
1 70 (15.91%) Product Ownership
2 57 (12.95%) Enterprise Software
3 21 (4.77%) Management Information System
4 19 (4.32%) Algorithms
4 19 (4.32%) Social Media
5 14 (3.18%) Greenfield Project
6 13 (2.95%) Derivative
7 12 (2.73%) Self-Motivation
7 12 (2.73%) Virtual Team
8 11 (2.50%) NHS
9 7 (1.59%) Cloud Native
9 7 (1.59%) Data Structures
9 7 (1.59%) Distributed Systems
9 7 (1.59%) Equities
9 7 (1.59%) Fixed Income
9 7 (1.59%) Foreign Exchange (FX)
9 7 (1.59%) Learning Management System
10 6 (1.36%) Educational Technology
10 6 (1.36%) Mobile App
10 6 (1.36%) Public Cloud
Operating Systems
1 16 (3.64%) Unix
2 13 (2.95%) Android
2 13 (2.95%) Apple iOS
3 9 (2.05%) Linux
4 7 (1.59%) Windows
5 2 (0.45%) Windows Vista
Processes & Methodologies
1 219 (49.77%) User Experience
2 211 (47.95%) Agile
3 110 (25.00%) Project Management
4 103 (23.41%) Software Engineering
4 103 (23.41%) User-Centered Design (UCD)
5 102 (23.18%) UX Design
6 101 (22.95%) Mentoring
7 96 (21.82%) CI/CD
8 92 (20.91%) DevOps
8 92 (20.91%) Stakeholder Management
9 90 (20.45%) Front End Development
10 85 (19.32%) User Research
11 81 (18.41%) Usability Testing
12 78 (17.73%) Prototyping
13 76 (17.27%) Wireframes
14 73 (16.59%) Migration
14 73 (16.59%) Test Automation
15 72 (16.36%) Responsive Web Design
16 71 (16.14%) Performance Optimisation
16 71 (16.14%) SDLC
Programming Languages
1 122 (27.73%) JavaScript
2 111 (25.23%) SQL
3 82 (18.64%) TypeScript
4 73 (16.59%) Java
5 52 (11.82%) Python
6 22 (5.00%) C#
7 17 (3.86%) PHP
8 16 (3.64%) Go
9 12 (2.73%) PL/SQL
10 7 (1.59%) Elixir
10 7 (1.59%) Scala
11 6 (1.36%) Clojure
11 6 (1.36%) Rust
12 4 (0.91%) C
12 4 (0.91%) C++
12 4 (0.91%) Embedded C++
12 4 (0.91%) Kotlin
12 4 (0.91%) Shell Script
12 4 (0.91%) Swift
13 2 (0.45%) PowerShell
Qualifications
1 75 (17.05%) Degree
2 15 (3.41%) DBS Check
3 13 (2.95%) Master's Degree
4 11 (2.50%) Security Cleared
5 10 (2.27%) Computer Science Degree
6 9 (2.05%) SC Cleared
7 6 (1.36%) Microsoft Certification
8 4 (0.91%) OCA
8 4 (0.91%) OCP
8 4 (0.91%) Oracle Certification
9 3 (0.68%) BPSS Clearance
10 2 (0.45%) ISTQB
10 2 (0.45%) Tableau Certification
11 1 (0.23%) ACCA
11 1 (0.23%) Azure Certification
11 1 (0.23%) BC Cleared
11 1 (0.23%) Chartered Engineer
11 1 (0.23%) CIMA
11 1 (0.23%) DV Cleared
11 1 (0.23%) Numerate Degree
Quality Assurance & Compliance
1 66 (15.00%) QA
2 34 (7.73%) WCAG
3 22 (5.00%) Data Quality
4 5 (1.14%) GDPR
5 4 (0.91%) SLA
6 3 (0.68%) IFRS
7 2 (0.45%) Actionable Recommendations
7 2 (0.45%) California Consumer Privacy Act
7 2 (0.45%) GAAP
7 2 (0.45%) PCI DSS
7 2 (0.45%) Sarbanes-Oxley
8 1 (0.23%) PMO
System Software
1 60 (13.64%) Docker
2 8 (1.82%) HDFS
3 4 (0.91%) Firmware
Systems Management
1 89 (20.23%) Kubernetes
2 4 (0.91%) Oracle RMAN
3 3 (0.68%) Terraform
4 1 (0.23%) cPanel
Vendors
1 57 (12.95%) Solace
2 42 (9.55%) Microsoft
3 33 (7.50%) Adobe
4 28 (6.36%) Google
5 15 (3.41%) Oracle
5 15 (3.41%) Salesforce
6 11 (2.50%) Dell
7 8 (1.82%) NEC
7 8 (1.82%) Red Hat
7 8 (1.82%) SAP
8 5 (1.14%) Facebook
8 5 (1.14%) Instagram
8 5 (1.14%) YouTube
9 4 (0.91%) Cadence
9 4 (0.91%) Cisco
9 4 (0.91%) OpenLink
10 3 (0.68%) Apple
10 3 (0.68%) Mercator
10 3 (0.68%) TIBCO
10 3 (0.68%) Twitter