Performance Optimisation Jobs with Hybrid/Remote/WFH Options

Performance Optimisation
UK > Work from Home

The table below provides summary statistics for permanent remote or hybrid work requiring Performance Optimisation skills. It includes a benchmarking guide to the annual salaries offered in vacancies that cited Performance Optimisation over the 6 months leading up to 3 May 2025, comparing them to the same period in the previous two years.

6 months to
3 May 2025
Same period 2024 Same period 2023
Rank 197 411 566
Rank change year-on-year +214 +155 -23
Permanent jobs citing Performance Optimisation 255 178 111
As % of all permanent jobs with a WFH option 1.68% 0.53% 0.26%
As % of the Processes & Methodologies category 1.80% 0.57% 0.27%
Number of salaries quoted 136 141 73
10th Percentile £49,140 £45,000 £53,750
25th Percentile £53,000 £53,250 £56,250
Median annual salary (50th Percentile) £73,496 £62,500 £70,000
Median % change year-on-year +17.59% -10.71% +12.00%
75th Percentile £83,750 £85,000 £77,500
90th Percentile £91,250 £100,000 £83,750
UK median annual salary £69,315 £60,000 £70,000
% change year-on-year +15.53% -14.29% +12.90%

All Process and Methodology Skills
Work from Home

Performance Optimisation falls under the Processes and Methodologies category. For comparison with the information above, the following table provides summary statistics for all permanent job vacancies with remote or hybrid options requiring process or methodology skills.

Permanent vacancies with a requirement for process or methodology skills 14,134 30,993 40,912
As % of all permanent jobs with a WFH option 93.17% 91.62% 96.10%
Number of salaries quoted 9,780 23,560 28,419
10th Percentile £30,000 £33,750 £37,500
25th Percentile £45,000 £42,500 £47,500
Median annual salary (50th Percentile) £60,000 £57,500 £62,500
Median % change year-on-year +4.35% -8.00% +4.17%
75th Percentile £77,500 £75,000 £82,500
90th Percentile £102,500 £95,000 £100,000
UK median annual salary £57,500 £55,000 £61,500
% change year-on-year +4.55% -10.57% +2.50%

Performance Optimisation
Trend for Jobs with a WFH Option

Job vacancies with remote working options citing Performance Optimisation as a proportion of all IT jobs advertised.
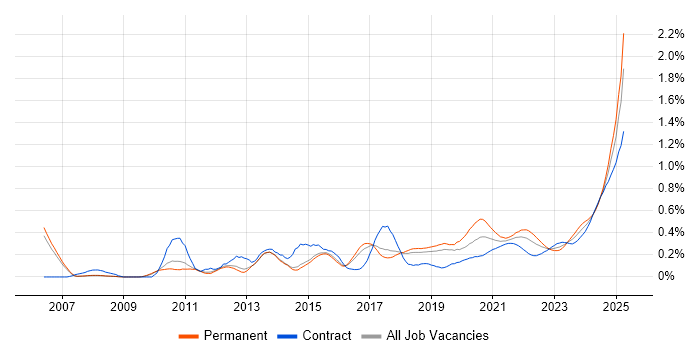
Performance Optimisation trend for jobs with Hybrid/Remote/WFH options

Performance Optimisation
Salary Trend for Jobs with a WFH Option

3-month moving average salary quoted in job vacancies with remote working options citing Performance Optimisation.

Performance Optimisation salary trend for jobs with a WFH option

Performance Optimisation
Salary Histogram for Jobs with a WFH Option

Salary distribution for jobs with remote working options citing Performance Optimisation over the 6 months to 3 May 2025.

Performance Optimisation salary histogram for jobs with a WFH option

Performance Optimisation
Co-occurring Skills and Capabilities with WFH Options by Category

The follow tables expand on the table above by listing co-occurrences grouped by category. The same employment type, locality and period is covered with up to 20 co-occurrences shown in each of the following categories:

Application Platforms
1 62 (24.31%) Confluence
2 8 (3.14%) WordPress
3 7 (2.75%) Apache Spark
4 2 (0.78%) Apache
5 1 (0.39%) CMS
5 1 (0.39%) Headless CMS
5 1 (0.39%) Microsoft Exchange
5 1 (0.39%) OpenEdge
5 1 (0.39%) SharePoint
5 1 (0.39%) Umbraco
Applications
1 8 (3.14%) Photoshop
2 2 (0.78%) Simulink
3 1 (0.39%) Adobe XD
3 1 (0.39%) Blender
3 1 (0.39%) Maya
3 1 (0.39%) Sketch
Business Applications
1 9 (3.53%) NetSuite
2 5 (1.96%) Dynamics CRM
3 1 (0.39%) Magento
3 1 (0.39%) SAP S/4HANA
Cloud Services
1 145 (56.86%) Azure
2 125 (49.02%) AWS
3 85 (33.33%) GCP
4 28 (10.98%) Azure DevOps
5 26 (10.20%) Azure Service Bus
6 24 (9.41%) Azure Cosmos DB
6 24 (9.41%) SonarCloud
7 16 (6.27%) GitHub
8 13 (5.10%) Power Platform
8 13 (5.10%) Serverless
9 12 (4.71%) SaaS
10 10 (3.92%) Google Analytics
11 9 (3.53%) Boomi
11 9 (3.53%) Snowflake
12 8 (3.14%) Canva
12 8 (3.14%) GitHub Actions
12 8 (3.14%) Google Ads
12 8 (3.14%) Microsoft Advertising
12 8 (3.14%) Stripe
13 7 (2.75%) Dynamics 365
Communications & Networking
1 5 (1.96%) BGP
1 5 (1.96%) DHCP
1 5 (1.96%) DNS
1 5 (1.96%) IPsec
1 5 (1.96%) MPLS
1 5 (1.96%) NAS
1 5 (1.96%) OSPF
1 5 (1.96%) SAN
1 5 (1.96%) VSAN
2 4 (1.57%) WAN
3 2 (0.78%) Cisco ISE
3 2 (0.78%) Firewall
3 2 (0.78%) MQTT
3 2 (0.78%) Network Security
3 2 (0.78%) SD-WAN
3 2 (0.78%) Software-Defined Networking
3 2 (0.78%) TACACS
3 2 (0.78%) VPN
4 1 (0.39%) Bluetooth
4 1 (0.39%) ZigBee
Database & Business Intelligence
1 113 (44.31%) SQL Server
2 26 (10.20%) MongoDB
3 24 (9.41%) Elasticsearch
4 19 (7.45%) Data Warehouse
5 14 (5.49%) PostgreSQL
5 14 (5.49%) Relational Database
6 13 (5.10%) NoSQL
7 11 (4.31%) Power BI
8 10 (3.92%) MySQL
9 9 (3.53%) SQL Server Integration Services
10 8 (3.14%) Data Lake
11 7 (2.75%) Amazon Redshift
11 7 (2.75%) BigQuery
11 7 (2.75%) Hadoop
12 5 (1.96%) Big Data
12 5 (1.96%) Tableau
13 4 (1.57%) Apache Hive
13 4 (1.57%) Azure SQL Data Warehouse
13 4 (1.57%) Enterprise Data Warehouse
13 4 (1.57%) Redis
Development Applications
1 92 (36.08%) JIRA
2 88 (34.51%) Maven
3 87 (34.12%) GitLab
4 82 (32.16%) Bitbucket
4 82 (32.16%) Cucumber
4 82 (32.16%) Selenium
4 82 (32.16%) SonarQube
4 82 (32.16%) Sonatype Nexus
5 60 (23.53%) Git
6 24 (9.41%) MSBuild
6 24 (9.41%) Octopus Deploy
6 24 (9.41%) Team Foundation Server
6 24 (9.41%) Visual Studio
7 9 (3.53%) Jenkins
8 6 (2.35%) Gradle
8 6 (2.35%) webpack
9 5 (1.96%) Oracle Forms
10 3 (1.18%) Babel
10 3 (1.18%) Vite
11 2 (0.78%) Ant
General
1 107 (41.96%) Finance
2 91 (35.69%) Banking
3 87 (34.12%) Inclusion and Diversity
4 70 (27.45%) Social Skills
5 54 (21.18%) Retail
6 27 (10.59%) Analytical Skills
7 21 (8.24%) Corporate Banking
7 21 (8.24%) Investment Banking
8 13 (5.10%) Marketing
9 11 (4.31%) Advertising
10 8 (3.14%) Police
11 7 (2.75%) Games
11 7 (2.75%) Organisational Skills
12 6 (2.35%) Law
13 5 (1.96%) Back Office
14 4 (1.57%) Public Sector
15 3 (1.18%) Agriculture
16 2 (0.78%) Front Office
17 1 (0.39%) French Language
17 1 (0.39%) Manufacturing
Job Titles
1 91 (35.69%) Software Engineer
2 62 (24.31%) Developer
3 39 (15.29%) Senior
4 34 (13.33%) Architect
5 29 (11.37%) Senior Developer
6 28 (10.98%) Technical Architect
7 15 (5.88%) Software Developer
8 14 (5.49%) Data Engineer
9 13 (5.10%) Cloud Engineer
9 13 (5.10%) Front-End Developer (Client-Side Developer)
10 12 (4.71%) Senior Software Developer
11 10 (3.92%) .NET Developer
12 9 (3.53%) Lead
12 9 (3.53%) NetSuite Developer
12 9 (3.53%) Technical Developer
12 9 (3.53%) Web Developer
13 7 (2.75%) Front-End Web Developer (Client-Side Web Developer)
13 7 (2.75%) Website Developer
14 6 (2.35%) DevOps Engineer
14 6 (2.35%) Senior .NET Developer
Libraries, Frameworks & Software Standards
1 147 (57.65%) CSS
2 145 (56.86%) HTML
3 105 (41.18%) React
4 93 (36.47%) Kafka
5 91 (35.69%) Spring
6 87 (34.12%) Redux
7 85 (33.33%) Spring Boot
8 82 (32.16%) JPA
9 61 (23.92%) Hibernate
10 52 (20.39%) .NET
11 49 (19.22%) REST
12 46 (18.04%) RESTful
13 37 (14.51%) XML
14 29 (11.37%) HTML5
15 28 (10.98%) CSS3
15 28 (10.98%) JSON
16 26 (10.20%) gRPC
17 25 (9.80%) ASP.NET
18 24 (9.41%) Bootstrap
19 22 (8.63%) Sass
Miscellaneous
1 87 (34.12%) Enterprise Software
2 83 (32.55%) Product Ownership
3 18 (7.06%) Virtual Team
4 17 (6.67%) Cloud Native
5 8 (3.14%) Social Media
6 7 (2.75%) Learning Management System
7 6 (2.35%) Legacy Systems
7 6 (2.35%) Mobile Games
8 5 (1.96%) Hybrid Cloud
8 5 (1.96%) Management Information System
8 5 (1.96%) Mobile App
9 4 (1.57%) Algorithms
9 4 (1.57%) Self-Motivation
10 3 (1.18%) Analytical Mindset
10 3 (1.18%) IoT
11 2 (0.78%) Blockchain
11 2 (0.78%) Client/Server
11 2 (0.78%) Greenfield Project
11 2 (0.78%) Legacy Applications
11 2 (0.78%) Video\Live Streaming
Operating Systems
1 13 (5.10%) Linux
2 9 (3.53%) Windows
3 5 (1.96%) Apple iOS
4 3 (1.18%) Android
5 2 (0.78%) Ubuntu
5 2 (0.78%) Unix
6 1 (0.39%) Debian
6 1 (0.39%) Windows Server
Processes & Methodologies
1 146 (57.25%) Agile
2 145 (56.86%) DevOps
3 125 (49.02%) Microservices
4 122 (47.84%) CI/CD
5 113 (44.31%) Front End Development
6 110 (43.14%) Software Engineering
7 99 (38.82%) Problem-Solving
8 96 (37.65%) Containerisation
8 96 (37.65%) Test Automation
9 95 (37.25%) Full-Stack Development
10 87 (34.12%) SDLC
11 78 (30.59%) Continuous Improvement
12 72 (28.24%) Clean Code
13 70 (27.45%) TDD
14 58 (22.75%) User Experience
15 50 (19.61%) Migration
16 47 (18.43%) Mentoring
17 41 (16.08%) Design Patterns
18 34 (13.33%) Data Modelling
18 34 (13.33%) Technical Leadership
Programming Languages
1 159 (62.35%) SQL
2 154 (60.39%) JavaScript
3 96 (37.65%) Java
4 55 (21.57%) C#
5 44 (17.25%) TypeScript
6 28 (10.98%) Python
7 11 (4.31%) PowerShell
7 11 (4.31%) T-SQL
8 9 (3.53%) PHP
9 6 (2.35%) C++
9 6 (2.35%) PL/SQL
10 3 (1.18%) Bash
10 3 (1.18%) Kotlin
11 2 (0.78%) MATLAB
11 2 (0.78%) Rust
11 2 (0.78%) Swift
12 1 (0.39%) Lisp
12 1 (0.39%) Objective-C
12 1 (0.39%) Scala
12 1 (0.39%) SPARQL
Qualifications
1 27 (10.59%) Degree
2 18 (7.06%) Computer Science Degree
3 12 (4.71%) Master's Degree
4 10 (3.92%) DBS Check
5 8 (3.14%) AWS Certification
6 7 (2.75%) Azure Certification
6 7 (2.75%) Microsoft Certification
7 6 (2.35%) AWS Certified Solutions Architect
8 5 (1.96%) VMware Certified Professional (VCP)
9 2 (0.78%) CCIE
9 2 (0.78%) CCNP
9 2 (0.78%) Cisco Certification
9 2 (0.78%) CISSP
9 2 (0.78%) PhD
10 1 (0.39%) SAP Certification
10 1 (0.39%) Security Cleared
Quality Assurance & Compliance
1 105 (41.18%) QA
2 38 (14.90%) Accessibility
3 24 (9.41%) GDPR
4 17 (6.67%) Data Quality
5 10 (3.92%) WCAG
6 4 (1.57%) ISO/IEC 27001
7 1 (0.39%) Actionable Recommendations
System Software
1 118 (46.27%) Docker
2 5 (1.96%) VMware NSX
3 4 (1.57%) HDFS
4 2 (0.78%) Active Directory
Systems Management
1 96 (37.65%) Kubernetes
2 15 (5.88%) Terraform
3 12 (4.71%) Prometheus
4 10 (3.92%) Single Sign-On
5 6 (2.35%) Argo
6 5 (1.96%) Grafana
6 5 (1.96%) Progress Chef
7 4 (1.57%) Ansible
8 1 (0.39%) Microsoft Intune
8 1 (0.39%) ZABBIX
Vendors
1 82 (32.16%) Solace
2 47 (18.43%) Microsoft
3 28 (10.98%) Google
4 10 (3.92%) Databricks
4 10 (3.92%) SAP
5 9 (3.53%) MuleSoft
5 9 (3.53%) Oracle
6 6 (2.35%) New Relic
7 5 (1.96%) VMware
8 4 (1.57%) Teradata
9 3 (1.18%) Cisco
9 3 (1.18%) Splunk
10 2 (0.78%) Informatica
10 2 (0.78%) ServiceNow
11 1 (0.39%) Adobe
11 1 (0.39%) HubSpot
11 1 (0.39%) OpenAI