Local Government Jobs

Local Government (Local Authority, Local Council)
UK

The table below looks at the prevalence of the term Local Government in permanent job vacancies. Included is a benchmarking guide to the salaries offered in vacancies that cited Local Government over the 6 months leading up to 12 May 2025, comparing them to the same period in the previous two years.

6 months to
12 May 2025
Same period 2024 Same period 2023
Rank 418 334 327
Rank change year-on-year -84 -7 +159
Permanent jobs citing Local Government 330 866 1,077
As % of all permanent jobs advertised in the UK 0.60% 0.87% 1.07%
As % of the General category 0.87% 1.46% 1.56%
Number of salaries quoted 155 617 428
10th Percentile £35,707 £26,250 £33,363
25th Percentile £41,250 £33,474 £40,071
Median annual salary (50th Percentile) £49,600 £40,000 £50,000
Median % change year-on-year +24.00% -20.00% +11.11%
75th Percentile £58,750 £53,376 £68,715
90th Percentile £73,833 £70,000 £75,981
UK excluding London median annual salary £43,460 £39,000 £44,800
% change year-on-year +11.43% -12.95% +6.48%

All General Skills
UK

Local Government falls under the General Skills category. For comparison with the information above, the following table provides summary statistics for all permanent job vacancies requiring common skills.

Permanent vacancies with a requirement for common skills 37,993 59,332 68,820
As % of all permanent jobs advertised in the UK 68.91% 59.79% 68.21%
Number of salaries quoted 18,640 39,684 37,197
10th Percentile £27,500 £27,500 £32,500
25th Percentile £40,000 £36,250 £43,162
Median annual salary (50th Percentile) £55,000 £52,500 £60,000
Median % change year-on-year +4.76% -12.50% -
75th Percentile £75,000 £72,500 £82,000
90th Percentile £100,000 £92,500 £102,000
UK excluding London median annual salary £50,000 £47,500 £52,500
% change year-on-year +5.26% -9.52% +5.00%

Local Government
Job Vacancy Trend

Job postings citing Local Government as a proportion of all IT jobs advertised.
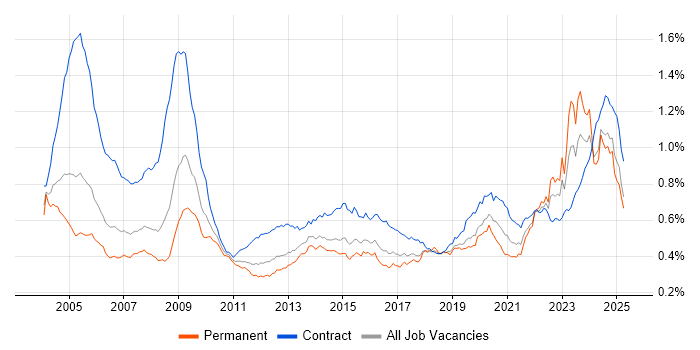
Job vacancy trend for Local Government in the UK

Local Government
Salary Trend

3-month moving average salary quoted in jobs citing Local Government.

Salary trend for Local Government in the UK

Local Government
Salary Histogram

Salary distribution for jobs citing Local Government over the 6 months to 12 May 2025.

Salary histogram for Local Government in the UK

Local Government
Top 16 Job Locations

The table below looks at the demand and provides a guide to the median salaries quoted in IT jobs citing Local Government within the UK over the 6 months to 12 May 2025. The 'Rank Change' column provides an indication of the change in demand within each location based on the same 6 month period last year.

Location Rank Change
on Same Period
Last Year
Matching
Permanent
IT Job Ads
Median Salary
Past 6 Months
Median Salary
% Change
on Same Period
Last Year
Live
Jobs
England -118 278 £47,500 +19.12% 437
UK excluding London -79 208 £43,460 +11.43% 293
Work from Home +29 127 £49,800 +4.84% 163
London +11 94 £52,500 +7.51% 171
South East +26 50 £49,800 +23.27% 64
Scotland +130 36 £50,000 +17.65% 12
Midlands -33 35 £53,750 +53.57% 62
East of England +23 33 £42,000 -7.99% 26
North of England -62 30 £44,600 +31.52% 96
South West +64 20 £42,500 +8.10% 25
West Midlands -32 18 £51,193 +46.29% 35
East Midlands +27 17 £56,625 +51.00% 25
North West -72 15 £55,043 +65.54% 63
Yorkshire +28 10 £44,500 +31.23% 28
Wales +4 4 - - 9
North East +30 3 - - 6

Local Government
Co-occurring Skills and Capabilities by Category

The follow tables expand on the table above by listing co-occurrences grouped by category. The same employment type, locality and period is covered with up to 20 co-occurrences shown in each of the following categories:

Application Platforms
1 16 (4.85%) IIS
1 16 (4.85%) SharePoint
2 6 (1.82%) Apache
2 6 (1.82%) Microsoft Exchange
3 4 (1.21%) OpenEdge
4 2 (0.61%) Oracle Workflow
5 1 (0.30%) CMS
5 1 (0.30%) Drupal
5 1 (0.30%) WordPress
Applications
1 25 (7.58%) Microsoft Excel
2 24 (7.27%) Microsoft Office
3 8 (2.42%) Chatbot
4 6 (1.82%) Spreadsheet
5 2 (0.61%) Oracle Smart View
6 1 (0.30%) Adobe Creative Suite
6 1 (0.30%) Microsoft PowerPoint
6 1 (0.30%) Microsoft Project
6 1 (0.30%) Trello
Business Applications
1 22 (6.67%) Academy Revenues and Benefits
2 4 (1.21%) NEC Housing
3 3 (0.91%) Oracle Payables
4 2 (0.61%) Dynamics CRM
4 2 (0.61%) Infor M3
4 2 (0.61%) Oracle Assets
4 2 (0.61%) Oracle Cash Management
4 2 (0.61%) Oracle ERP
4 2 (0.61%) Oracle Financials
4 2 (0.61%) Oracle General Ledger
4 2 (0.61%) Oracle Receivables
Cloud Services
1 35 (10.61%) Azure
2 34 (10.30%) Microsoft 365
3 23 (6.97%) SaaS
4 17 (5.15%) Power Platform
5 10 (3.03%) AWS
6 9 (2.73%) Power Automate
7 8 (2.42%) Google Workspace
8 6 (1.82%) Entra ID
9 5 (1.52%) Adobe Creative Cloud
10 3 (0.91%) Google Analytics
11 2 (0.61%) AWS CloudFormation
11 2 (0.61%) AWS CodeCommit
11 2 (0.61%) Azure API Management
11 2 (0.61%) Dynamics 365
11 2 (0.61%) GCP
11 2 (0.61%) GitHub
11 2 (0.61%) Google Tag Manager
11 2 (0.61%) Kong
11 2 (0.61%) OCI
11 2 (0.61%) PaaS
Communications & Networking
1 21 (6.36%) Firewall
1 21 (6.36%) WPA
2 10 (3.03%) DNS
2 10 (3.03%) Wi-Fi
3 9 (2.73%) SD-WAN
3 9 (2.73%) TCP/IP
3 9 (2.73%) WAN
4 8 (2.42%) VLAN
4 8 (2.42%) VPN
5 7 (2.12%) FTP
6 6 (1.82%) BGP
6 6 (1.82%) OSPF
6 6 (1.82%) VoIP
7 5 (1.52%) Internet
7 5 (1.52%) LAN
8 4 (1.21%) EIGRP
8 4 (1.21%) Intranet
8 4 (1.21%) Spanning Tree
8 4 (1.21%) Unified Communications
8 4 (1.21%) Wireshark
Database & Business Intelligence
1 23 (6.97%) SQL Server
2 16 (4.85%) Power BI
3 6 (1.82%) PostgreSQL
3 6 (1.82%) Relational Database
4 4 (1.21%) MySQL
5 3 (0.91%) GIS
5 3 (0.91%) Oracle Database
6 2 (0.61%) Big Data
6 2 (0.61%) Looker
6 2 (0.61%) Tableau
7 1 (0.30%) Azure SQL Database
7 1 (0.30%) Data Mining
7 1 (0.30%) Data Warehouse
7 1 (0.30%) SQL Server Integration Services
Development Applications
1 7 (2.12%) SQL Server Management Studio (SSMS)
2 4 (1.21%) Visual Studio
3 2 (0.61%) Checkstyle
3 2 (0.61%) Git
3 2 (0.61%) Jenkins
3 2 (0.61%) SonarQube
4 1 (0.30%) ERwin
4 1 (0.30%) JIRA
General
1 121 (36.67%) Social Skills
2 107 (32.42%) Public Sector
3 94 (28.48%) Finance
4 51 (15.45%) Analytical Skills
5 37 (11.21%) Marketing
6 18 (5.45%) Organisational Skills
7 16 (4.85%) Legal
8 15 (4.55%) Social Housing
9 12 (3.64%) Inclusion and Diversity
10 11 (3.33%) Police
11 10 (3.03%) Fire and Rescue
12 9 (2.73%) Retail
13 8 (2.42%) Influencing Skills
13 8 (2.42%) Law
14 6 (1.82%) Back Office
14 6 (1.82%) Presentation Skills
15 2 (0.61%) Electronics
15 2 (0.61%) Environmental Health
15 2 (0.61%) General Ledger
15 2 (0.61%) Telecoms
Job Titles
1 71 (21.52%) Senior
2 36 (10.91%) Analyst
2 36 (10.91%) Project Manager
3 33 (10.00%) Audit Manager
3 33 (10.00%) Senior Audit Manager
3 33 (10.00%) Senior Manager
4 25 (7.58%) Business Manager
5 23 (6.97%) Business Development Manager
5 23 (6.97%) Development Manager
6 22 (6.67%) Lead
7 17 (5.15%) Developer
8 14 (4.24%) Infrastructure Engineer
9 11 (3.33%) IT Analyst
9 11 (3.33%) Lecturer
10 10 (3.03%) Applications Support
10 10 (3.03%) Support Technician
11 9 (2.73%) Civil Engineer
11 9 (2.73%) Network Engineer
11 9 (2.73%) Principal Engineer
11 9 (2.73%) Support Analyst
Libraries, Frameworks & Software Standards
1 11 (3.33%) .NET
2 9 (2.73%) XML
3 6 (1.82%) Oracle Fusion
4 4 (1.21%) .NET Framework
4 4 (1.21%) Middleware
4 4 (1.21%) NHibernate
4 4 (1.21%) REST
5 3 (0.91%) Web Services
6 2 (0.61%) EDI
6 2 (0.61%) EJB
6 2 (0.61%) HTML
6 2 (0.61%) RESTful
6 2 (0.61%) SOAP
7 1 (0.30%) COM+
7 1 (0.30%) CSS
7 1 (0.30%) TAPI
Miscellaneous
1 33 (10.00%) Social Media
2 21 (6.36%) Management Information System
3 20 (6.06%) Self-Motivation
4 19 (5.76%) Onboarding
5 15 (4.55%) Data Centre
6 14 (4.24%) Housing Association
6 14 (4.24%) NHS
7 7 (2.12%) Client/Server
7 7 (2.12%) Robotics
8 6 (1.82%) Mobile App
9 5 (1.52%) Driving Licence
9 5 (1.52%) e-Learning
10 4 (1.21%) Blog
10 4 (1.21%) Renewable Energy
11 3 (0.91%) Legacy Systems
11 3 (0.91%) Product Ownership
12 2 (0.61%) Cloud Native
12 2 (0.61%) Greenfield Project
12 2 (0.61%) PKI
13 1 (0.30%) Media Streaming
Operating Systems
1 42 (12.73%) Windows
2 21 (6.36%) Windows Vista
3 10 (3.03%) Windows Server
4 7 (2.12%) Windows 10
5 3 (0.91%) Linux
6 2 (0.61%) Windows Server 2019
7 1 (0.30%) Mac OS
7 1 (0.30%) Solaris
7 1 (0.30%) Unix
Processes & Methodologies
1 67 (20.30%) Agile
2 64 (19.39%) Problem-Solving
3 62 (18.79%) Project Management
4 41 (12.42%) Continuous Improvement
4 41 (12.42%) ITIL
5 40 (12.12%) Coaching
6 37 (11.21%) Business Development
6 37 (11.21%) Project Delivery
7 34 (10.30%) CRM
8 31 (9.39%) Customer Service
9 30 (9.09%) Stakeholder Management
10 28 (8.48%) Business Strategy
10 28 (8.48%) Decision-Making
10 28 (8.48%) Mentoring
11 25 (7.58%) Cybersecurity
12 21 (6.36%) Business Forecasting
12 21 (6.36%) Change Management
12 21 (6.36%) Collaborative Working
13 20 (6.06%) Line Management
14 19 (5.76%) Roadmaps
Programming Languages
1 30 (9.09%) SQL
2 16 (4.85%) PowerShell
3 15 (4.55%) JavaScript
4 12 (3.64%) C#
5 10 (3.03%) Python
6 8 (2.42%) T-SQL
7 7 (2.12%) VB.NET
8 6 (1.82%) Java
9 4 (1.21%) Progress 4GL
9 4 (1.21%) TypeScript
10 3 (0.91%) Data Analysis Expressions
11 1 (0.30%) Bash
11 1 (0.30%) R
Qualifications
1 58 (17.58%) Degree
2 51 (15.45%) DBS Check
3 34 (10.30%) ACCA
4 15 (4.55%) Security Cleared
5 10 (3.03%) ITIL Foundation Certificate
6 8 (2.42%) Postgraduate
7 7 (2.12%) MRICS
8 6 (1.82%) CISM
8 6 (1.82%) CISSP
8 6 (1.82%) HNC
8 6 (1.82%) HND
8 6 (1.82%) MOS
8 6 (1.82%) SC Cleared
9 5 (1.52%) Cisco Certification
10 4 (1.21%) AAT
10 4 (1.21%) CEH
10 4 (1.21%) Computer Science Degree
10 4 (1.21%) CREST Certified
10 4 (1.21%) GIAC
11 3 (0.91%) TOGAF Certification
Quality Assurance & Compliance
1 33 (10.00%) GAAP
1 33 (10.00%) IFRS
2 20 (6.06%) ISO/IEC 27001
3 17 (5.15%) QA
4 10 (3.03%) Accessibility
4 10 (3.03%) Cyber Essentials
4 10 (3.03%) Data Quality
5 7 (2.12%) GDPR
6 6 (1.82%) NCSC
6 6 (1.82%) NIST
7 3 (0.91%) PCI DSS
8 1 (0.30%) ISO/IEC 20000
8 1 (0.30%) PMO
System Software
1 10 (3.03%) VMware Infrastructure
2 9 (2.73%) Active Directory
3 4 (1.21%) Virtual Desktop
4 2 (0.61%) vSphere
5 1 (0.30%) Docker
5 1 (0.30%) LXC
5 1 (0.30%) Samba
Systems Management
1 8 (2.42%) Microsoft Intune
2 5 (1.52%) ZABBIX
3 4 (1.21%) FortiGate
3 4 (1.21%) Nessus
3 4 (1.21%) Terraform
4 2 (0.61%) Kubernetes
4 2 (0.61%) SCCM
4 2 (0.61%) SmoothWall
5 1 (0.30%) EMC NetWorker
Vendors
1 78 (23.64%) Microsoft
2 15 (4.55%) Oracle
3 13 (3.94%) Google
4 12 (3.64%) Cisco
5 10 (3.03%) VMware
6 9 (2.73%) Salesforce
7 7 (2.12%) UiPath
8 6 (1.82%) Adobe
9 5 (1.52%) Palo Alto
9 5 (1.52%) SolarWinds
10 4 (1.21%) Fortinet
10 4 (1.21%) HP
10 4 (1.21%) NEC
10 4 (1.21%) Progress
10 4 (1.21%) Qualys
10 4 (1.21%) Tenable
11 3 (0.91%) Meraki
11 3 (0.91%) Zscaler
12 2 (0.61%) Databricks
12 2 (0.61%) Pure Storage