Business Strategy Jobs with Hybrid/Remote/WFH Options

Business Strategy
UK > Work from Home

The table below provides summary statistics for permanent remote or hybrid work requiring Business Strategy skills. It includes a benchmarking guide to the annual salaries offered in vacancies that cited Business Strategy over the 6 months leading up to 6 June 2025, comparing them to the same period in the previous two years.

6 months to
6 Jun 2025
Same period 2024 Same period 2023
Rank 220 171 180
Rank change year-on-year -49 +9 +41
Permanent jobs citing Business Strategy 291 672 776
As % of all permanent jobs with a WFH option 1.53% 1.92% 2.04%
As % of the Processes & Methodologies category 1.63% 2.13% 2.13%
Number of salaries quoted 189 365 347
10th Percentile £41,250 £40,000 £41,250
25th Percentile £57,500 £48,250 £51,833
Median annual salary (50th Percentile) £72,500 £58,800 £71,500
Median % change year-on-year +23.30% -17.76% +10.00%
75th Percentile £95,000 £83,750 £90,625
90th Percentile £128,000 £93,750 £120,000
UK median annual salary £65,000 £62,500 £70,000
% change year-on-year +4.00% -10.71% +7.69%

All Process and Methodology Skills
Work from Home

Business Strategy falls under the Processes and Methodologies category. For comparison with the information above, the following table provides summary statistics for all permanent job vacancies with remote or hybrid options requiring process or methodology skills.

Permanent vacancies with a requirement for process or methodology skills 17,902 31,480 36,498
As % of all permanent jobs with a WFH option 93.89% 90.02% 96.03%
Number of salaries quoted 9,476 23,576 25,856
10th Percentile £26,250 £33,750 £37,500
25th Percentile £41,250 £42,500 £47,500
Median annual salary (50th Percentile) £57,500 £57,500 £62,500
Median % change year-on-year - -8.00% +4.17%
75th Percentile £76,840 £75,000 £82,500
90th Percentile £100,000 £95,000 £100,000
UK median annual salary £56,000 £55,000 £60,800
% change year-on-year +1.82% -9.54% +1.33%

Business Strategy
Trend for Jobs with a WFH Option

Job vacancies with remote working options citing Business Strategy as a proportion of all IT jobs advertised.
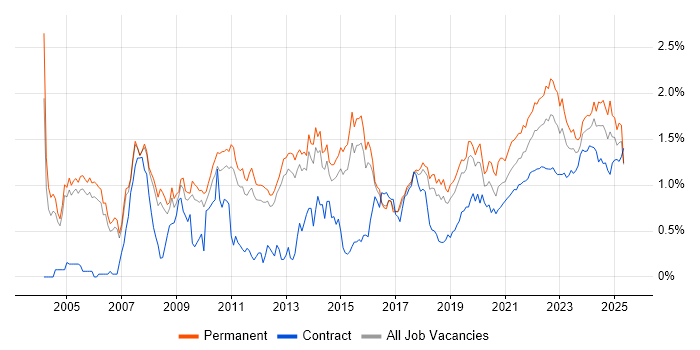
Business Strategy trend for jobs with Hybrid/Remote/WFH options

Business Strategy
Salary Trend for Jobs with a WFH Option

3-month moving average salary quoted in job vacancies with remote working options citing Business Strategy.

Business Strategy salary trend for jobs with a WFH option

Business Strategy
Salary Histogram for Jobs with a WFH Option

Salary distribution for jobs with remote working options citing Business Strategy over the 6 months to 6 June 2025.

Business Strategy salary histogram for jobs with a WFH option

Business Strategy
Co-occurring Skills and Capabilities with WFH Options by Category

The follow tables expand on the table above by listing co-occurrences grouped by category. The same employment type, locality and period is covered with up to 20 co-occurrences shown in each of the following categories:

Application Platforms
1 4 (1.37%) CMS
1 4 (1.37%) Confluence
2 3 (1.03%) Apache Spark
2 3 (1.03%) Microsoft Exchange
2 3 (1.03%) SharePoint
3 2 (0.69%) WordPress
4 1 (0.34%) Moodle
4 1 (0.34%) OpenEdge
4 1 (0.34%) OpenStack
4 1 (0.34%) Oracle Workflow
4 1 (0.34%) Solana
4 1 (0.34%) Totara
Applications
1 5 (1.72%) Microsoft Excel
2 3 (1.03%) Microsoft Office
2 3 (1.03%) Microsoft Project
3 2 (0.69%) Microsoft PowerPoint
4 1 (0.34%) Adobe Creative Suite
4 1 (0.34%) Adobe Illustrator
4 1 (0.34%) MS Visio
4 1 (0.34%) Photoshop
Business Applications
1 12 (4.12%) Academy Revenues and Benefits
2 4 (1.37%) SAP S/4HANA
3 3 (1.03%) Dynamics CRM
3 3 (1.03%) SAP FI
4 2 (0.69%) Aladdin
4 2 (0.69%) SAP CO
4 2 (0.69%) SAP FI/CO
5 1 (0.34%) Oracle EBS
5 1 (0.34%) Oracle EBS R12
5 1 (0.34%) Oracle Procure-to-Pay
5 1 (0.34%) Sage 200
5 1 (0.34%) SAP SCM
5 1 (0.34%) SAP SD
5 1 (0.34%) SAP WM
Cloud Services
1 36 (12.37%) Azure
2 20 (6.87%) Microsoft 365
3 17 (5.84%) SaaS
4 13 (4.47%) Power Platform
5 12 (4.12%) GitHub
6 11 (3.78%) Azure DevOps
7 9 (3.09%) AWS
8 6 (2.06%) Dynamics 365
8 6 (2.06%) Google Analytics
9 5 (1.72%) SuccessFactors
10 4 (1.37%) GCP
10 4 (1.37%) PaaS
10 4 (1.37%) Serverless
11 3 (1.03%) Amazon EC2
11 3 (1.03%) Amazon S3
11 3 (1.03%) Amazon SageMaker
11 3 (1.03%) AWS Lambda
11 3 (1.03%) Power Automate
12 2 (0.69%) Akamai
12 2 (0.69%) Entra ID
Communications & Networking
1 15 (5.15%) WAN
2 14 (4.81%) LAN
3 12 (4.12%) WPA
4 5 (1.72%) IP Telephony
4 5 (1.72%) Network Security
5 4 (1.37%) MPLS
5 4 (1.37%) VoIP
6 3 (1.03%) DNS
7 2 (0.69%) BGP
7 2 (0.69%) Broadband
7 2 (0.69%) HTTP
7 2 (0.69%) IOS XR
7 2 (0.69%) SSL
7 2 (0.69%) TCP/IP
7 2 (0.69%) Unified Communications
8 1 (0.34%) Firewall
8 1 (0.34%) VPN
8 1 (0.34%) WLAN
Database & Business Intelligence
1 21 (7.22%) Tableau
2 10 (3.44%) Power BI
3 9 (3.09%) SQL Server
4 7 (2.41%) Data Warehouse
5 5 (1.72%) Metadata
6 4 (1.37%) PostgreSQL
7 3 (1.03%) Amazon Athena
7 3 (1.03%) NoSQL
7 3 (1.03%) Parquet
7 3 (1.03%) Spark SQL
8 2 (0.69%) MongoDB
9 1 (0.34%) Big Data
9 1 (0.34%) DTS
9 1 (0.34%) MariaDB
9 1 (0.34%) MySQL
9 1 (0.34%) Oracle Database
9 1 (0.34%) Oracle Reports
9 1 (0.34%) PowerCenter
9 1 (0.34%) RDBMS
9 1 (0.34%) Relational Database
Development Applications
1 5 (1.72%) Git
1 5 (1.72%) JIRA
2 4 (1.37%) Bazaar
3 3 (1.03%) GitLab
4 2 (0.69%) SQL Server Management Studio (SSMS)
5 1 (0.34%) Oracle Forms
General
1 153 (52.58%) Social Skills
2 104 (35.74%) Finance
3 58 (19.93%) Analytical Skills
4 50 (17.18%) Inclusion and Diversity
5 36 (12.37%) Marketing
6 32 (11.00%) Public Sector
7 24 (8.25%) Legal
7 24 (8.25%) Presentation Skills
8 15 (5.15%) Local Government
8 15 (5.15%) Telecoms
9 12 (4.12%) Front Office
9 12 (4.12%) Influencing Skills
10 11 (3.78%) Law
10 11 (3.78%) Retail
11 9 (3.09%) Manufacturing
12 6 (2.06%) Games
13 5 (1.72%) Advertising
14 4 (1.37%) Automotive
14 4 (1.37%) Banking
14 4 (1.37%) Organisational Skills
Job Titles
1 56 (19.24%) Lead
2 48 (16.49%) Architect
3 32 (11.00%) Enterprise Architect
4 29 (9.97%) Business Manager
5 28 (9.62%) Analyst
6 24 (8.25%) Development Manager
7 22 (7.56%) Business Development Manager
8 18 (6.19%) Business Analyst
9 14 (4.81%) IT Manager
10 13 (4.47%) Technical Director
11 11 (3.78%) Product Lead
12 10 (3.44%) Solutions Architect
13 8 (2.75%) Developer
13 8 (2.75%) Development Specialist
13 8 (2.75%) Head of Development
13 8 (2.75%) Head of Software Development
13 8 (2.75%) Senior
14 7 (2.41%) Data Architect
14 7 (2.41%) Project Manager
14 7 (2.41%) Technical Manager
Libraries, Frameworks & Software Standards
1 9 (3.09%) .NET
2 8 (2.75%) React
3 7 (2.41%) RESTful
4 4 (1.37%) CSS
4 4 (1.37%) HTML
4 4 (1.37%) PySpark
4 4 (1.37%) REST
5 3 (1.03%) HTML5
5 3 (1.03%) Lightning Web Components
5 3 (1.03%) XGBoost
6 2 (0.69%) .NET Core
6 2 (0.69%) CSS3
6 2 (0.69%) GraphQL
6 2 (0.69%) Jinja
6 2 (0.69%) Node.js
6 2 (0.69%) YAML
6 2 (0.69%) YANG
7 1 (0.34%) Jest
7 1 (0.34%) Redux
7 1 (0.34%) web3js
Miscellaneous
1 21 (7.22%) Social Media
2 19 (6.53%) Product Ownership
3 18 (6.19%) Enterprise Software
4 17 (5.84%) Management Information System
5 15 (5.15%) Self-Motivation
6 14 (4.81%) Data Centre
6 14 (4.81%) Hybrid Cloud
7 13 (4.47%) Renewable Energy
8 12 (4.12%) Derivative
9 11 (3.78%) SCADA
10 10 (3.44%) Onboarding
11 6 (2.06%) Foreign Exchange (FX)
11 6 (2.06%) Mobile Games
11 6 (2.06%) Private Cloud
12 5 (1.72%) Algorithms
12 5 (1.72%) PMI
12 5 (1.72%) Tandem
12 5 (1.72%) Virtual Team
13 4 (1.37%) CCTV
13 4 (1.37%) Reinsurance
Operating Systems
1 19 (6.53%) Windows
2 17 (5.84%) Windows Vista
3 1 (0.34%) Android
3 1 (0.34%) Apple iOS
3 1 (0.34%) Windows Server
Processes & Methodologies
1 93 (31.96%) Roadmaps
2 53 (18.21%) Problem-Solving
2 53 (18.21%) Stakeholder Management
3 47 (16.15%) Analytics
3 47 (16.15%) Continuous Improvement
4 43 (14.78%) Agile
4 43 (14.78%) Project Management
5 37 (12.71%) Stakeholder Engagement
6 35 (12.03%) Business Development
6 35 (12.03%) Enterprise Architecture
7 34 (11.68%) Decision-Making
7 34 (11.68%) IT Strategy
8 31 (10.65%) Strategic Planning
8 31 (10.65%) Strategic Thinking
9 30 (10.31%) Mentoring
9 30 (10.31%) Project Delivery
9 30 (10.31%) Technology Strategy
10 29 (9.97%) Data Modelling
10 29 (9.97%) Strategic Roadmap
11 27 (9.28%) Data Architecture
Programming Languages
1 34 (11.68%) Python
2 22 (7.56%) SQL
3 20 (6.87%) C#
3 20 (6.87%) Java
4 10 (3.44%) JavaScript
5 5 (1.72%) PHP
6 3 (1.03%) Apex Code
7 1 (0.34%) PowerShell
7 1 (0.34%) R
7 1 (0.34%) TypeScript
Qualifications
1 62 (21.31%) Degree
2 27 (9.28%) DBS Check
3 14 (4.81%) Security Cleared
4 10 (3.44%) Chartered Engineer
5 9 (3.09%) Master's Degree
6 6 (2.06%) SC Cleared
6 6 (2.06%) Six Sigma Black Belt
6 6 (2.06%) TOGAF Certification
7 5 (1.72%) PMI Certification
8 4 (1.37%) GISP
8 4 (1.37%) PMP
9 3 (1.03%) Computer Science Degree
9 3 (1.03%) CSPO
10 2 (0.69%) Azure Certification
10 2 (0.69%) HNC
10 2 (0.69%) HND
10 2 (0.69%) ITIL Foundation Certificate
10 2 (0.69%) Microsoft Certification
11 1 (0.34%) MCSE
11 1 (0.34%) PRINCE2 Certification
Quality Assurance & Compliance
1 14 (4.81%) SLA
2 6 (2.06%) GDPR
3 5 (1.72%) Accessibility
3 5 (1.72%) QA
4 4 (1.37%) Sarbanes-Oxley
5 3 (1.03%) IEC 61508
5 3 (1.03%) ISO/IEC 27001
5 3 (1.03%) PMO
6 2 (0.69%) Data Quality
6 2 (0.69%) NCSC
7 1 (0.34%) Actionable Recommendations
7 1 (0.34%) Cyber Essentials
7 1 (0.34%) Cyber Essentials PLUS
7 1 (0.34%) ISO 14001
7 1 (0.34%) ISO 22301
7 1 (0.34%) ISO 9001
7 1 (0.34%) NIST
System Software
1 2 (0.69%) Active Directory
1 2 (0.69%) Docker
2 1 (0.34%) Virtual Desktop
2 1 (0.34%) Virtual Machines
Systems Management
1 15 (5.15%) Ansible
2 13 (4.47%) Terraform
3 8 (2.75%) Kubernetes
4 4 (1.37%) Cisco CUCM
5 3 (1.03%) Functional Safety
5 3 (1.03%) Jamf Pro
5 3 (1.03%) SCCM
Vendors
1 24 (8.25%) Microsoft
2 20 (6.87%) Cisco
3 16 (5.50%) SAP
4 14 (4.81%) Databricks
4 14 (4.81%) Fortinet
5 13 (4.47%) Aruba
5 13 (4.47%) Mellanox
5 13 (4.47%) NVIDIA
5 13 (4.47%) Palo Alto
6 11 (3.78%) Facebook
6 11 (3.78%) YouTube
7 10 (3.44%) Google
8 8 (2.75%) Salesforce
9 6 (2.06%) HubSpot
10 5 (1.72%) Oracle
10 5 (1.72%) ServiceNow
11 4 (1.37%) Avaloq
12 3 (1.03%) BT
13 2 (0.69%) Nokia
14 1 (0.34%) Apple