Data Lake Jobs

Data Lakes
UK

The table below provides summary statistics for permanent job vacancies requiring Data Lake skills. It includes a benchmarking guide to the annual salaries offered in vacancies that cited Data Lake over the 6 months leading up to 30 May 2025, comparing them to the same period in the previous two years.

6 months to
30 May 2025
Same period 2024 Same period 2023
Rank 286 264 240
Rank change year-on-year -22 -24 +55
Permanent jobs citing Data Lake 601 1,110 1,496
As % of all permanent jobs advertised in the UK 1.08% 1.07% 1.54%
As % of the Database & Business Intelligence category 7.85% 6.04% 7.16%
Number of salaries quoted 364 851 1,011
10th Percentile £46,750 £42,500 £50,000
25th Percentile £61,000 £60,125 £58,750
Median annual salary (50th Percentile) £85,000 £87,500 £80,000
Median % change year-on-year -2.86% +9.38% +14.29%
75th Percentile £122,500 £122,500 £100,000
90th Percentile £148,575 £148,750 £130,000
UK excluding London median annual salary £63,750 £60,000 £60,000
% change year-on-year +6.25% - -

All Database and Business Intelligence Skills
UK

Data Lake falls under the Databases and Business Intelligence category. For comparison with the information above, the following table provides summary statistics for all permanent job vacancies requiring database or business intelligence skills.

Permanent vacancies with a requirement for database or business intelligence skills 7,654 18,365 20,897
As % of all permanent jobs advertised in the UK 13.81% 17.78% 21.51%
Number of salaries quoted 4,812 12,527 13,034
10th Percentile £36,250 £35,000 £37,500
25th Percentile £47,500 £42,725 £47,500
Median annual salary (50th Percentile) £60,394 £57,500 £65,000
Median % change year-on-year +5.03% -11.54% +8.33%
75th Percentile £82,751 £77,500 £82,500
90th Percentile £112,500 £97,500 £103,750
UK excluding London median annual salary £55,000 £52,500 £55,000
% change year-on-year +4.76% -4.55% +4.76%

Data Lake
Job Vacancy Trend

Job postings citing Data Lake as a proportion of all IT jobs advertised.
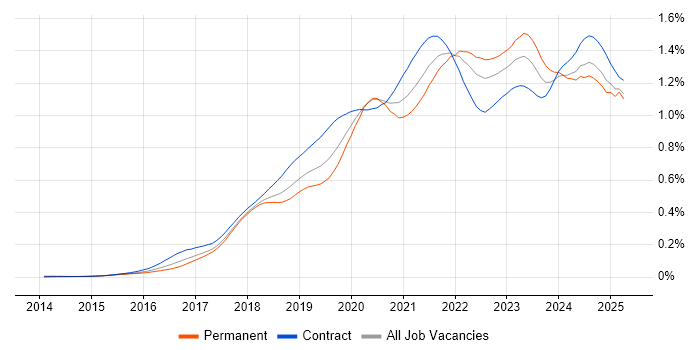
Job vacancy trend for Data Lake in the UK

Data Lake
Salary Trend

3-month moving average salary quoted in jobs citing Data Lake.

Salary trend for Data Lake in the UK

Data Lake
Salary Histogram

Salary distribution for jobs citing Data Lake over the 6 months to 30 May 2025.

Salary histogram for Data Lake in the UK

Data Lake
Top 16 Job Locations

The table below looks at the demand and provides a guide to the median salaries quoted in IT jobs citing Data Lake within the UK over the 6 months to 30 May 2025. The 'Rank Change' column provides an indication of the change in demand within each location based on the same 6 month period last year.

Location Rank Change
on Same Period
Last Year
Matching
Permanent
IT Job Ads
Median Salary
Past 6 Months
Median Salary
% Change
on Same Period
Last Year
Live
Jobs
England -26 575 £85,000 -5.56% 1,149
London -11 312 £110,000 -4.35% 182
Work from Home -76 266 £110,000 - 482
UK excluding London +43 264 £63,750 +6.25% 1,131
South East +112 128 £65,000 +2.36% 333
North of England -14 55 £70,000 +27.27% 255
Midlands +55 44 £52,500 -8.70% 201
Yorkshire +48 25 £71,991 +10.76% 101
East Midlands +45 25 £48,500 +2.11% 83
North West -42 20 £67,500 +50.00% 121
West Midlands +28 19 £62,500 +8.70% 104
South West +67 15 £70,000 -0.82% 125
East of England +44 12 £70,000 +21.74% 154
North East +41 10 £63,750 -15.00% 34
Scotland +44 7 £85,000 +27.82% 64
Wales +42 3 £80,000 +73.42% 28

Data Lake
Co-occurring Skills and Capabilities by Category

The follow tables expand on the table above by listing co-occurrences grouped by category. The same employment type, locality and period is covered with up to 20 co-occurrences shown in each of the following categories:

Application Platforms
1 72 (11.98%) Apache
2 68 (11.31%) Apache Airflow
3 49 (8.15%) Apache Spark
4 31 (5.16%) SharePoint
5 5 (0.83%) Confluence
6 3 (0.50%) Jupyter
7 2 (0.33%) Oracle Workflow
8 1 (0.17%) SAS
Applications
1 16 (2.66%) Microsoft Excel
2 14 (2.33%) Maya
3 11 (1.83%) Microsoft Office
4 5 (0.83%) Microsoft PowerPoint
5 4 (0.67%) Microsoft Project
6 1 (0.17%) MS Visio
Business Applications
1 14 (2.33%) Dynamics CRM
2 6 (1.00%) Infor M3
3 3 (0.50%) Markit EDM
3 3 (0.50%) SAP CX
4 2 (0.33%) Payment Gateway
5 1 (0.17%) Lorenzo
5 1 (0.17%) Oracle ERP
5 1 (0.17%) Sparx Enterprise Architect
5 1 (0.17%) SystmOne
Cloud Services
1 333 (55.41%) Azure
2 221 (36.77%) AWS
3 166 (27.62%) Power Platform
4 111 (18.47%) GCP
4 111 (18.47%) Snowflake
5 76 (12.65%) Azure Data Factory
6 65 (10.82%) Azure Synapse Analytics
7 63 (10.48%) dbt
8 51 (8.49%) Power Automate
9 44 (7.32%) Amazon S3
10 37 (6.16%) Serverless
11 34 (5.66%) Azure DevOps
11 34 (5.66%) PowerApps
12 29 (4.83%) SaaS
13 22 (3.66%) Amazon EC2
13 22 (3.66%) PaaS
14 19 (3.16%) AWS Lambda
15 18 (3.00%) Dynamics 365
15 18 (3.00%) Entra ID
15 18 (3.00%) IaaS
Communications & Networking
1 18 (3.00%) Firewall
1 18 (3.00%) VPN
2 16 (2.66%) DNS
2 16 (2.66%) SD-WAN
2 16 (2.66%) WAN
3 4 (0.67%) SAN
4 2 (0.33%) Internet
4 2 (0.33%) Network Security
Database & Business Intelligence
1 191 (31.78%) Data Warehouse
2 161 (26.79%) Power BI
3 77 (12.81%) Big Data
4 66 (10.98%) Amazon Athena
5 59 (9.82%) Metadata
6 58 (9.65%) Dremio
7 57 (9.48%) Tableau
8 55 (9.15%) Apache Iceberg
9 54 (8.99%) Apache Ignite
10 51 (8.49%) Apache Arrow
11 49 (8.15%) SQL Server
12 48 (7.99%) Azure SQL Database
13 35 (5.82%) Hadoop
14 33 (5.49%) NoSQL
15 32 (5.32%) Amazon Redshift
16 27 (4.49%) Azure SQL Data Warehouse
17 21 (3.49%) BigQuery
17 21 (3.49%) SQL Server Reporting Services
18 19 (3.16%) Relational Database
19 16 (2.66%) MySQL
Development Applications
1 41 (6.82%) Git
2 12 (2.00%) JIRA
3 8 (1.33%) CircleCI
4 7 (1.16%) Jenkins
5 5 (0.83%) MLflow
6 4 (0.67%) Subversion
7 3 (0.50%) ER Studio
7 3 (0.50%) GitLab
7 3 (0.50%) Visual Studio
8 2 (0.33%) ERwin
9 1 (0.17%) Bitbucket
9 1 (0.17%) kappa
9 1 (0.17%) Octopus Deploy
9 1 (0.17%) SpecFlow
General
1 267 (44.43%) Finance
2 159 (26.46%) Social Skills
3 144 (23.96%) Law
4 141 (23.46%) Front Office
5 130 (21.63%) Analytical Skills
6 98 (16.31%) Banking
7 51 (8.49%) Investment Banking
8 46 (7.65%) Influencing Skills
9 36 (5.99%) Inclusion and Diversity
10 33 (5.49%) Retail
11 22 (3.66%) Financial Institution
12 21 (3.49%) Retail Banking
13 18 (3.00%) Marketing
14 15 (2.50%) Presentation Skills
15 12 (2.00%) Games
16 10 (1.66%) Advertising
16 10 (1.66%) Public Sector
17 9 (1.50%) Manufacturing
18 7 (1.16%) Legal
19 3 (0.50%) Back Office
Job Titles
1 163 (27.12%) Senior
2 125 (20.80%) Lead
3 119 (19.80%) Data Engineer
4 98 (16.31%) Architect
5 62 (10.32%) AWS Engineer
5 62 (10.32%) Software Engineer
6 53 (8.82%) AWS Software Engineer
7 51 (8.49%) Java Engineer
7 51 (8.49%) Java Software Engineer
8 49 (8.15%) Senior Software Engineer
9 46 (7.65%) Python Engineer
9 46 (7.65%) Senior Java Engineer
9 46 (7.65%) Senior Java Software Engineer
10 43 (7.15%) Data Architect
11 41 (6.82%) Senior Data Engineer
12 40 (6.66%) Python Software Engineer
13 36 (5.99%) Developer
14 30 (4.99%) Head of Finance
15 29 (4.83%) Azure Engineer
16 27 (4.49%) Cloud Architect
Libraries, Frameworks & Software Standards
1 56 (9.32%) Pandas
2 52 (8.65%) NumPy
2 52 (8.65%) SciPy
3 51 (8.49%) gRPC
3 51 (8.49%) Protocol Buffers
4 48 (7.99%) PySpark
5 31 (5.16%) Kafka
6 11 (1.83%) REST
7 7 (1.16%) RESTful
7 7 (1.16%) Spring
8 6 (1.00%) .NET
8 6 (1.00%) JSON
9 5 (0.83%) EDI
9 5 (0.83%) OAuth
9 5 (0.83%) Spark Streaming
10 4 (0.67%) ActiveMQ
10 4 (0.67%) AWS CDK
10 4 (0.67%) pytest
11 3 (0.50%) CSS
11 3 (0.50%) J2EE
Miscellaneous
1 136 (22.63%) Equities
1 136 (22.63%) Hedge funds
2 133 (22.13%) Derivative
2 133 (22.13%) Fixed Income
2 133 (22.13%) Foreign Exchange (FX)
3 43 (7.15%) Analytical Mindset
4 42 (6.99%) Product Ownership
5 40 (6.66%) Pricing Data
6 35 (5.82%) Cloud Native
7 30 (4.99%) Management Information System
8 23 (3.83%) Data Structures
9 18 (3.00%) Enterprise Software
10 17 (2.83%) NHS
11 16 (2.66%) Data Centre
12 10 (1.66%) Algorithms
13 7 (1.16%) Reinsurance
14 6 (1.00%) Greenfield Project
14 6 (1.00%) Reference Data
15 5 (0.83%) Distributed Applications
15 5 (0.83%) Legacy Systems
Operating Systems
1 1 (0.17%) Linux
Processes & Methodologies
1 287 (47.75%) Agile
2 268 (44.59%) Analytics
3 200 (33.28%) Data Governance
4 191 (31.78%) Data Management
5 189 (31.45%) Business Intelligence
5 189 (31.45%) Roadmaps
6 170 (28.29%) ETL
6 170 (28.29%) Migration
7 165 (27.45%) Data Modelling
8 157 (26.12%) Data Engineering
9 123 (20.47%) Investment Management
10 120 (19.97%) Data Science
11 118 (19.63%) Data Architecture
12 109 (18.14%) Data Pipeline
13 108 (17.97%) Asset Management
14 102 (16.97%) CI/CD
15 99 (16.47%) Problem-Solving
16 97 (16.14%) DevOps
17 96 (15.97%) Data Strategy
17 96 (15.97%) Regulatory Compliance
Programming Languages
1 251 (41.76%) SQL
2 218 (36.27%) Python
3 91 (15.14%) Java
4 60 (9.98%) JavaScript
5 53 (8.82%) TypeScript
6 32 (5.32%) T-SQL
7 27 (4.49%) PowerShell
8 23 (3.83%) Data Analysis Expressions
9 22 (3.66%) R
10 20 (3.33%) Scala
11 18 (3.00%) Bicep
12 9 (1.50%) PL/SQL
13 7 (1.16%) C#
14 4 (0.67%) Julia
14 4 (0.67%) VB.NET
14 4 (0.67%) VBA
15 3 (0.50%) Bash
16 2 (0.33%) Ruby
17 1 (0.17%) Erlang
17 1 (0.17%) Haskell
Qualifications
1 132 (21.96%) Degree
2 72 (11.98%) Azure Certification
3 40 (6.66%) Computer Science Degree
4 38 (6.32%) AWS Certification
5 28 (4.66%) Master's Degree
6 18 (3.00%) DBS Check
7 13 (2.16%) Security Cleared
8 11 (1.83%) SC Cleared
9 5 (0.83%) PMI Certification
9 5 (0.83%) PMP
10 4 (0.67%) SAP Certification
11 3 (0.50%) AWS Certified Solutions Architect
11 3 (0.50%) DV Cleared
11 3 (0.50%) Microsoft Certification
11 3 (0.50%) SnowPro
12 2 (0.33%) ITIL Certification
12 2 (0.33%) Tableau Certification
12 2 (0.33%) TOGAF Certification
13 1 (0.17%) CBAP
13 1 (0.17%) MBA
Quality Assurance & Compliance
1 107 (17.80%) Data Quality
2 39 (6.49%) QA
3 37 (6.16%) MiFID
4 34 (5.66%) Accessibility
5 19 (3.16%) GDPR
6 10 (1.66%) California Consumer Privacy Act
7 6 (1.00%) GxP
8 5 (0.83%) ISO/IEC 27001
8 5 (0.83%) SOC 2
9 3 (0.50%) SEPA
10 2 (0.33%) NIST
10 2 (0.33%) PCI DSS
10 2 (0.33%) SLA
10 2 (0.33%) Solvency II
11 1 (0.17%) Cyber Essentials
11 1 (0.17%) Cyber Essentials PLUS
11 1 (0.17%) DICOM
11 1 (0.17%) HL7
11 1 (0.17%) SNOMED CT
System Software
1 20 (3.33%) Docker
2 18 (3.00%) Virtual Machines
3 7 (1.16%) HDFS
4 5 (0.83%) Apache Flume
5 3 (0.50%) Active Directory
6 1 (0.17%) Virtual Desktop
Systems Management
1 25 (4.16%) Terraform
2 16 (2.66%) Single Sign-On
3 11 (1.83%) Kubernetes
4 5 (0.83%) Oozie
5 3 (0.50%) Ansible
5 3 (0.50%) Grafana
5 3 (0.50%) Microsoft Intune
5 3 (0.50%) Progress Chef
5 3 (0.50%) SCCM
6 2 (0.33%) Hadoop YARN
Vendors
1 169 (28.12%) Microsoft
2 131 (21.80%) Databricks
3 39 (6.49%) SAP
4 38 (6.32%) Google
5 26 (4.33%) ServiceNow
6 23 (3.83%) Oracle
6 23 (3.83%) Salesforce
7 16 (2.66%) Meraki
8 13 (2.16%) Dell
9 11 (1.83%) Adobe
9 11 (1.83%) MuleSoft
10 10 (1.66%) Cloudera
11 9 (1.50%) Teradata
12 6 (1.00%) Infor
12 6 (1.00%) Informatica
13 5 (0.83%) Bloomberg
14 4 (0.67%) IBM
14 4 (0.67%) Nimble Storage
15 3 (0.50%) Blue Prism
15 3 (0.50%) Snowplow