Infrastructure as Code Jobs with Hybrid/Remote/WFH Options

Infrastructure as Code (IaC, Infra as Code)
UK > Work from Home

The table below provides summary statistics for permanent remote or hybrid work requiring Infrastructure as Code skills. It includes a benchmarking guide to the annual salaries offered in vacancies that cited Infrastructure as Code over the 6 months leading up to 2 May 2025, comparing them to the same period in the previous two years.

6 months to
2 May 2025
Same period 2024 Same period 2023
Rank 137 137 84
Rank change year-on-year 0 -53 +4
Permanent jobs citing Infrastructure as Code 352 784 1,663
As % of all permanent jobs with a WFH option 2.35% 2.32% 3.89%
As % of the Processes & Methodologies category 2.53% 2.53% 4.05%
Number of salaries quoted 260 674 1,163
10th Percentile £47,450 £50,000 £48,150
25th Percentile £60,000 £57,500 £57,500
Median annual salary (50th Percentile) £75,000 £70,576 £75,000
Median % change year-on-year +6.27% -5.90% +7.14%
75th Percentile £90,000 £90,000 £93,750
90th Percentile £100,000 £110,000 £105,000
UK median annual salary £77,500 £70,576 £75,000
% change year-on-year +9.81% -5.90% +7.14%

All Process and Methodology Skills
Work from Home

Infrastructure as Code falls under the Processes and Methodologies category. For comparison with the information above, the following table provides summary statistics for all permanent job vacancies with remote or hybrid options requiring process or methodology skills.

Permanent vacancies with a requirement for process or methodology skills 13,938 31,020 41,026
As % of all permanent jobs with a WFH option 93.13% 91.65% 96.09%
Number of salaries quoted 9,733 23,575 28,496
10th Percentile £30,000 £33,800 £37,500
25th Percentile £45,000 £42,500 £47,500
Median annual salary (50th Percentile) £60,000 £57,500 £62,500
Median % change year-on-year +4.35% -8.00% +4.17%
75th Percentile £77,500 £75,000 £82,500
90th Percentile £102,500 £95,000 £100,000
UK median annual salary £57,500 £55,000 £61,500
% change year-on-year +4.55% -10.57% +2.50%

Infrastructure as Code
Trend for Jobs with a WFH Option

Job vacancies with remote working options citing Infrastructure as Code as a proportion of all IT jobs advertised.
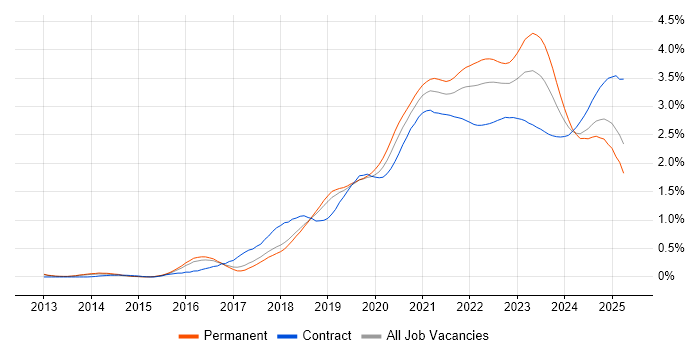
Infrastructure as Code trend for jobs with Hybrid/Remote/WFH options

Infrastructure as Code
Salary Trend for Jobs with a WFH Option

3-month moving average salary quoted in job vacancies with remote working options citing Infrastructure as Code.

Infrastructure as Code salary trend for jobs with a WFH option

Infrastructure as Code
Salary Histogram for Jobs with a WFH Option

Salary distribution for jobs with remote working options citing Infrastructure as Code over the 6 months to 2 May 2025.

Infrastructure as Code salary histogram for jobs with a WFH option

Infrastructure as Code
Co-occurring Skills and Capabilities with WFH Options by Category

The follow tables expand on the table above by listing co-occurrences grouped by category. The same employment type, locality and period is covered with up to 20 co-occurrences shown in each of the following categories:

Application Platforms
1 10 (2.84%) Apache Airflow
2 5 (1.42%) Apache
2 5 (1.42%) NetWeaver
2 5 (1.42%) Tomcat
3 4 (1.14%) IBM Domino
4 3 (0.85%) SharePoint
5 2 (0.57%) Apache Spark
5 2 (0.57%) Jupyter
6 1 (0.28%) Apache Solr
6 1 (0.28%) CMS
6 1 (0.28%) Confluence
6 1 (0.28%) Headless CMS
6 1 (0.28%) Microsoft Exchange
6 1 (0.28%) nginx
6 1 (0.28%) OpenStack
Applications
1 2 (0.57%) Microsoft Excel
1 2 (0.57%) Microsoft PowerPoint
1 2 (0.57%) Simulink
Business Applications
1 5 (1.42%) Oracle Subledger Accounting
2 2 (0.57%) Oracle EBS
2 2 (0.57%) Oracle ERP
2 2 (0.57%) PeopleSoft HCM
Cloud Services
1 194 (55.11%) AWS
2 171 (48.58%) Azure
3 89 (25.28%) GCP
4 77 (21.88%) Serverless
5 57 (16.19%) AWS Lambda
6 45 (12.78%) SaaS
7 44 (12.50%) AWS CloudFormation
8 40 (11.36%) PaaS
9 38 (10.80%) Amazon S3
9 38 (10.80%) Azure DevOps
10 37 (10.51%) GitHub
11 33 (9.38%) Amazon EC2
12 28 (7.95%) Amazon EKS
13 22 (6.25%) Amazon CloudWatch
14 20 (5.68%) Azure AKS
14 20 (5.68%) Datadog
14 20 (5.68%) IaaS
15 14 (3.98%) Apigee
15 14 (3.98%) Google Kubernetes Engine
16 13 (3.69%) AWS KMS
Communications & Networking
1 19 (5.40%) Firewall
2 16 (4.55%) Network Security
3 15 (4.26%) WAN
4 14 (3.98%) VPN
5 7 (1.99%) DNS
5 7 (1.99%) LAN
6 6 (1.70%) SD-WAN
7 5 (1.42%) IPsec
8 4 (1.14%) IPv4
8 4 (1.14%) Wireless
9 2 (0.57%) DHCP
9 2 (0.57%) Internet
9 2 (0.57%) MQTT
9 2 (0.57%) OSPF
9 2 (0.57%) VLAN
10 1 (0.28%) HTTPS
10 1 (0.28%) OpenVPN
10 1 (0.28%) SAN
10 1 (0.28%) SSH
10 1 (0.28%) TCP/IP
Database & Business Intelligence
1 26 (7.39%) NoSQL
2 18 (5.11%) DynamoDB
3 15 (4.26%) SQL Server
4 13 (3.69%) Amazon RDS
5 11 (3.13%) MySQL
6 10 (2.84%) Amazon Redshift
7 9 (2.56%) PostgreSQL
8 8 (2.27%) Amazon Aurora
9 7 (1.99%) MongoDB
9 7 (1.99%) Power BI
10 6 (1.70%) Azure SQL Database
10 6 (1.70%) BigQuery
10 6 (1.70%) Data Lake
10 6 (1.70%) Relational Database
11 5 (1.42%) Big Data
11 5 (1.42%) BusinessObjects
11 5 (1.42%) SAP BW
11 5 (1.42%) SAP Data Services
11 5 (1.42%) SAP HANA
12 4 (1.14%) Data Warehouse
Development Applications
1 86 (24.43%) Jenkins
2 78 (22.16%) Git
3 44 (12.50%) GitLab
4 30 (8.52%) Maven
5 29 (8.24%) SonarQube
6 28 (7.95%) JUnit
7 26 (7.39%) Sonatype Nexus
8 19 (5.40%) Cucumber
9 14 (3.98%) IntelliJ
9 14 (3.98%) Mockito
10 7 (1.99%) JIRA
10 7 (1.99%) TeamCity
11 5 (1.42%) Oracle Forms
12 3 (0.85%) Artifactory
12 3 (0.85%) Bitbucket
12 3 (0.85%) MLflow
13 2 (0.57%) Checkstyle
13 2 (0.57%) Storybook
13 2 (0.57%) Subversion
14 1 (0.28%) NUnit
General
1 109 (30.97%) Finance
2 76 (21.59%) Social Skills
3 53 (15.06%) Banking
4 27 (7.67%) Telecoms
5 22 (6.25%) Law
6 20 (5.68%) Inclusion and Diversity
7 19 (5.40%) Public Sector
8 10 (2.84%) Advertising
8 10 (2.84%) Legal
9 8 (2.27%) Local Government
10 6 (1.70%) Analytical Skills
10 6 (1.70%) Marketing
10 6 (1.70%) Retail
11 5 (1.42%) Games
11 5 (1.42%) General Ledger
12 4 (1.14%) Electronics
12 4 (1.14%) Manufacturing
13 3 (0.85%) Back Office
13 3 (0.85%) Military
14 2 (0.57%) Automotive
Job Titles
1 100 (28.41%) Senior
2 71 (20.17%) Cloud Engineer
3 61 (17.33%) DevOps Engineer
4 46 (13.07%) Lead
5 45 (12.78%) Software Engineer
6 42 (11.93%) Architect
7 36 (10.23%) Azure Engineer
8 34 (9.66%) Platform Engineer
9 32 (9.09%) AWS DevOps
10 30 (8.52%) Infrastructure Engineer
11 29 (8.24%) AWS Engineer
11 29 (8.24%) Cloud Architect
11 29 (8.24%) Senior Cloud Engineer
12 26 (7.39%) Developer
12 26 (7.39%) Senior DevOps
13 25 (7.10%) Security Engineer
14 22 (6.25%) Python Engineer
15 21 (5.97%) AWS Architect
16 19 (5.40%) Senior Software Engineer
17 18 (5.11%) AWS DevOps Engineer
Libraries, Frameworks & Software Standards
1 38 (10.80%) Spring Boot
2 36 (10.23%) Spring
3 28 (7.95%) Node.js
4 25 (7.10%) Elastic Stack
5 23 (6.53%) REST
6 21 (5.97%) Kafka
7 17 (4.83%) .NET
8 15 (4.26%) RESTful
9 14 (3.98%) ActiveMQ
9 14 (3.98%) ARM Templates
9 14 (3.98%) JMS
9 14 (3.98%) React
10 13 (3.69%) Hibernate
11 11 (3.13%) AWS CDK
11 11 (3.13%) Web Services
12 7 (1.99%) GraphQL
13 6 (1.70%) Next.js
14 5 (1.42%) ADO
14 5 (1.42%) JSON
14 5 (1.42%) PyTorch
Miscellaneous
1 55 (15.63%) Management Information System
2 49 (13.92%) Public Cloud
3 44 (12.50%) Cloud Native
4 34 (9.66%) Hybrid Cloud
5 22 (6.25%) Security Posture
6 17 (4.83%) Enterprise Software
7 16 (4.55%) Product Ownership
8 14 (3.98%) Credit Derivative
9 13 (3.69%) Self-Motivation
10 10 (2.84%) Data Centre
10 10 (2.84%) Distributed Systems
11 9 (2.56%) Cyber Security Posture
12 6 (1.70%) IoT
13 5 (1.42%) Distributed Computing
13 5 (1.42%) Greenfield Project
13 5 (1.42%) Legacy Systems
14 4 (1.14%) Algorithms
15 3 (0.85%) Data Structures
15 3 (0.85%) Embedded Systems
15 3 (0.85%) Private Cloud
Operating Systems
1 109 (30.97%) Linux
2 52 (14.77%) Windows
3 24 (6.82%) Unix
4 12 (3.41%) Red Hat Enterprise Linux
5 10 (2.84%) Windows Server
6 6 (1.70%) VMS
7 5 (1.42%) AIX
8 2 (0.57%) CentOS
8 2 (0.57%) CoreOS
8 2 (0.57%) zOS
Processes & Methodologies
1 246 (69.89%) DevOps
2 245 (69.60%) CI/CD
3 90 (25.57%) Software Engineering
4 89 (25.28%) Containerisation
5 76 (21.59%) Cloud Security
6 75 (21.31%) Agile
7 69 (19.60%) Mentoring
8 60 (17.05%) Microservices
9 58 (16.48%) Platform Engineering
10 54 (15.34%) Analytics
11 52 (14.77%) Deployment Automation
12 51 (14.49%) Infrastructure Engineering
13 48 (13.64%) Event-Driven
13 48 (13.64%) Problem-Solving
14 47 (13.35%) Test Automation
15 46 (13.07%) High Availability
16 37 (10.51%) Computer Science
17 36 (10.23%) Continuous Delivery
18 35 (9.94%) Continuous Integration
18 35 (9.94%) SDLC
Programming Languages
1 176 (50.00%) Python
2 86 (24.43%) Java
3 60 (17.05%) PowerShell
4 55 (15.63%) Bash
5 53 (15.06%) SQL
6 35 (9.94%) Go
7 31 (8.81%) JavaScript
8 24 (6.82%) Bicep
9 23 (6.53%) TypeScript
10 17 (4.83%) C#
10 17 (4.83%) C++
11 9 (2.56%) C
11 9 (2.56%) R
12 7 (1.99%) Ruby
13 4 (1.14%) Perl
13 4 (1.14%) PHP
13 4 (1.14%) Shell Script
14 3 (0.85%) Groovy
14 3 (0.85%) Scala
15 2 (0.57%) Rust
Qualifications
1 44 (12.50%) Degree
2 39 (11.08%) Security Cleared
3 29 (8.24%) AWS Certification
4 27 (7.67%) SC Cleared
5 22 (6.25%) Azure Certification
6 18 (5.11%) Computer Science Degree
7 14 (3.98%) AWS Certified Solutions Architect
8 10 (2.84%) Microsoft Certification
9 4 (1.14%) Cisco Certification
9 4 (1.14%) CISSP
9 4 (1.14%) DV Cleared
10 3 (0.85%) (ISC)2 CCSP
10 3 (0.85%) AWS Certified DevOps Engineer
10 3 (0.85%) BPSS Clearance
10 3 (0.85%) CCSP
10 3 (0.85%) Master's Degree
11 2 (0.57%) DBS Check
11 2 (0.57%) Oracle Certification
12 1 (0.28%) CCNA
12 1 (0.28%) CCNP
Quality Assurance & Compliance
1 32 (9.09%) GDPR
2 18 (5.11%) ISO/IEC 27001
3 16 (4.55%) HIPAA
4 15 (4.26%) NIST
5 13 (3.69%) QA
6 8 (2.27%) PCI DSS
7 5 (1.42%) Sarbanes-Oxley
8 4 (1.14%) Cyber Essentials
9 2 (0.57%) Accessibility
10 1 (0.28%) Actionable Recommendations
10 1 (0.28%) Basel III
10 1 (0.28%) IFRS
10 1 (0.28%) IFRS 9
10 1 (0.28%) ISO/IEC 27005
10 1 (0.28%) NCSC
10 1 (0.28%) NIST 800
10 1 (0.28%) SOC 2
System Software
1 109 (30.97%) Docker
2 15 (4.26%) Virtual Machines
3 13 (3.69%) Active Directory
4 7 (1.99%) VMware Infrastructure
5 3 (0.85%) VMware ESXi
6 2 (0.57%) vSphere
7 1 (0.28%) Hyper-V
7 1 (0.28%) VMware NSX
Systems Management
1 256 (72.73%) Terraform
2 153 (43.47%) Kubernetes
3 115 (32.67%) Ansible
4 31 (8.81%) Grafana
4 31 (8.81%) Prometheus
5 20 (5.68%) Puppet
6 17 (4.83%) Istio
7 11 (3.13%) Progress Chef
8 5 (1.42%) Tivoli Storage Manager
9 4 (1.14%) Microsoft Intune
10 3 (0.85%) CASB
10 3 (0.85%) linkerd
10 3 (0.85%) Nagios
10 3 (0.85%) Packer
10 3 (0.85%) vCenter Server
11 2 (0.57%) Argo
11 2 (0.57%) CA Endevor
11 2 (0.57%) Salt
11 2 (0.57%) Single Sign-On
12 1 (0.28%) Kibana
Vendors
1 56 (15.91%) Microsoft
2 26 (7.39%) IBM
3 20 (5.68%) Google
4 10 (2.84%) Oracle
5 9 (2.56%) Cisco
5 9 (2.56%) SAP
5 9 (2.56%) VMware
6 8 (2.27%) Fortinet
6 8 (2.27%) Palo Alto
7 7 (1.99%) Aruba
7 7 (1.99%) Databricks
7 7 (1.99%) Mellanox
7 7 (1.99%) NVIDIA
8 4 (1.14%) Atlassian
8 4 (1.14%) IBM Sterling
9 3 (0.85%) AppDynamics
9 3 (0.85%) Splunk
10 2 (0.57%) PagerDuty
10 2 (0.57%) Rapid7
10 2 (0.57%) ServiceNow