Games Jobs with Hybrid/Remote/WFH Options

Gaming
UK > Work from Home

The table below looks at the prevalence of the term Games in remote or hybrid work. Included is a benchmarking guide to the salaries offered in vacancies that cited Games over the 6 months leading up to 17 May 2025, comparing them to the same period in the previous two years.

6 months to
17 May 2025
Same period 2024 Same period 2023
Rank 43 209 204
Rank change year-on-year +166 -5 -114
Permanent jobs citing Games 1,215 536 710
As % of all permanent jobs with a WFH option 6.53% 1.59% 1.75%
As % of the General category 8.34% 2.58% 2.65%
Number of salaries quoted 532 367 479
10th Percentile - £30,000 £37,250
25th Percentile £23,504 £43,445 £47,500
Median annual salary (50th Percentile) £25,087 £55,000 £65,000
Median % change year-on-year -54.39% -15.38% -7.14%
75th Percentile £42,500 £74,875 £85,000
90th Percentile £71,250 £86,750 £105,000
UK median annual salary £26,929 £54,900 £62,500
% change year-on-year -50.95% -12.16% -10.71%

All General Skills
Work from Home

Games falls under the General Skills category. For comparison with the information above, the following table provides summary statistics for all permanent job vacancies with remote or hybrid options requiring common skills.

Permanent vacancies with a requirement for common skills 14,576 20,813 26,829
As % of all permanent jobs with a WFH option 78.32% 61.60% 66.03%
Number of salaries quoted 7,639 15,081 17,854
10th Percentile £25,087 £31,750 £36,250
25th Percentile £40,000 £41,500 £46,570
Median annual salary (50th Percentile) £55,000 £55,000 £62,500
Median % change year-on-year - -12.00% +4.17%
75th Percentile £76,840 £75,000 £82,751
90th Percentile £105,000 £95,000 £102,500
UK median annual salary £55,000 £52,500 £60,000
% change year-on-year +4.76% -12.50% -

Games
Trend for Jobs with a WFH Option

Job vacancies with remote working options citing Games as a proportion of all IT jobs advertised.
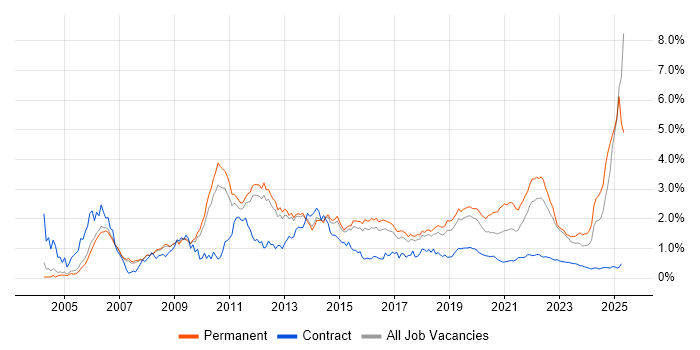
Games trend for jobs with Hybrid/Remote/WFH options

Games
Salary Trend for Jobs with a WFH Option

3-month moving average salary quoted in job vacancies with remote working options citing Games.

Games salary trend for jobs with a WFH option

Games
Salary Histogram for Jobs with a WFH Option

Salary distribution for jobs with remote working options citing Games over the 6 months to 17 May 2025.

Games salary histogram for jobs with a WFH option

Games
Co-occurring Skills and Capabilities with WFH Options by Category

The follow tables expand on the table above by listing co-occurrences grouped by category. The same employment type, locality and period is covered with up to 20 co-occurrences shown in each of the following categories:

Application Platforms
1 19 (1.56%) Apache Spark
2 5 (0.41%) Microsoft Exchange
3 3 (0.25%) IIS
4 2 (0.16%) SharePoint
4 2 (0.16%) WordPress
5 1 (0.082%) Jupyter
Applications
1 6 (0.49%) Microsoft Excel
2 3 (0.25%) Adobe After Effects
2 3 (0.25%) Blender
2 3 (0.25%) Maya
2 3 (0.25%) Trello
3 2 (0.16%) Adobe Creative Suite
3 2 (0.16%) Adobe Illustrator
3 2 (0.16%) Microsoft Office
3 2 (0.16%) Photoshop
3 2 (0.16%) ZBrush
4 1 (0.082%) Adobe Captivate
4 1 (0.082%) Adobe XD
4 1 (0.082%) Chatbot
4 1 (0.082%) InDesign
4 1 (0.082%) Microsoft PowerPoint
4 1 (0.082%) Moqups
4 1 (0.082%) Sketch
Business Applications
1 2 (0.16%) Oracle General Ledger
1 2 (0.16%) Oracle Payables
1 2 (0.16%) Oracle Receivables
2 1 (0.082%) Salesforce CRM
Cloud Services
1 52 (4.28%) AWS
2 39 (3.21%) Azure
3 28 (2.30%) GitHub
4 25 (2.06%) GCP
5 14 (1.15%) GitHub Actions
6 11 (0.91%) Microsoft 365
7 9 (0.74%) SaaS
8 8 (0.66%) AWS Lambda
8 8 (0.66%) Serverless
9 7 (0.58%) Amazon ECS
9 7 (0.58%) Power Platform
10 6 (0.49%) Amazon S3
11 5 (0.41%) Amazon CloudWatch
11 5 (0.41%) Google Analytics
12 4 (0.33%) Adobe Analytics
12 4 (0.33%) Cloud Computing
12 4 (0.33%) Figma
13 3 (0.25%) Asana
14 2 (0.16%) Power Automate
14 2 (0.16%) PowerApps
Communications & Networking
1 979 (80.58%) Broadband
2 19 (1.56%) HTTP
3 8 (0.66%) Firewall
4 6 (0.49%) NAS
4 6 (0.49%) SAN
5 4 (0.33%) Bluetooth
6 2 (0.16%) DHCP
6 2 (0.16%) DNS
7 1 (0.082%) BGP
7 1 (0.082%) OSPF
7 1 (0.082%) Remote Desktop
7 1 (0.082%) Software-Defined Networking
7 1 (0.082%) TCP/IP
7 1 (0.082%) VPN
7 1 (0.082%) WAN
7 1 (0.082%) Wireless
Database & Business Intelligence
1 18 (1.48%) MySQL
2 13 (1.07%) PostgreSQL
3 11 (0.91%) NoSQL
4 8 (0.66%) Tableau
5 7 (0.58%) Power BI
5 7 (0.58%) Relational Database
6 6 (0.49%) MongoDB
6 6 (0.49%) Redis
7 5 (0.41%) Amazon Athena
8 4 (0.33%) DynamoDB
8 4 (0.33%) Power Query
8 4 (0.33%) PowerPivot
8 4 (0.33%) SQL Server
9 3 (0.25%) Data Warehouse
10 2 (0.16%) Elasticsearch
11 1 (0.082%) Amazon QuickSight
11 1 (0.082%) Amazon Redshift
11 1 (0.082%) Couchbase
11 1 (0.082%) DocumentDB
11 1 (0.082%) GIS
Development Applications
1 39 (3.21%) Git
2 12 (0.99%) Gradle
3 10 (0.82%) Jenkins
4 8 (0.66%) webpack
5 7 (0.58%) SonarQube
6 5 (0.41%) Cypress.io
6 5 (0.41%) gulp
6 5 (0.41%) Maven
6 5 (0.41%) Vite
7 4 (0.33%) Grunt
8 3 (0.25%) TeamCity
9 2 (0.16%) Octopus Deploy
10 1 (0.082%) Jasmine
10 1 (0.082%) NUnit
10 1 (0.082%) PostCSS
10 1 (0.082%) rollup.js
10 1 (0.082%) Subversion
General
1 764 (62.88%) Banking
2 103 (8.48%) Social Skills
3 42 (3.46%) Finance
4 29 (2.39%) Retail
5 28 (2.30%) Analytical Skills
6 26 (2.14%) Advertising
7 24 (1.98%) Inclusion and Diversity
8 18 (1.48%) Billing
9 17 (1.40%) iGaming
10 15 (1.23%) Marketing
11 11 (0.91%) Law
12 5 (0.41%) Legal
13 4 (0.33%) Telecoms
14 3 (0.25%) Financial Institution
14 3 (0.25%) Public Sector
14 3 (0.25%) Tech for Good
15 2 (0.16%) Electronics
15 2 (0.16%) Manufacturing
16 1 (0.082%) Brand Awareness
16 1 (0.082%) Presentation Skills
Job Titles
1 758 (62.39%) Customer Service Advisor
2 300 (24.69%) Senior
3 65 (5.35%) Developer
4 57 (4.69%) Software Engineer
5 46 (3.79%) Senior Software Engineer
6 29 (2.39%) Lead
7 17 (1.40%) Android Developer
8 16 (1.32%) Analyst
8 16 (1.32%) Lead Developer
8 16 (1.32%) Senior Developer
9 12 (0.99%) Front-End Developer (Client-Side Developer)
9 12 (0.99%) PHP Developer
10 11 (0.91%) JavaScript Developer
11 10 (0.82%) PHP Software Engineer
12 8 (0.66%) Gen AI Engineer
13 7 (0.58%) Head of Software Development
13 7 (0.58%) iOS Android Developer
13 7 (0.58%) iOS Developer
13 7 (0.58%) Lead Android Developer
13 7 (0.58%) Lead iOS Developer
Libraries, Frameworks & Software Standards
1 223 (18.35%) Unity (Game Engine)
2 221 (18.19%) WebGL
3 216 (17.78%) GraphQL
4 41 (3.37%) Kafka
5 28 (2.30%) HTML
6 26 (2.14%) React
7 23 (1.89%) CSS
8 20 (1.65%) Node.js
9 14 (1.15%) Pixi.js
10 13 (1.07%) JSON
11 12 (0.99%) AngularJS
11 12 (0.99%) Vue
12 11 (0.91%) HTML5
13 10 (0.82%) RabbitMQ
13 10 (0.82%) Spring
14 9 (0.74%) .NET
14 9 (0.74%) OpenAPI
15 8 (0.66%) Unreal Engine
16 7 (0.58%) Elastic Stack
16 7 (0.58%) Laravel
Miscellaneous
1 221 (18.19%) Animation
2 44 (3.62%) Mobile Games
3 23 (1.89%) Distributed Systems
4 20 (1.65%) Algorithms
4 20 (1.65%) Mobile App
5 17 (1.40%) Legacy Systems
6 11 (0.91%) Cloud Native
7 10 (0.82%) Educational Technology
8 9 (0.74%) Online Games
9 7 (0.58%) Clustering
10 6 (0.49%) Client/Server
10 6 (0.49%) Greenfield Project
11 5 (0.41%) Management Information System
12 4 (0.33%) CMDB
12 4 (0.33%) Data Structures
12 4 (0.33%) Embedded Systems
12 4 (0.33%) IoT
13 3 (0.25%) Cyberattack
13 3 (0.25%) Product Ownership
13 3 (0.25%) Renewable Energy
Operating Systems
1 20 (1.65%) Linux
2 17 (1.40%) Android
2 17 (1.40%) Apple iOS
3 12 (0.99%) Windows
4 5 (0.41%) Windows Server
5 4 (0.33%) Ubuntu
5 4 (0.33%) Windows Server 2016
6 3 (0.25%) Windows 10
7 2 (0.16%) CentOS
8 1 (0.082%) Windows Server 2019
Processes & Methodologies
1 1,037 (85.35%) Problem-Solving
2 765 (62.96%) Customer Service
3 235 (19.34%) Artificial Intelligence
4 227 (18.68%) Prototyping
5 225 (18.52%) Rapid Prototyping
6 219 (18.02%) Storytelling
7 215 (17.70%) 3D Animation
7 215 (17.70%) Visual Effects
8 104 (8.56%) Software Engineering
9 82 (6.75%) Agile
10 50 (4.12%) Computer Science
11 42 (3.46%) Mentoring
12 40 (3.29%) Machine Learning
13 37 (3.05%) Analytics
13 37 (3.05%) DevOps
13 37 (3.05%) SOLID
14 33 (2.72%) Unit Testing
15 32 (2.63%) E-Commerce
16 30 (2.47%) Test Automation
17 29 (2.39%) User Experience
Programming Languages
1 215 (17.70%) HLSL
2 60 (4.94%) Python
3 44 (3.62%) JavaScript
4 42 (3.46%) SQL
5 38 (3.13%) PHP
6 32 (2.63%) Java
7 22 (1.81%) TypeScript
8 20 (1.65%) Scala
9 18 (1.48%) C#
10 17 (1.40%) Kotlin
10 17 (1.40%) Objective-C
10 17 (1.40%) Swift
11 11 (0.91%) Go
12 10 (0.82%) C++
13 7 (0.58%) PowerShell
14 5 (0.41%) R
15 4 (0.33%) C
15 4 (0.33%) Ladder Logic
16 1 (0.082%) T-SQL
Qualifications
1 65 (5.35%) Degree
2 25 (2.06%) Computer Science Degree
3 6 (0.49%) Six Sigma Black Belt
4 5 (0.41%) AWS Certification
4 5 (0.41%) AWS Certified Solutions Architect
4 5 (0.41%) Numerate Degree
5 3 (0.25%) ACCA
5 3 (0.25%) DBS Check
6 2 (0.16%) CCSAS
6 2 (0.16%) CIMA
6 2 (0.16%) CREST Certified
7 1 (0.082%) HNC
7 1 (0.082%) HND
7 1 (0.082%) ICAEW
7 1 (0.082%) Master's Degree
7 1 (0.082%) Microsoft Certification
7 1 (0.082%) PhD
7 1 (0.082%) SC Cleared
7 1 (0.082%) Security Cleared
Quality Assurance & Compliance
1 48 (3.95%) QA
2 14 (1.15%) Accessibility
3 9 (0.74%) GDPR
4 5 (0.41%) NCSC
4 5 (0.41%) SLA
5 3 (0.25%) Data Quality
6 2 (0.16%) ISO/IEC 17025
System Software
1 15 (1.23%) Docker
2 13 (1.07%) Active Directory
3 6 (0.49%) VMware Infrastructure
4 2 (0.16%) VMware ESXi
4 2 (0.16%) VMware NSX
Systems Management
1 27 (2.22%) Kubernetes
2 7 (0.58%) Prometheus
3 6 (0.49%) Terraform
4 5 (0.41%) Argo
5 4 (0.33%) Ansible
5 4 (0.33%) Microsoft Intune
5 4 (0.33%) SCCM
6 2 (0.16%) Grafana
Vendors
1 763 (62.80%) BT
2 42 (3.46%) Microsoft
3 36 (2.96%) Google
4 21 (1.73%) Apple
5 13 (1.07%) Adobe
6 12 (0.99%) New Relic
7 8 (0.66%) SAP
7 8 (0.66%) VMware
8 7 (0.58%) TikTok
9 5 (0.41%) ServiceNow
10 4 (0.33%) Siemens
10 4 (0.33%) Sun
11 3 (0.25%) Cisco
11 3 (0.25%) CrowdStrike
11 3 (0.25%) Twitter
12 2 (0.16%) Ahrefs
12 2 (0.16%) Datto
12 2 (0.16%) Facebook
12 2 (0.16%) Rollbar
12 2 (0.16%) Screaming Frog