Data Engineering Jobs

Data Engineering
UK

The table below provides summary statistics for permanent job vacancies requiring Data Engineering skills. It includes a benchmarking guide to the annual salaries offered in vacancies that cited Data Engineering over the 3 months leading up to 15 June 2025, comparing them to the same period in the previous two years.

3 months to
15 Jun 2025
Same period 2024 Same period 2023
Rank 172 145 201
Rank change year-on-year -27 +56 -59
Permanent jobs citing Data Engineering 676 803 663
As % of all permanent jobs advertised in the UK 1.99% 1.72% 1.80%
As % of the Processes & Methodologies category 2.17% 2.20% 1.90%
Number of salaries quoted 240 371 487
10th Percentile £42,500 £45,000 £46,250
25th Percentile £51,250 £57,500 £60,000
Median annual salary (50th Percentile) £70,000 £70,000 £80,000
Median % change year-on-year - -12.50% -
75th Percentile £95,000 £90,822 £100,000
90th Percentile £107,750 £105,000 £130,000
UK excluding London median annual salary £65,000 £65,400 £65,000
% change year-on-year -0.61% +0.62% -7.14%

All Process and Methodology Skills
UK

Data Engineering falls under the Processes and Methodologies category. For comparison with the information above, the following table provides summary statistics for all permanent job vacancies requiring process or methodology skills.

Permanent vacancies with a requirement for process or methodology skills 31,174 36,545 34,983
As % of all permanent jobs advertised in the UK 91.77% 78.40% 95.14%
Number of salaries quoted 14,112 22,334 24,098
10th Percentile £26,750 £31,250 £34,750
25th Percentile £36,250 £41,250 £46,000
Median annual salary (50th Percentile) £55,000 £55,000 £62,500
Median % change year-on-year - -12.00% +4.17%
75th Percentile £73,708 £75,000 £80,000
90th Percentile £95,000 £95,000 £100,000
UK excluding London median annual salary £50,000 £50,000 £55,000
% change year-on-year - -9.09% +4.76%

Data Engineering
Job Vacancy Trend

Job postings citing Data Engineering as a proportion of all IT jobs advertised.
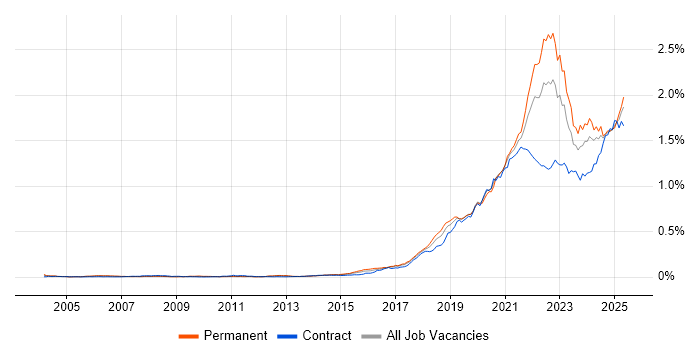
Job vacancy trend for Data Engineering in the UK

Data Engineering
Salary Trend

3-month moving average salary quoted in jobs citing Data Engineering.

Salary trend for Data Engineering in the UK

Data Engineering
Salary Histogram

Salary distribution for jobs citing Data Engineering over the 3 months to 15 June 2025.

Salary histogram for Data Engineering in the UK

Data Engineering
Top 15 Job Locations

The table below looks at the demand and provides a guide to the median salaries quoted in IT jobs citing Data Engineering within the UK over the 3 months to 15 June 2025. The 'Rank Change' column provides an indication of the change in demand within each location based on the same 3 month period last year.

Location Rank Change
on Same Period
Last Year
Matching
Permanent
IT Job Ads
Median Salary
Past 3 Months
Median Salary
% Change
on Same Period
Last Year
Live
Jobs
England -29 630 £70,000 - 1,701
UK excluding London -14 461 £65,000 -0.61% 997
Work from Home +39 260 £70,250 +0.36% 861
North of England -57 232 £58,500 -2.50% 206
North West -59 200 £56,500 +0.44% 101
London +34 191 £83,750 -1.47% 1,046
South East +71 127 £65,000 +23.81% 467
Scotland +59 35 £61,250 -12.50% 81
Yorkshire +3 26 £68,750 +10.00% 79
East of England -16 23 £50,000 -23.08% 48
Midlands -50 23 £60,000 -8.26% 93
South West +21 22 £70,000 -12.50% 72
West Midlands -16 17 £59,000 -9.79% 49
North East -10 6 £47,500 -36.67% 26
East Midlands -21 6 £70,000 - 40

Data Engineering
Co-occurring Skills and Capabilities by Category

The follow tables expand on the table above by listing co-occurrences grouped by category. The same employment type, locality and period is covered with up to 20 co-occurrences shown in each of the following categories:

Application Platforms
1 129 (12.37%) Apache Spark
2 122 (11.70%) Apache Airflow
3 83 (7.96%) Apache
4 36 (3.45%) SharePoint
5 26 (2.49%) IBM Domino
6 6 (0.58%) Confluence
6 6 (0.58%) SAS
7 3 (0.29%) Luigi
8 1 (0.096%) Appian
8 1 (0.096%) GeoServer
8 1 (0.096%) Microsoft Exchange
8 1 (0.096%) Oracle Workflow
Applications
1 15 (1.44%) Microsoft Excel
2 4 (0.38%) Microsoft PowerPoint
2 4 (0.38%) Microsoft Project
3 3 (0.29%) Microsoft Office
3 3 (0.29%) Spreadsheet
4 2 (0.19%) Trello
5 1 (0.096%) SPSS
Business Applications
1 3 (0.29%) Dynamics AX
2 1 (0.096%) Aladdin
2 1 (0.096%) Dynamics CRM
2 1 (0.096%) Loan IQ
2 1 (0.096%) Payment Gateway
2 1 (0.096%) SAP FI
2 1 (0.096%) SAP S/4HANA
Cloud Services
1 622 (59.64%) Azure
2 542 (51.97%) AWS
3 352 (33.75%) GCP
4 170 (16.30%) Power Platform
5 135 (12.94%) Snowflake
6 111 (10.64%) Azure Data Factory
7 104 (9.97%) dbt
8 103 (9.88%) Azure Synapse Analytics
9 98 (9.40%) Serverless
10 79 (7.57%) AWS Lambda
11 57 (5.47%) OpenShift
12 56 (5.37%) Azure DevOps
13 54 (5.18%) Amazon ECS
14 45 (4.31%) Power Automate
15 43 (4.12%) Amazon S3
16 39 (3.74%) GitHub
17 37 (3.55%) PowerApps
18 21 (2.01%) Vertex AI
19 20 (1.92%) GitHub Actions
20 17 (1.63%) Azure API Management
Communications & Networking
1 4 (0.38%) 5G
1 4 (0.38%) Broadband
2 3 (0.29%) Internet
2 3 (0.29%) PuTTY
3 2 (0.19%) ADSL2
3 2 (0.19%) VPN
4 1 (0.096%) DNS
4 1 (0.096%) Intrusion Detection
4 1 (0.096%) Network Security
Database & Business Intelligence
1 250 (23.97%) Data Warehouse
2 169 (16.20%) Power BI
3 146 (14.00%) Data Lake
4 96 (9.20%) Big Data
5 83 (7.96%) Amazon Athena
6 73 (7.00%) NoSQL
7 67 (6.42%) Tableau
8 66 (6.33%) Apache Iceberg
9 64 (6.14%) Metadata
10 60 (5.75%) Dremio
11 55 (5.27%) SQL Server
12 52 (4.99%) BigQuery
13 51 (4.89%) Apache Arrow
13 51 (4.89%) Apache Ignite
14 48 (4.60%) Amazon Redshift
15 47 (4.51%) Hadoop
16 45 (4.31%) Relational Database
17 42 (4.03%) SQL Server Integration Services
18 38 (3.64%) Data Mining
19 36 (3.45%) PostgreSQL
Development Applications
1 54 (5.18%) Artifactory
2 40 (3.84%) Git
3 22 (2.11%) JIRA
4 12 (1.15%) Jenkins
5 8 (0.77%) CircleCI
6 7 (0.67%) Bitbucket
7 5 (0.48%) Cypress.io
8 4 (0.38%) MLflow
9 2 (0.19%) ER Studio
10 1 (0.096%) GitLab
10 1 (0.096%) kappa
10 1 (0.096%) Octopus Deploy
10 1 (0.096%) PHPUnit
10 1 (0.096%) Selenium
10 1 (0.096%) SpecFlow
10 1 (0.096%) Spinnaker
10 1 (0.096%) SQL Server Management Studio (SSMS)
10 1 (0.096%) Toad
10 1 (0.096%) Visual Studio
10 1 (0.096%) Vite
General
1 296 (28.38%) Finance
2 259 (24.83%) Social Skills
3 225 (21.57%) Inclusion and Diversity
4 160 (15.34%) Law
5 156 (14.96%) Analytical Skills
6 89 (8.53%) Banking
7 71 (6.81%) Front Office
8 64 (6.14%) Retail
9 47 (4.51%) Public Sector
10 34 (3.26%) Marketing
11 31 (2.97%) Manufacturing
12 23 (2.21%) Legal
13 14 (1.34%) Investment Banking
14 13 (1.25%) Retail Banking
15 10 (0.96%) Pharmaceutical
16 9 (0.86%) Advertising
16 9 (0.86%) Private Banking
17 8 (0.77%) Presentation Skills
17 8 (0.77%) Telecoms
18 6 (0.58%) Automotive
Job Titles
1 379 (36.34%) Senior
2 360 (34.52%) Data Engineer
3 243 (23.30%) Software Engineer
4 225 (21.57%) Lead
5 193 (18.50%) Senior Software Engineer
6 105 (10.07%) Senior Data Engineer
7 92 (8.82%) Python Engineer
8 67 (6.42%) AWS Engineer
9 63 (6.04%) DevOps Engineer
10 52 (4.99%) AWS DevOps
10 52 (4.99%) AWS DevOps Engineer
11 46 (4.41%) Lead Data Engineer
12 41 (3.93%) Data Manager
13 39 (3.74%) Azure Engineer
14 33 (3.16%) Architect
14 33 (3.16%) Developer
15 29 (2.78%) Analyst
15 29 (2.78%) Azure Data Engineer
15 29 (2.78%) Lead Software Engineer
16 26 (2.49%) Data Architect
Libraries, Frameworks & Software Standards
1 204 (19.56%) .NET
2 184 (17.64%) Node.js
3 144 (13.81%) PySpark
4 127 (12.18%) Kafka
5 51 (4.89%) J2EE
6 23 (2.21%) Pandas
6 23 (2.21%) React
7 22 (2.11%) NumPy
8 17 (1.63%) RESTful
8 17 (1.63%) Spring
9 14 (1.34%) Middleware
9 14 (1.34%) PyTorch
9 14 (1.34%) scikit-learn
9 14 (1.34%) TensorFlow
10 13 (1.25%) AngularJS
10 13 (1.25%) REST
11 11 (1.05%) GraphQL
11 11 (1.05%) Spring Boot
12 10 (0.96%) Plotly
13 9 (0.86%) Keras
Miscellaneous
1 181 (17.35%) Linux Command Line
1 181 (17.35%) Self-Motivation
2 178 (17.07%) Cyberattack
3 68 (6.52%) Cloud Native
4 66 (6.33%) Algorithms
5 64 (6.14%) Product Ownership
6 35 (3.36%) Management Information System
7 29 (2.78%) Data Structures
8 23 (2.21%) Legacy Systems
9 17 (1.63%) Greenfield Project
10 14 (1.34%) FMCG
11 12 (1.15%) Distributed Systems
12 11 (1.05%) Reference Data
13 10 (0.96%) Reinsurance
14 8 (0.77%) Derivative
14 8 (0.77%) Equities
14 8 (0.77%) Fixed Income
15 6 (0.58%) Enterprise Software
15 6 (0.58%) Low-Code
16 5 (0.48%) Data Fabric
Operating Systems
1 190 (18.22%) Linux
2 11 (1.05%) Unix
3 3 (0.29%) Windows
4 2 (0.19%) VMS
Processes & Methodologies
1 470 (45.06%) Agile
2 397 (38.06%) Analytics
3 382 (36.63%) Machine Learning
4 378 (36.24%) Software Engineering
5 350 (33.56%) Mentoring
6 287 (27.52%) DevOps
7 281 (26.94%) Data Pipeline
8 276 (26.46%) ETL
9 260 (24.93%) Data Modelling
10 255 (24.45%) CI/CD
11 244 (23.39%) Site Reliability Engineering
12 239 (22.91%) Data Science
13 229 (21.96%) Business Intelligence
14 214 (20.52%) Scrum
15 213 (20.42%) Microservices
16 204 (19.56%) Artificial Intelligence
17 196 (18.79%) Data Governance
18 194 (18.60%) Problem-Solving
19 191 (18.31%) User Experience
20 185 (17.74%) Cloud Security
Programming Languages
1 681 (65.29%) Python
2 454 (43.53%) SQL
3 349 (33.46%) Java
4 234 (22.44%) Go
5 195 (18.70%) C++
5 195 (18.70%) JavaScript
6 180 (17.26%) Rust
7 60 (5.75%) C#
8 47 (4.51%) T-SQL
9 44 (4.22%) Scala
10 33 (3.16%) Data Analysis Expressions
11 22 (2.11%) R
12 14 (1.34%) PowerShell
13 12 (1.15%) Bash
14 11 (1.05%) TypeScript
15 7 (0.67%) Shell Script
16 6 (0.58%) SPARQL
17 4 (0.38%) Bicep
18 3 (0.29%) Cypher
18 3 (0.29%) PROC SQL
Qualifications
1 220 (21.09%) Security Cleared
2 204 (19.56%) AWS Certification
3 184 (17.64%) AWS Certified Solutions Architect
4 183 (17.55%) DV Cleared
5 178 (17.07%) AWS Certified Developer
6 167 (16.01%) Degree
7 41 (3.93%) Computer Science Degree
8 36 (3.45%) SC Cleared
9 35 (3.36%) Master's Degree
10 31 (2.97%) Azure Certification
11 15 (1.44%) PhD
12 8 (0.77%) DBS Check
13 7 (0.67%) Microsoft Certification
14 5 (0.48%) BPSS Clearance
14 5 (0.48%) PMI Certification
14 5 (0.48%) PMP
15 4 (0.38%) Numerate Degree
15 4 (0.38%) SAP Certification
16 3 (0.29%) SnowPro
17 1 (0.096%) FFIEC
Quality Assurance & Compliance
1 205 (19.65%) Data Quality
2 59 (5.66%) QA
3 49 (4.70%) Accessibility
4 46 (4.41%) GDPR
5 9 (0.86%) California Consumer Privacy Act
5 9 (0.86%) ISO/IEC 27001
6 8 (0.77%) NIST
7 2 (0.19%) Actionable Recommendations
7 2 (0.19%) Dublin Core
7 2 (0.19%) GRC
8 1 (0.096%) COBIT
8 1 (0.096%) Cyber Essentials
8 1 (0.096%) Cyber Essentials PLUS
8 1 (0.096%) HIPAA
8 1 (0.096%) PMO
8 1 (0.096%) SLA
8 1 (0.096%) SOC 2
System Software
1 119 (11.41%) Docker
2 11 (1.05%) HDFS
3 8 (0.77%) Apache Flume
4 6 (0.58%) Active Directory
5 2 (0.19%) Virtual Machines
6 1 (0.096%) Slurm Workload Manager
Systems Management
1 126 (12.08%) Terraform
2 112 (10.74%) Kubernetes
3 9 (0.86%) Grafana
4 8 (0.77%) Oozie
4 8 (0.77%) Prometheus
5 3 (0.29%) Kibana
5 3 (0.29%) logstash
5 3 (0.29%) Packer
6 1 (0.096%) Ansible
6 1 (0.096%) Kubeflow
Vendors
1 204 (19.56%) Databricks
2 184 (17.64%) Microsoft
3 82 (7.86%) Google
4 34 (3.26%) Oracle
5 33 (3.16%) Informatica
6 28 (2.68%) ServiceNow
7 22 (2.11%) OpenAI
8 19 (1.82%) SAP
9 18 (1.73%) Palantir
10 13 (1.25%) Foundry
11 8 (0.77%) Talend
12 7 (0.67%) Cloudera
13 6 (0.58%) Red Hat
14 5 (0.48%) MicroStrategy
14 5 (0.48%) Salesforce
14 5 (0.48%) StreamSets
14 5 (0.48%) Teradata
14 5 (0.48%) Vertica
15 4 (0.38%) Splunk
16 3 (0.29%) Atlassian