Line Management Jobs with Hybrid/Remote/WFH Options

Line Management
UK > Work from Home

The table below provides summary statistics for permanent remote or hybrid work requiring Line Management skills. It includes a benchmarking guide to the annual salaries offered in vacancies that cited Line Management over the 6 months leading up to 29 May 2025, comparing them to the same period in the previous two years.

6 months to
29 May 2025
Same period 2024 Same period 2023
Rank 56 102 132
Rank change year-on-year +46 +30 +13
Permanent jobs citing Line Management 957 961 1,023
As % of all permanent jobs with a WFH option 5.12% 2.80% 2.57%
As % of the Processes & Methodologies category 5.45% 3.09% 2.68%
Number of salaries quoted 253 797 639
10th Percentile £25,000 £28,250 £41,250
25th Percentile £25,313 £41,998 £52,500
Median annual salary (50th Percentile) £54,282 £58,800 £68,515
Median % change year-on-year -7.68% -14.18% +9.62%
75th Percentile £70,000 £91,250 £86,393
90th Percentile £87,500 £142,500 £111,000
UK median annual salary £54,793 £52,396 £65,262
% change year-on-year +4.58% -19.72% +8.77%

All Process and Methodology Skills
Work from Home

Line Management falls under the Processes and Methodologies category. For comparison with the information above, the following table provides summary statistics for all permanent job vacancies with remote or hybrid options requiring process or methodology skills.

Permanent vacancies with a requirement for process or methodology skills 17,565 31,100 38,209
As % of all permanent jobs with a WFH option 93.96% 90.53% 96.07%
Number of salaries quoted 9,249 23,476 26,508
10th Percentile £27,000 £33,750 £37,500
25th Percentile £42,500 £42,500 £47,500
Median annual salary (50th Percentile) £57,500 £57,500 £62,621
Median % change year-on-year - -8.18% +4.37%
75th Percentile £77,500 £75,000 £82,500
90th Percentile £101,250 £95,000 £100,000
UK median annual salary £57,500 £55,000 £61,000
% change year-on-year +4.55% -9.84% +1.67%

Line Management
Trend for Jobs with a WFH Option

Job vacancies with remote working options citing Line Management as a proportion of all IT jobs advertised.
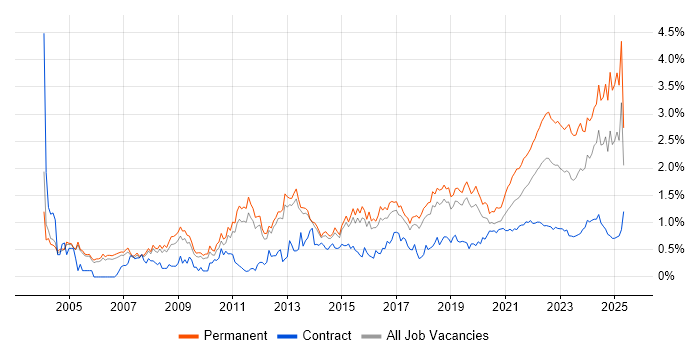
Line Management trend for jobs with Hybrid/Remote/WFH options

Line Management
Salary Trend for Jobs with a WFH Option

3-month moving average salary quoted in job vacancies with remote working options citing Line Management.

Line Management salary trend for jobs with a WFH option

Line Management
Salary Histogram for Jobs with a WFH Option

Salary distribution for jobs with remote working options citing Line Management over the 6 months to 29 May 2025.

Line Management salary histogram for jobs with a WFH option

Line Management
Co-occurring Skills and Capabilities with WFH Options by Category

The follow tables expand on the table above by listing co-occurrences grouped by category. The same employment type, locality and period is covered with up to 20 co-occurrences shown in each of the following categories:

Application Platforms
1 12 (1.25%) SharePoint
2 9 (0.94%) WordPress
3 5 (0.52%) Microsoft Exchange
4 4 (0.42%) Confluence
5 3 (0.31%) OpenEdge
6 2 (0.21%) ColdFusion
6 2 (0.21%) MTS
6 2 (0.21%) SharePoint Server
7 1 (0.10%) CMS
7 1 (0.10%) IIS
Applications
1 38 (3.97%) Microsoft Office
2 25 (2.61%) Simulink
3 11 (1.15%) Microsoft Excel
4 7 (0.73%) Microsoft PowerPoint
5 3 (0.31%) Adobe Creative Suite
5 3 (0.31%) Adobe Illustrator
5 3 (0.31%) InDesign
5 3 (0.31%) Photoshop
5 3 (0.31%) Trello
6 1 (0.10%) Adobe Premiere
6 1 (0.10%) MS Visio
6 1 (0.10%) Revit
Business Applications
1 8 (0.84%) Magento
1 8 (0.84%) Shopify
2 5 (0.52%) Dynamics CRM
3 3 (0.31%) Dynamics GP
3 3 (0.31%) Sparx Enterprise Architect
4 1 (0.10%) Maximo
4 1 (0.10%) Oracle ERP
4 1 (0.10%) Oracle Payables
Cloud Services
1 101 (10.55%) Azure
2 58 (6.06%) AWS
3 49 (5.12%) Amazon EKS
3 49 (5.12%) AWS CloudFormation
4 27 (2.82%) Microsoft 365
5 24 (2.51%) Power Platform
6 23 (2.40%) SaaS
7 16 (1.67%) Azure DevOps
8 13 (1.36%) Dynamics 365
8 13 (1.36%) PowerApps
9 9 (0.94%) Entra ID
10 8 (0.84%) BigCommerce
11 7 (0.73%) Microsoft Copilot
11 7 (0.73%) Stripe
12 4 (0.42%) Asana
13 3 (0.31%) Azure Sentinel
13 3 (0.31%) OneDrive
13 3 (0.31%) Serverless
14 2 (0.21%) IaaS
14 2 (0.21%) Power Automate
Communications & Networking
1 265 (27.69%) VPN
2 262 (27.38%) Cisco IOS
3 14 (1.46%) Firewall
4 11 (1.15%) Internet
5 10 (1.04%) Network Security
6 8 (0.84%) WAN
7 7 (0.73%) SSH
8 6 (0.63%) EIGRP
8 6 (0.63%) OSPF
8 6 (0.63%) RIP
8 6 (0.63%) SNMP
9 5 (0.52%) Wi-Fi
10 4 (0.42%) Broadband
11 3 (0.31%) DHCP
11 3 (0.31%) DNS
11 3 (0.31%) VLAN
12 2 (0.21%) HTTP
12 2 (0.21%) Intranet
12 2 (0.21%) LAN
12 2 (0.21%) VoIP
Database & Business Intelligence
1 50 (5.22%) Elasticsearch
2 12 (1.25%) Power BI
3 11 (1.15%) SQL Server
4 3 (0.31%) Metadata
4 3 (0.31%) PostgreSQL
5 2 (0.21%) Big Data
5 2 (0.21%) Data Warehouse
5 2 (0.21%) Relational Database
6 1 (0.10%) BigQuery
6 1 (0.10%) Data Lake
6 1 (0.10%) DTS
6 1 (0.10%) GIS
6 1 (0.10%) Looker
6 1 (0.10%) Oracle Database
6 1 (0.10%) Power Query
6 1 (0.10%) SQL Server Integration Services
6 1 (0.10%) SQL Server Reporting Services
Development Applications
1 12 (1.25%) Git
2 11 (1.15%) Jenkins
3 8 (0.84%) JIRA
3 8 (0.84%) Maven
4 3 (0.31%) ERwin
5 2 (0.21%) JUnit
5 2 (0.21%) Octopus Deploy
5 2 (0.21%) Subversion
5 2 (0.21%) Team Foundation Server
6 1 (0.10%) Bitbucket
6 1 (0.10%) Eclipse
6 1 (0.10%) GitLab
6 1 (0.10%) Snyk
6 1 (0.10%) TeamCity
6 1 (0.10%) Visual Studio
General
1 629 (65.73%) Inclusion and Diversity
2 331 (34.59%) Analytical Skills
3 299 (31.24%) Legal
4 295 (30.83%) Law
5 156 (16.30%) Finance
6 108 (11.29%) Social Skills
7 87 (9.09%) Banking
8 32 (3.34%) Organisational Skills
9 25 (2.61%) Aerospace
9 25 (2.61%) Retail
10 22 (2.30%) Marketing
11 14 (1.46%) Police
11 14 (1.46%) Public Sector
12 11 (1.15%) Tech for Good
13 10 (1.04%) Local Government
14 9 (0.94%) Games
15 8 (0.84%) Manufacturing
15 8 (0.84%) Telecoms
16 7 (0.73%) Advertising
16 7 (0.73%) Presentation Skills
Job Titles
1 271 (28.32%) Infrastructure Engineer
2 93 (9.72%) Lead
3 82 (8.57%) Developer
4 64 (6.69%) Senior
5 60 (6.27%) Software Developer
6 35 (3.66%) Team Leader
7 26 (2.72%) Systems Engineer
8 25 (2.61%) Lead Systems Engineer
8 25 (2.61%) Senior Systems Engineer
9 18 (1.88%) Lead Developer
10 16 (1.67%) Development Manager
10 16 (1.67%) Senior Manager
11 11 (1.15%) Engineering Manager
11 11 (1.15%) Product Manager
11 11 (1.15%) Project Manager
12 10 (1.04%) Application Development Manager
12 10 (1.04%) Applications Development Manager
12 10 (1.04%) Applications Manager
12 10 (1.04%) IT Manager
13 9 (0.94%) Front-End Developer (Client-Side Developer)
Libraries, Frameworks & Software Standards
1 262 (27.38%) Elastic Stack
2 80 (8.36%) .NET
3 60 (6.27%) Software Packaging
4 55 (5.75%) Node.js
5 49 (5.12%) Pandas
6 25 (2.61%) HTML
7 16 (1.67%) CSS
8 13 (1.36%) .NET Core
9 12 (1.25%) RESTful
10 10 (1.04%) EDI
11 8 (0.84%) Android Jetpack
11 8 (0.84%) Jetpack Compose
11 8 (0.84%) React
12 5 (0.52%) .NET Framework
12 5 (0.52%) AngularJS
12 5 (0.52%) CSS3
12 5 (0.52%) HTML5
12 5 (0.52%) REST
12 5 (0.52%) SailPoint
13 4 (0.42%) Web Services
Miscellaneous
1 596 (62.28%) Cyberattack
2 40 (4.18%) Management Information System
3 18 (1.88%) Product Ownership
4 12 (1.25%) Driving Licence
4 12 (1.25%) Social Media
4 12 (1.25%) Virtual Team
5 9 (0.94%) Mobile App
5 9 (0.94%) NHS
5 9 (0.94%) Self-Motivation
6 8 (0.84%) EPoS
6 8 (0.84%) Online Banking
7 7 (0.73%) Learning Management System
7 7 (0.73%) Mainframe
7 7 (0.73%) Onboarding
8 5 (0.52%) Cloud Native
8 5 (0.52%) Microsoft Licensing
9 4 (0.42%) Enterprise Software
9 4 (0.42%) Hackathon
10 3 (0.31%) iPad
10 3 (0.31%) iPhone
Operating Systems
1 319 (33.33%) Android
2 315 (32.92%) Linux
3 286 (29.89%) Windows
4 7 (0.73%) Windows Server
5 5 (0.52%) Windows Server 2016
6 3 (0.31%) Apple iOS
6 3 (0.31%) Windows 10
7 2 (0.21%) Windows Server 2019
8 1 (0.10%) Mac OS
8 1 (0.10%) Robot Operating System
8 1 (0.10%) Solaris
8 1 (0.10%) Unix
Processes & Methodologies
1 393 (41.07%) Mathematics
2 368 (38.45%) Cybersecurity
3 300 (31.35%) Problem-Solving
4 298 (31.14%) DevOps
5 288 (30.09%) Risk Management
6 285 (29.78%) Creative Thinking
7 271 (28.32%) Infrastructure Engineering
8 263 (27.48%) Platform Engineering
9 262 (27.38%) Storage Management
9 262 (27.38%) Task Automation
10 157 (16.41%) Software Engineering
11 141 (14.73%) Agile
12 93 (9.72%) Artificial Intelligence
13 84 (8.78%) Project Management
14 75 (7.84%) Fintech
15 69 (7.21%) CI/CD
15 69 (7.21%) Collaborative Working
16 60 (6.27%) Containerisation
16 60 (6.27%) Mentoring
17 57 (5.96%) Coaching
Programming Languages
1 319 (33.33%) Python
2 264 (27.59%) Bash
2 264 (27.59%) PowerShell
3 82 (8.57%) JavaScript
4 53 (5.54%) C++
5 52 (5.43%) Java
6 51 (5.33%) Go
7 49 (5.12%) Rust
8 25 (2.61%) C#
9 15 (1.57%) SQL
10 14 (1.46%) PHP
11 10 (1.04%) TypeScript
12 8 (0.84%) Delphi
12 8 (0.84%) Kotlin
13 5 (0.52%) Ruby
14 3 (0.31%) Progress 4GL
15 2 (0.21%) Elixir
15 2 (0.21%) F#
15 2 (0.21%) Scala
15 2 (0.21%) T-SQL
Qualifications
1 125 (13.06%) Degree
2 58 (6.06%) Security Cleared
3 53 (5.54%) DV Cleared
4 27 (2.82%) BPSS Clearance
5 11 (1.15%) DBS Check
6 7 (0.73%) Master's Degree
7 6 (0.63%) CISSP
8 5 (0.52%) CISM
9 3 (0.31%) Chartered Engineer
9 3 (0.31%) CITP
9 3 (0.31%) Computer Science Degree
9 3 (0.31%) CSPO
9 3 (0.31%) Microsoft Certification
10 2 (0.21%) ACCA
10 2 (0.21%) AWS Certification
10 2 (0.21%) Azure Certification
10 2 (0.21%) CESG Certified Professional
10 2 (0.21%) CISMP
10 2 (0.21%) ITIL Foundation Certificate
10 2 (0.21%) PMP
Quality Assurance & Compliance
1 285 (29.78%) NCSC
2 36 (3.76%) Accessibility
3 17 (1.78%) GDPR
4 12 (1.25%) QA
5 7 (0.73%) WCAG
6 6 (0.63%) NIST
7 5 (0.52%) ISO/IEC 27001
7 5 (0.52%) SLA
8 4 (0.42%) ISO 9001
9 3 (0.31%) PCI DSS
9 3 (0.31%) PMO
9 3 (0.31%) Sarbanes-Oxley
10 1 (0.10%) COBIT
10 1 (0.10%) Data Quality
10 1 (0.10%) ECSS
10 1 (0.10%) ITGC
System Software
1 326 (34.06%) Docker
2 264 (27.59%) Hyper-V
3 262 (27.38%) VMware NSX
3 262 (27.38%) vSphere
4 15 (1.57%) Active Directory
5 3 (0.31%) BitLocker
5 3 (0.31%) Firmware
6 1 (0.10%) LXC
6 1 (0.10%) Samba
6 1 (0.10%) Virtual Servers
Systems Management
1 325 (33.96%) Terraform
2 312 (32.60%) Ansible
3 57 (5.96%) Kubernetes
4 6 (0.63%) Microsoft Intune
5 3 (0.31%) SCCM
5 3 (0.31%) Single Sign-On
6 1 (0.10%) Progress Chef
6 1 (0.10%) Puppet
6 1 (0.10%) Systems Management Server (SMS)
Vendors
1 272 (28.42%) Cisco
2 263 (27.48%) Splunk
3 262 (27.38%) 3PAR
3 262 (27.38%) Juniper
4 81 (8.46%) Microsoft
5 25 (2.61%) MathWorks
6 11 (1.15%) Adobe
6 11 (1.15%) Oracle
7 9 (0.94%) Google
8 8 (0.84%) SAP
9 6 (0.63%) Apple
9 6 (0.63%) CheckPoint
9 6 (0.63%) SolarWinds
10 5 (0.52%) NEC
10 5 (0.52%) TikTok
11 4 (0.42%) Concur
11 4 (0.42%) JD Edwards
11 4 (0.42%) Mercator
11 4 (0.42%) Sage
12 3 (0.31%) Progress