Risk Management Jobs with Hybrid/Remote/WFH Options

Risk Management
UK > Work from Home

The table below provides summary statistics for permanent remote or hybrid work requiring Risk Management skills. It includes a benchmarking guide to the annual salaries offered in vacancies that cited Risk Management over the 6 months leading up to 28 May 2025, comparing them to the same period in the previous two years.

6 months to
28 May 2025
Same period 2024 Same period 2023
Rank 79 121 132
Rank change year-on-year +42 +11 +35
Permanent jobs citing Risk Management 779 856 1,066
As % of all permanent jobs with a WFH option 4.18% 2.50% 2.66%
As % of the Processes & Methodologies category 4.45% 2.76% 2.77%
Number of salaries quoted 375 522 782
10th Percentile £47,200 £41,250 £42,000
25th Percentile £57,125 £50,250 £47,500
Median annual salary (50th Percentile) £70,000 £60,202 £65,000
Median % change year-on-year +16.28% -7.38% -
75th Percentile £100,000 £82,500 £86,250
90th Percentile £137,500 £101,250 £103,625
UK median annual salary £69,373 £60,000 £65,000
% change year-on-year +15.62% -7.69% -

All Process and Methodology Skills
Work from Home

Risk Management falls under the Processes and Methodologies category. For comparison with the information above, the following table provides summary statistics for all permanent job vacancies with remote or hybrid options requiring process or methodology skills.

Permanent vacancies with a requirement for process or methodology skills 17,498 30,975 38,433
As % of all permanent jobs with a WFH option 93.97% 90.61% 96.05%
Number of salaries quoted 9,196 23,429 26,704
10th Percentile £27,250 £33,750 £37,500
25th Percentile £42,500 £42,500 £47,500
Median annual salary (50th Percentile) £58,000 £57,500 £62,500
Median % change year-on-year +0.87% -8.00% +4.17%
75th Percentile £77,500 £75,000 £82,500
90th Percentile £102,500 £95,000 £100,000
UK median annual salary £57,500 £55,000 £61,000
% change year-on-year +4.55% -9.84% +1.67%

Risk Management
Trend for Jobs with a WFH Option

Job vacancies with remote working options citing Risk Management as a proportion of all IT jobs advertised.
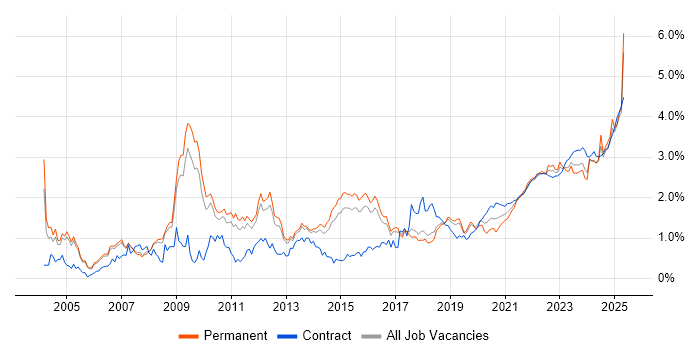
Risk Management trend for jobs with Hybrid/Remote/WFH options

Risk Management
Salary Trend for Jobs with a WFH Option

3-month moving average salary quoted in job vacancies with remote working options citing Risk Management.

Risk Management salary trend for jobs with a WFH option

Risk Management
Salary Histogram for Jobs with a WFH Option

Salary distribution for jobs with remote working options citing Risk Management over the 6 months to 28 May 2025.

Risk Management salary histogram for jobs with a WFH option

Risk Management
Co-occurring Skills and Capabilities with WFH Options by Category

The follow tables expand on the table above by listing co-occurrences grouped by category. The same employment type, locality and period is covered with up to 20 co-occurrences shown in each of the following categories:

Application Platforms
1 55 (7.06%) Apache Airflow
2 27 (3.47%) Microsoft Exchange
3 18 (2.31%) SharePoint
4 5 (0.64%) Confluence
5 4 (0.51%) SAS
6 2 (0.26%) Oracle Workflow
Applications
1 22 (2.82%) Microsoft Office
2 16 (2.05%) Microsoft Excel
3 11 (1.41%) Microsoft PowerPoint
4 7 (0.90%) Trello
5 6 (0.77%) Microsoft Project
6 5 (0.64%) Spreadsheet
7 2 (0.26%) Oracle Smart View
8 1 (0.13%) MS Visio
Business Applications
1 6 (0.77%) Dynamics CRM
2 2 (0.26%) Adaptiv
2 2 (0.26%) Oracle Assets
2 2 (0.26%) Oracle Cash Management
2 2 (0.26%) Oracle ERP
2 2 (0.26%) Oracle Financials
2 2 (0.26%) Oracle General Ledger
2 2 (0.26%) Oracle Payables
2 2 (0.26%) Oracle Receivables
2 2 (0.26%) SAP Oil and Gas
3 1 (0.13%) Sage 200
3 1 (0.13%) Shopify
Cloud Services
1 85 (10.91%) AWS
2 66 (8.47%) GCP
3 56 (7.19%) dbt
4 52 (6.68%) Azure
5 35 (4.49%) Power Platform
6 20 (2.57%) Microsoft 365
7 19 (2.44%) Dynamics 365
8 18 (2.31%) PowerApps
9 13 (1.67%) Entra ID
9 13 (1.67%) SaaS
10 11 (1.41%) Azure DevOps
11 6 (0.77%) Power Automate
12 5 (0.64%) Azure Sentinel
12 5 (0.64%) PaaS
13 4 (0.51%) IaaS
13 4 (0.51%) OneDrive
13 4 (0.51%) Serverless
14 3 (0.39%) AWS Lambda
14 3 (0.39%) Microsoft Purview
14 3 (0.39%) OCI
Communications & Networking
1 269 (34.53%) VPN
2 262 (33.63%) Cisco IOS
3 33 (4.24%) Network Security
4 28 (3.59%) Firewall
5 8 (1.03%) Intrusion Detection
6 4 (0.51%) DNS
7 3 (0.39%) DHCP
8 2 (0.26%) Broadband
8 2 (0.26%) Internet
9 1 (0.13%) IPv4
9 1 (0.13%) IPv6
9 1 (0.13%) SD-WAN
9 1 (0.13%) Unified Communications
9 1 (0.13%) WAN
Database & Business Intelligence
1 60 (7.70%) PostgreSQL
2 55 (7.06%) Amazon Athena
2 55 (7.06%) Apache Arrow
2 55 (7.06%) Apache Iceberg
2 55 (7.06%) Dremio
3 25 (3.21%) Power BI
4 14 (1.80%) NoSQL
5 13 (1.67%) Tableau
6 11 (1.41%) Data Warehouse
7 8 (1.03%) Big Data
7 8 (1.03%) Data Lake
7 8 (1.03%) SQL Server
8 7 (0.90%) SQL Server Integration Services
9 6 (0.77%) Metadata
10 5 (0.64%) SQL Server Reporting Services
11 4 (0.51%) Metadata Repository
12 3 (0.39%) Relational Database
13 2 (0.26%) Amazon Redshift
13 2 (0.26%) Ataccama
13 2 (0.26%) MongoDB
Development Applications
1 28 (3.59%) JIRA
2 4 (0.51%) Git
3 1 (0.13%) GitLab
3 1 (0.13%) Jenkins
3 1 (0.13%) JUnit
3 1 (0.13%) Maven
3 1 (0.13%) Mockito
3 1 (0.13%) Oracle Forms
3 1 (0.13%) SonarQube
General
1 362 (46.47%) Analytical Skills
2 310 (39.79%) Inclusion and Diversity
3 270 (34.66%) Finance
4 202 (25.93%) Social Skills
5 72 (9.24%) Banking
5 72 (9.24%) Front Office
6 43 (5.52%) Legal
7 34 (4.36%) Public Sector
8 31 (3.98%) Marketing
9 24 (3.08%) Telecoms
10 23 (2.95%) Electronics
11 22 (2.82%) German Language
12 21 (2.70%) Manufacturing
13 19 (2.44%) Influencing Skills
14 18 (2.31%) Retail
15 15 (1.93%) Law
16 14 (1.80%) Organisational Skills
17 11 (1.41%) Tech for Good
18 10 (1.28%) Presentation Skills
19 9 (1.16%) Financial Institution
Job Titles
1 265 (34.02%) Infrastructure Engineer
2 78 (10.01%) Analyst
3 72 (9.24%) Developer
4 63 (8.09%) Software Engineer
5 62 (7.96%) Lead
6 59 (7.57%) Architect
7 56 (7.19%) AWS Engineer
8 55 (7.06%) AWS Developer
8 55 (7.06%) AWS Software Engineer
8 55 (7.06%) Developer/Software Engineer
9 43 (5.52%) Senior
10 37 (4.75%) Python Developer
10 37 (4.75%) Python Engineer
10 37 (4.75%) Python Software Engineer
11 33 (4.24%) Project Manager
12 28 (3.59%) Security Analyst
13 27 (3.47%) Security Specialist
14 24 (3.08%) Security Architect
15 22 (2.82%) Java Software Engineer
15 22 (2.82%) Solutions Architect
Libraries, Frameworks & Software Standards
1 262 (33.63%) Elastic Stack
2 57 (7.32%) AngularJS
2 57 (7.32%) Node.js
2 57 (7.32%) React
3 56 (7.19%) NumPy
3 56 (7.19%) Pandas
4 55 (7.06%) SciPy
4 55 (7.06%) Vue
5 22 (2.82%) SailPoint
6 14 (1.80%) .NET
7 9 (1.16%) REST
8 8 (1.03%) SOAP
9 7 (0.90%) Web Services
10 4 (0.51%) FIX Protocol
11 3 (0.39%) Kafka
12 2 (0.26%) EDI
12 2 (0.26%) JSON
12 2 (0.26%) Leaflet
12 2 (0.26%) Oracle Fusion
12 2 (0.26%) XML
Miscellaneous
1 265 (34.02%) Cyberattack
2 98 (12.58%) Management Information System
3 60 (7.70%) Foreign Exchange (FX)
4 55 (7.06%) Fixed Income
5 47 (6.03%) Equities
6 30 (3.85%) Product Ownership
7 28 (3.59%) Virtual Team
8 20 (2.57%) PMI
9 19 (2.44%) Security Posture
10 16 (2.05%) Market Risk
11 14 (1.80%) Credit Risk
12 13 (1.67%) Data Centre
12 13 (1.67%) Self-Motivation
13 12 (1.54%) Operational Technology
13 12 (1.54%) Public Cloud
14 11 (1.41%) Cloud Native
14 11 (1.41%) Derivative
14 11 (1.41%) Hybrid Cloud
15 10 (1.28%) Cyber Threat
16 9 (1.16%) Algorithms
Operating Systems
1 278 (35.69%) Windows
2 277 (35.56%) Linux
3 264 (33.89%) Android
4 7 (0.90%) zOS
5 4 (0.51%) Unix
6 2 (0.26%) Apple iOS
6 2 (0.26%) Windows Server
7 1 (0.13%) Windows Server 2016
7 1 (0.13%) Windows Server 2019
Processes & Methodologies
1 342 (43.90%) Problem-Solving
2 304 (39.02%) DevOps
3 288 (36.97%) Line Management
4 276 (35.43%) Mathematics
5 272 (34.92%) Infrastructure Engineering
6 267 (34.27%) Platform Engineering
7 264 (33.89%) Task Automation
8 263 (33.76%) Storage Management
9 183 (23.49%) Agile
10 126 (16.17%) Cybersecurity
11 114 (14.63%) Information Security
12 102 (13.09%) Project Management
13 93 (11.94%) Software Engineering
13 93 (11.94%) Stakeholder Management
14 89 (11.42%) Continuous Improvement
15 78 (10.01%) Risk Assessment
16 72 (9.24%) Fintech
17 65 (8.34%) Asset Management
18 62 (7.96%) Mentoring
19 57 (7.32%) Analytics
Programming Languages
1 329 (42.23%) Python
2 300 (38.51%) PowerShell
3 263 (33.76%) Bash
4 67 (8.60%) JavaScript
5 55 (7.06%) TypeScript
6 42 (5.39%) Java
7 34 (4.36%) SQL
8 12 (1.54%) C#
9 8 (1.03%) C++
10 6 (0.77%) R
11 2 (0.26%) Data Analysis Expressions
11 2 (0.26%) Kusto Query Language
11 2 (0.26%) Ruby
12 1 (0.13%) Bicep
12 1 (0.13%) C
12 1 (0.13%) JCL
12 1 (0.13%) Kotlin
12 1 (0.13%) PHP
12 1 (0.13%) T-SQL
Qualifications
1 105 (13.48%) Degree
2 63 (8.09%) Security Cleared
3 41 (5.26%) CISSP
4 33 (4.24%) CISM
4 33 (4.24%) PMI Certification
5 27 (3.47%) SC Cleared
6 21 (2.70%) DV Cleared
7 15 (1.93%) PMP
8 14 (1.80%) CRISC
9 13 (1.67%) Master's Degree
10 9 (1.16%) CISA
10 9 (1.16%) Computer Science Degree
10 9 (1.16%) SANS
11 8 (1.03%) ITIL Certification
11 8 (1.03%) PRINCE2 Practitioner
12 7 (0.90%) DBS Check
13 6 (0.77%) AWS Certification
14 5 (0.64%) CEH
14 5 (0.64%) CSPO
14 5 (0.64%) SSCP
Quality Assurance & Compliance
1 89 (11.42%) ISO/IEC 27001
2 63 (8.09%) NIST
3 35 (4.49%) GDPR
4 30 (3.85%) QA
5 26 (3.34%) GRC
6 23 (2.95%) NCSC
7 22 (2.82%) Accessibility
8 20 (2.57%) PCI DSS
9 15 (1.93%) Cyber Essentials
9 15 (1.93%) SOC 2
10 13 (1.67%) PMO
11 12 (1.54%) Data Quality
12 10 (1.28%) COBIT
12 10 (1.28%) NIST 800
13 9 (1.16%) Sarbanes-Oxley
14 8 (1.03%) Cyber Essentials PLUS
14 8 (1.03%) ISO/IEC 27002 (supersedes ISO/IEC 17799)
15 6 (0.77%) IFRS
16 5 (0.64%) JSP 440
17 4 (0.51%) Basel II
System Software
1 266 (34.15%) Docker
2 263 (33.76%) Hyper-V
3 262 (33.63%) VMware NSX
3 262 (33.63%) vSphere
4 30 (3.85%) Active Directory
5 1 (0.13%) Time Sharing Option
5 1 (0.13%) VMware Infrastructure
Systems Management
1 266 (34.15%) Terraform
2 264 (33.89%) Ansible
3 7 (0.90%) Kubernetes
4 6 (0.77%) Microsoft Intune
5 5 (0.64%) EMC NetWorker
6 4 (0.51%) RSA Archer
7 3 (0.39%) Jamf Pro
7 3 (0.39%) SCCM
8 2 (0.26%) Grafana
8 2 (0.26%) Host Intrusion Detection System
8 2 (0.26%) Prometheus
9 1 (0.13%) Istio
9 1 (0.13%) NetBackup
9 1 (0.13%) Single Sign-On
Vendors
1 266 (34.15%) Cisco
2 264 (33.89%) Splunk
3 262 (33.63%) 3PAR
3 262 (33.63%) Juniper
4 75 (9.63%) Microsoft
5 29 (3.72%) SAP
6 22 (2.82%) Salesforce
7 21 (2.70%) Okta
8 11 (1.41%) ServiceNow
9 8 (1.03%) Murex
10 7 (0.90%) IBM
10 7 (0.90%) Oracle
11 5 (0.64%) Ariba
12 3 (0.39%) NEC
12 3 (0.39%) Sage
12 3 (0.39%) VMware
13 2 (0.26%) Autodesk
13 2 (0.26%) Citrix
13 2 (0.26%) Google
13 2 (0.26%) Sophis