Adobe
UK

The table below provides summary statistics for permanent job vacancies requiring knowledge or experience of Adobe products and/or services. It includes a benchmarking guide to the annual salaries offered in vacancies that cited Adobe over the 6 months leading up to 11 May 2025, comparing them to the same period in the previous two years.

The figures below represent the IT labour market in general and are not representative of salaries within Adobe Systems, Inc.

6 months to
11 May 2025
Same period 2024 Same period 2023
Rank 237 315 298
Rank change year-on-year +78 -17 -66
Permanent jobs citing Adobe 732 915 1,220
As % of all permanent jobs advertised in the UK 1.34% 0.92% 1.21%
As % of the Vendors category 3.62% 2.52% 2.89%
Number of salaries quoted 199 663 600
10th Percentile £27,500 £25,000 £29,500
25th Percentile £36,250 £28,000 £37,500
Median annual salary (50th Percentile) £47,500 £38,000 £50,119
Median % change year-on-year +25.00% -24.18% -4.54%
75th Percentile £67,500 £50,000 £68,750
90th Percentile £77,500 £63,750 £87,550
UK excluding London median annual salary £45,000 £35,000 £45,000
% change year-on-year +28.57% -22.22% -

All Vendors
UK

Adobe falls under the Vendor Products and Services category. For comparison with the information above, the following table provides summary statistics for all permanent job vacancies requiring knowledge or experience of all vendor products and services.

Permanent vacancies with a requirement for knowledge or experience of vendor products and services 20,245 36,376 42,200
As % of all permanent jobs advertised in the UK 37.00% 36.66% 41.78%
Number of salaries quoted 11,996 24,993 24,141
10th Percentile £26,875 £26,700 £31,250
25th Percentile £37,500 £36,000 £41,250
Median annual salary (50th Percentile) £55,000 £50,000 £57,500
Median % change year-on-year +10.00% -13.04% +4.55%
75th Percentile £70,600 £68,750 £75,000
90th Percentile £90,000 £87,500 £92,500
UK excluding London median annual salary £50,000 £45,000 £50,000
% change year-on-year +11.11% -10.00% +5.26%

Adobe
Job Vacancy Trend

Job postings citing Adobe as a proportion of all IT jobs advertised.
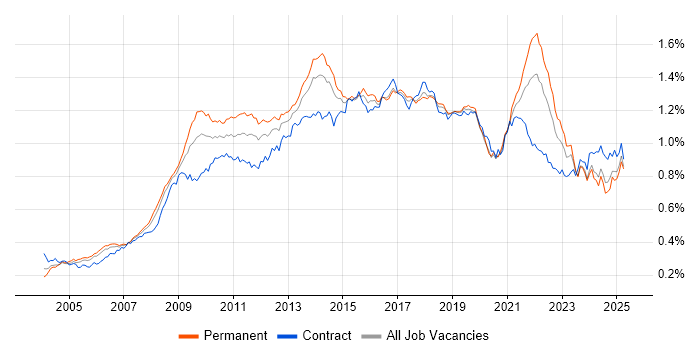
Job vacancy trend for Adobe in the UK

Adobe
Salary Trend

3-month moving average salary quoted in jobs citing Adobe.

Salary trend for Adobe in the UK

Adobe
Salary Histogram

Salary distribution for jobs citing Adobe over the 6 months to 11 May 2025.

Salary histogram for Adobe in the UK

Adobe
Top 16 Job Locations

The table below looks at the demand and provides a guide to the median salaries quoted in IT jobs citing Adobe within the UK over the 6 months to 11 May 2025. The 'Rank Change' column provides an indication of the change in demand within each location based on the same 6 month period last year.

Location Rank Change
on Same Period
Last Year
Matching
Permanent
IT Job Ads
Median Salary
Past 6 Months
Median Salary
% Change
on Same Period
Last Year
Live
Jobs
England +40 684 £47,500 +25.00% 736
UK excluding London +68 472 £45,000 +28.57% 418
Work from Home +98 367 £50,000 +31.58% 495
London +71 223 £50,000 - 417
South East +59 145 £39,000 +18.18% 161
Midlands +52 138 £37,500 - 56
North of England +15 134 £42,500 +21.43% 101
East Midlands +75 83 £37,500 +11.11% 18
Yorkshire +97 75 £37,500 +7.14% 35
West Midlands +19 55 £39,250 +3.29% 34
North West -78 46 £43,750 +16.67% 59
South West +78 23 £49,250 +40.71% 44
East of England +4 18 £55,000 +92.98% 38
North East +59 13 £42,500 +41.67% 8
Scotland +116 12 £85,253 +73.98% 17
Northern Ireland +38 2 - - 7

Adobe
Co-occurring Skills and Capabilities by Category

The follow tables expand on the table above by listing co-occurrences grouped by category. The same employment type, locality and period is covered with up to 20 co-occurrences shown in each of the following categories:

Application Platforms
1 36 (4.92%) CMS
2 23 (3.14%) WordPress
3 14 (1.91%) Adobe Experience Manager
3 14 (1.91%) Confluence
4 9 (1.23%) Drupal
4 9 (1.23%) Microsoft Exchange
5 8 (1.09%) IBM Domino
6 7 (0.96%) SharePoint
7 5 (0.68%) Apache Airflow
8 2 (0.27%) ArcGIS
8 2 (0.27%) ColdFusion
8 2 (0.27%) Headless CMS
8 2 (0.27%) IIS
8 2 (0.27%) Strapi
8 2 (0.27%) Umbraco
9 1 (0.14%) Apache
9 1 (0.14%) Oracle HTTP Server
9 1 (0.14%) SAS
9 1 (0.14%) Tomcat
9 1 (0.14%) WebLogic
Applications
1 84 (11.48%) Photoshop
2 82 (11.20%) Adobe Creative Suite
3 66 (9.02%) Adobe XD
4 65 (8.88%) Adobe Illustrator
5 53 (7.24%) Microsoft Office
6 47 (6.42%) InDesign
7 46 (6.28%) Sketch
8 41 (5.60%) Adobe Premiere
9 33 (4.51%) Adobe After Effects
10 22 (3.01%) Microsoft PowerPoint
11 20 (2.73%) Microsoft Excel
12 19 (2.60%) Final Cut Pro
13 17 (2.32%) Maya
14 16 (2.19%) Acrobat
15 9 (1.23%) CapCut
15 9 (1.23%) CINEMA 4D
15 9 (1.23%) InVision
16 8 (1.09%) Trello
17 7 (0.96%) Adobe Captivate
17 7 (0.96%) Blender
Business Applications
1 20 (2.73%) Magento
2 13 (1.78%) Adobe Campaign
2 13 (1.78%) Dynamics CRM
2 13 (1.78%) Shopify
3 10 (1.37%) Payment Gateway
4 9 (1.23%) NetSuite
5 5 (0.68%) CiviCRM
6 3 (0.41%) SAP CX
6 3 (0.41%) Sprinklr
Cloud Services
1 89 (12.16%) Figma
2 54 (7.38%) Adobe Analytics
3 48 (6.56%) Google Analytics
4 41 (5.60%) Canva
5 30 (4.10%) Adobe Creative Cloud
6 27 (3.69%) Microsoft 365
7 21 (2.87%) Salesforce Commerce Cloud
8 19 (2.60%) Azure
9 15 (2.05%) SaaS
10 14 (1.91%) Power Platform
11 12 (1.64%) AWS
12 11 (1.50%) Boomi
12 11 (1.50%) Google Drive
12 11 (1.50%) Google Workspace
13 10 (1.37%) GCP
14 9 (1.23%) Dropbox
14 9 (1.23%) Google Ads
15 7 (0.96%) Asana
16 6 (0.82%) Contentful
16 6 (0.82%) GitHub
Communications & Networking
1 15 (2.05%) Internet
2 10 (1.37%) Intranet
3 5 (0.68%) VPN
4 3 (0.41%) Wireless
5 2 (0.27%) Ethernet
5 2 (0.27%) Firewall
5 2 (0.27%) LAN
5 2 (0.27%) VoIP
5 2 (0.27%) WAN
6 1 (0.14%) Broadband
6 1 (0.14%) HTTP
6 1 (0.14%) Remote Desktop
6 1 (0.14%) SSL
6 1 (0.14%) TCP/IP
6 1 (0.14%) Wi-Fi
Database & Business Intelligence
1 40 (5.46%) Tableau
2 14 (1.91%) Power BI
3 11 (1.50%) Data Lake
3 11 (1.50%) MySQL
4 10 (1.37%) Relational Database
5 9 (1.23%) Metadata
6 6 (0.82%) SQL Server
7 4 (0.55%) Power Query
7 4 (0.55%) PowerPivot
8 3 (0.41%) Big Data
8 3 (0.41%) BigQuery
8 3 (0.41%) MS Access
9 2 (0.27%) Amazon RDS
9 2 (0.27%) Amazon Redshift
9 2 (0.27%) Data Warehouse
9 2 (0.27%) Tableau Desktop
10 1 (0.14%) DB2
10 1 (0.14%) Looker
10 1 (0.14%) PostgreSQL
10 1 (0.14%) Redis
Development Applications
1 16 (2.19%) JIRA
2 12 (1.64%) Axure RP
3 9 (1.23%) Git
4 7 (0.96%) Balsamiq
4 7 (0.96%) Cypress.io
4 7 (0.96%) webpack
5 6 (0.82%) Jenkins
6 4 (0.55%) InstallShield
7 2 (0.27%) AutoIt
7 2 (0.27%) MSI
7 2 (0.27%) Visual Studio Code
7 2 (0.27%) Vite
8 1 (0.14%) Browser DevTools
8 1 (0.14%) CircleCI
8 1 (0.14%) Crashlytics
8 1 (0.14%) fastlane
8 1 (0.14%) GitLab
8 1 (0.14%) rollup.js
8 1 (0.14%) Travis CI
8 1 (0.14%) Visual Studio
General
1 365 (49.86%) Retail
2 300 (40.98%) Manufacturing
3 206 (28.14%) Social Skills
4 171 (23.36%) Marketing
5 98 (13.39%) Dutch Language
5 98 (13.39%) Finnish Language
5 98 (13.39%) Norwegian Language
6 97 (13.25%) Analytical Skills
7 69 (9.43%) Finance
8 60 (8.20%) Law
9 59 (8.06%) Inclusion and Diversity
10 41 (5.60%) Presentation Skills
11 32 (4.37%) Games
12 24 (3.28%) Legal
13 21 (2.87%) Advertising
14 20 (2.73%) Multimedia
15 18 (2.46%) Public Sector
16 17 (2.32%) Banking
16 17 (2.32%) Organisational Skills
17 7 (0.96%) Retail Banking
Job Titles
1 295 (40.30%) Trainer
2 83 (11.34%) Designer
3 68 (9.29%) Senior
4 64 (8.74%) Developer
5 40 (5.46%) Lead
6 31 (4.23%) Analyst
7 28 (3.83%) UX Designer
8 21 (2.87%) Architect
9 19 (2.60%) Front-End Developer (Client-Side Developer)
9 19 (2.60%) Senior Developer
10 17 (2.32%) Consultant
11 16 (2.19%) Junior
12 15 (2.05%) UI Designer
12 15 (2.05%) UI/UX Designer
13 14 (1.91%) Data Analyst
13 14 (1.91%) Data Scientist
13 14 (1.91%) Senior Architect
13 14 (1.91%) Senior Data Scientist
13 14 (1.91%) Senior Designer
14 13 (1.78%) Data Insight Analyst
Libraries, Frameworks & Software Standards
1 92 (12.57%) HTML
2 85 (11.61%) CSS
3 17 (2.32%) React
4 14 (1.91%) Sass
5 13 (1.78%) Vue
6 11 (1.50%) XML
7 10 (1.37%) Node.js
8 9 (1.23%) AngularJS
8 9 (1.23%) HTML5
9 7 (0.96%) .NET
9 7 (0.96%) Enzyme
9 7 (0.96%) Jest
9 7 (0.96%) jQuery
10 6 (0.82%) ATL
10 6 (0.82%) EDI
11 5 (0.68%) Laravel
11 5 (0.68%) NumPy
11 5 (0.68%) Pandas
11 5 (0.68%) Redux
12 4 (0.55%) Lightning Web Components
Miscellaneous
1 297 (40.57%) Robotics
2 93 (12.70%) Social Media
3 39 (5.33%) Graphic Design
4 31 (4.23%) Video Editing
5 26 (3.55%) Analytical Mindset
6 24 (3.28%) Self-Motivation
7 23 (3.14%) Animation
8 18 (2.46%) Digital Media
9 15 (2.05%) e-Learning
10 14 (1.91%) Algorithms
11 13 (1.78%) Blog
11 13 (1.78%) Mobile App
12 12 (1.64%) Product Ownership
13 11 (1.50%) Cloud Native
13 11 (1.50%) Enterprise Software
13 11 (1.50%) Motion Graphics
13 11 (1.50%) Photography
14 10 (1.37%) Marketing Technology
15 9 (1.23%) Data Protection Act
15 9 (1.23%) Digital Signage
Operating Systems
1 28 (3.83%) Windows
2 12 (1.64%) Windows 10
3 5 (0.68%) Mac OS X
4 3 (0.41%) Apple iOS
5 2 (0.27%) Linux
6 1 (0.14%) Android
Processes & Methodologies
1 415 (56.69%) Problem-Solving
2 325 (44.40%) Artificial Intelligence
3 300 (40.98%) Machine Learning
4 297 (40.57%) Generative AI
5 294 (40.16%) LLM
5 294 (40.16%) Red Team
6 200 (27.32%) Data Privacy
7 123 (16.80%) User Experience
8 117 (15.98%) Analytics
9 81 (11.07%) UX Design
10 60 (8.20%) Storytelling
11 59 (8.06%) E-Commerce
12 58 (7.92%) Agile
13 54 (7.38%) Project Management
14 52 (7.10%) CRM
14 52 (7.10%) Digital Marketing
15 49 (6.69%) Wireframes
16 48 (6.56%) Mathematics
17 47 (6.42%) Customer Experience
18 45 (6.15%) Mentoring
Programming Languages
1 89 (12.16%) JavaScript
2 52 (7.10%) SQL
3 45 (6.15%) Python
4 23 (3.14%) PHP
5 11 (1.50%) TypeScript
6 8 (1.09%) Java
7 6 (0.82%) C#
7 6 (0.82%) PowerShell
7 6 (0.82%) R
8 4 (0.55%) Apex Code
9 2 (0.27%) VB
10 1 (0.14%) C++
10 1 (0.14%) Kotlin
10 1 (0.14%) Swift
Qualifications
1 399 (54.51%) Degree
2 28 (3.83%) Master's Degree
3 14 (1.91%) DBS Check
4 9 (1.23%) Security Cleared
5 8 (1.09%) Computer Science Degree
5 8 (1.09%) Microsoft Certification
5 8 (1.09%) SC Cleared
6 6 (0.82%) PMI Certification
7 4 (0.55%) HNC
7 4 (0.55%) HND
7 4 (0.55%) Postgraduate
8 3 (0.41%) ITIL Certification
8 3 (0.41%) PMP
9 1 (0.14%) AWS Certification
9 1 (0.14%) PhD
Quality Assurance & Compliance
1 56 (7.65%) Accessibility
2 20 (2.73%) GDPR
3 18 (2.46%) QA
4 15 (2.05%) WCAG
5 12 (1.64%) PCI DSS
6 11 (1.50%) ISO/IEC 27001
7 9 (1.23%) Cyber Essentials
7 9 (1.23%) PERC
8 4 (0.55%) SLA
9 2 (0.27%) ISO 9001
10 1 (0.14%) Actionable Recommendations
System Software
1 11 (1.50%) Docker
2 10 (1.37%) Active Directory
3 7 (0.96%) Virtual Desktop
4 2 (0.27%) Microsoft App-V
5 1 (0.14%) Varnish
5 1 (0.14%) VMware Infrastructure
Systems Management
1 13 (1.78%) Kubernetes
2 8 (1.09%) Jamf Pro
3 6 (0.82%) SCCM
4 2 (0.27%) Active Directory Federation Services
4 2 (0.27%) Marathon
5 1 (0.14%) Single Sign-On
5 1 (0.14%) Terraform
Vendors
1 395 (53.96%) Google
2 294 (40.16%) Databricks
3 93 (12.70%) Microsoft
4 38 (5.19%) Salesforce
5 24 (3.28%) TikTok
6 20 (2.73%) Marketo
7 16 (2.19%) Facebook
7 16 (2.19%) Instagram
7 16 (2.19%) Oracle
8 14 (1.91%) Apple
8 14 (1.91%) Salesforce Marketing Cloud
8 14 (1.91%) YouTube
9 12 (1.64%) SAP
10 11 (1.50%) Dell
10 11 (1.50%) MuleSoft
11 10 (1.37%) New Relic
12 9 (1.23%) OneTrust
13 8 (1.09%) iManage
13 8 (1.09%) ServiceNow
14 7 (0.96%) Omniture