ERP Jobs with Hybrid/Remote/WFH Options

Enterprise Resource Planning (ERP)
UK > Work from Home

The table below provides summary statistics for permanent remote or hybrid work requiring ERP skills. It includes a benchmarking guide to the annual salaries offered in vacancies that cited ERP over the 6 months leading up to 16 May 2025, comparing them to the same period in the previous two years.

6 months to
16 May 2025
Same period 2024 Same period 2023
Rank 177 84 162
Rank change year-on-year -93 +78 +43
Permanent jobs citing ERP 370 1,205 911
As % of all permanent jobs with a WFH option 2.02% 3.57% 2.24%
As % of the Processes & Methodologies category 2.15% 3.91% 2.33%
Number of salaries quoted 265 735 667
10th Percentile £39,000 £35,000 £36,250
25th Percentile £46,250 £42,500 £43,750
Median annual salary (50th Percentile) £60,000 £60,000 £60,000
Median % change year-on-year - - +5.26%
75th Percentile £77,500 £73,413 £73,750
90th Percentile £88,250 £91,250 £91,250
UK median annual salary £55,000 £54,000 £60,000
% change year-on-year +1.85% -10.00% +9.09%

All Process and Methodology Skills
Work from Home

ERP falls under the Processes and Methodologies category. For comparison with the information above, the following table provides summary statistics for all permanent job vacancies with remote or hybrid options requiring process or methodology skills.

Permanent vacancies with a requirement for process or methodology skills 17,249 30,823 39,093
As % of all permanent jobs with a WFH option 94.20% 91.36% 96.08%
Number of salaries quoted 9,742 23,354 27,124
10th Percentile £28,500 £33,750 £37,500
25th Percentile £42,500 £42,500 £47,500
Median annual salary (50th Percentile) £60,000 £57,500 £62,500
Median % change year-on-year +4.35% -8.00% +4.17%
75th Percentile £77,500 £75,000 £82,500
90th Percentile £101,250 £95,000 £100,000
UK median annual salary £57,500 £55,000 £61,180
% change year-on-year +4.55% -10.10% +1.97%

ERP
Trend for Jobs with a WFH Option

Job vacancies with remote working options citing ERP as a proportion of all IT jobs advertised.
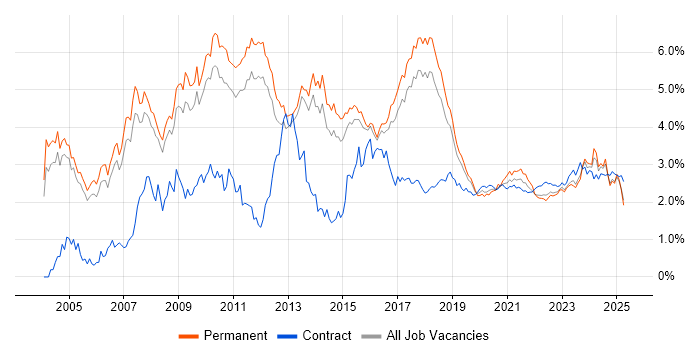
ERP trend for jobs with Hybrid/Remote/WFH options

ERP
Salary Trend for Jobs with a WFH Option

3-month moving average salary quoted in job vacancies with remote working options citing ERP.

ERP salary trend for jobs with a WFH option

ERP
Salary Histogram for Jobs with a WFH Option

Salary distribution for jobs with remote working options citing ERP over the 6 months to 16 May 2025.

ERP salary histogram for jobs with a WFH option

ERP
Co-occurring Skills and Capabilities with WFH Options by Category

The follow tables expand on the table above by listing co-occurrences grouped by category. The same employment type, locality and period is covered with up to 20 co-occurrences shown in each of the following categories:

Application Platforms
1 17 (4.59%) SharePoint
2 3 (0.81%) Confluence
2 3 (0.81%) Microsoft Exchange
2 3 (0.81%) OpenEdge
3 2 (0.54%) Apache
3 2 (0.54%) Apache Spark
3 2 (0.54%) Oracle Workflow
Applications
1 49 (13.24%) Microsoft Excel
2 10 (2.70%) Microsoft Office
3 9 (2.43%) Microsoft PowerPoint
4 3 (0.81%) Microsoft Project
5 2 (0.54%) Oracle Smart View
5 2 (0.54%) Spreadsheet
6 1 (0.27%) MS Visio
Business Applications
1 38 (10.27%) NetSuite
2 24 (6.49%) Oracle ERP
3 19 (5.14%) Dynamics CRM
4 14 (3.78%) Magento
4 14 (3.78%) Shopify
5 13 (3.51%) Dynamics NAV
6 11 (2.97%) JDE OneWorld
6 11 (2.97%) SAP S/4HANA
7 10 (2.70%) Dynamics AX
8 9 (2.43%) Infor CloudSuite
8 9 (2.43%) Infor CloudSuite Industrial (formerly SyteLine)
8 9 (2.43%) Oracle Payables
8 9 (2.43%) Oracle Receivables
8 9 (2.43%) Sage 200
9 8 (2.16%) Infor M3
9 8 (2.16%) Oracle EBS
9 8 (2.16%) Oracle Financials
9 8 (2.16%) Sage CRM
10 5 (1.35%) SAP ERP
11 4 (1.08%) Oracle General Ledger
Cloud Services
1 68 (18.38%) Power Platform
2 49 (13.24%) Dynamics 365
3 40 (10.81%) Azure
4 26 (7.03%) SaaS
5 22 (5.95%) AWS
6 18 (4.86%) Microsoft 365
7 14 (3.78%) BigCommerce
7 14 (3.78%) OCI
8 13 (3.51%) Boomi
9 8 (2.16%) Azure Data Factory
9 8 (2.16%) Azure DevOps
9 8 (2.16%) PowerApps
10 6 (1.62%) DigitalOcean
10 6 (1.62%) GCP
10 6 (1.62%) Power Automate
11 4 (1.08%) Cloud Computing
11 4 (1.08%) OneDrive
12 3 (0.81%) Apigee
12 3 (0.81%) Entra ID
12 3 (0.81%) Mimecast
Communications & Networking
1 7 (1.89%) VPN
2 5 (1.35%) Network Security
3 4 (1.08%) DNS
4 3 (0.81%) DHCP
4 3 (0.81%) Firewall
4 3 (0.81%) IPv4
4 3 (0.81%) VLAN
5 2 (0.54%) IPsec
6 1 (0.27%) HTTP
6 1 (0.27%) Internet
6 1 (0.27%) LAN
6 1 (0.27%) PSTN
6 1 (0.27%) SSL
6 1 (0.27%) VoIP
6 1 (0.27%) WAN
Database & Business Intelligence
1 62 (16.76%) Power BI
2 26 (7.03%) SQL Server
3 17 (4.59%) Data Warehouse
4 12 (3.24%) Data Lake
5 10 (2.70%) SQL Server Reporting Services
6 8 (2.16%) Oracle Database
7 7 (1.89%) Crystal Reports
8 6 (1.62%) Oracle Reports
9 4 (1.08%) Data Hub
9 4 (1.08%) Metadata
9 4 (1.08%) Metadata Repository
9 4 (1.08%) SQL Server Integration Services
10 3 (0.81%) Azure SQL Data Warehouse
10 3 (0.81%) Tableau
11 2 (0.54%) Amazon Redshift
11 2 (0.54%) Big Data
11 2 (0.54%) BigQuery
11 2 (0.54%) Hadoop
11 2 (0.54%) Oracle BI Publisher
11 2 (0.54%) Relational Database
Development Applications
1 8 (2.16%) JIRA
2 6 (1.62%) Git
3 4 (1.08%) Oracle Forms
4 3 (0.81%) Postman
5 2 (0.54%) IBM UrbanCode
5 2 (0.54%) Jenkins
5 2 (0.54%) LSMW
6 1 (0.27%) Subversion
General
1 183 (49.46%) Finance
2 144 (38.92%) Social Skills
3 80 (21.62%) Manufacturing
4 59 (15.95%) Analytical Skills
5 40 (10.81%) Retail
6 30 (8.11%) Inclusion and Diversity
7 19 (5.14%) Marketing
8 18 (4.86%) Organisational Skills
9 15 (4.05%) Law
10 11 (2.97%) Legal
11 10 (2.70%) General Ledger
12 7 (1.89%) Back Office
12 7 (1.89%) Presentation Skills
12 7 (1.89%) Public Sector
13 6 (1.62%) Aerospace
14 5 (1.35%) Aviation
14 5 (1.35%) Billing
14 5 (1.35%) Documentation Skills
15 4 (1.08%) Advertising
15 4 (1.08%) Banking
Job Titles
1 91 (24.59%) Analyst
2 53 (14.32%) Developer
3 35 (9.46%) Consultant
4 31 (8.38%) Data Analyst
5 29 (7.84%) Senior
6 27 (7.30%) ERP Manager
7 26 (7.03%) Procurement Analyst
8 24 (6.49%) Project Manager
9 21 (5.68%) Lead
10 19 (5.14%) ERP Analyst
11 18 (4.86%) Software Developer
12 17 (4.59%) Business Analyst
12 17 (4.59%) Support Manager
13 16 (4.32%) Architect
13 16 (4.32%) IT Manager
14 12 (3.24%) Applications Support
14 12 (3.24%) NetSuite Developer
14 12 (3.24%) Senior Manager
15 11 (2.97%) Senior Project Manager
16 9 (2.43%) Business Intelligence Analyst
Libraries, Frameworks & Software Standards
1 20 (5.41%) Oracle Fusion
2 19 (5.14%) HTML
3 18 (4.86%) Web Services
4 17 (4.59%) .NET
4 17 (4.59%) REST
4 17 (4.59%) SOAP
5 14 (3.78%) JSON
5 14 (3.78%) XML
6 12 (3.24%) CSS
7 11 (2.97%) CSS3
7 11 (2.97%) Hibernate
7 11 (2.97%) jQuery
8 8 (2.16%) EDI
9 4 (1.08%) OAuth
10 3 (0.81%) JWT
10 3 (0.81%) Kafka
10 3 (0.81%) Middleware
10 3 (0.81%) OAuth2
10 3 (0.81%) RESTful
10 3 (0.81%) Swagger
Miscellaneous
1 33 (8.92%) Management Information System
2 20 (5.41%) EPoS
3 15 (4.05%) Self-Motivation
4 11 (2.97%) FMCG
5 10 (2.70%) Enterprise Software
5 10 (2.70%) Onboarding
6 9 (2.43%) Legacy Systems
6 9 (2.43%) Virtual Team
7 8 (2.16%) Product Ownership
8 7 (1.89%) Mobile App
9 6 (1.62%) Driving Licence
9 6 (1.62%) PMI
10 5 (1.35%) IoT
11 3 (0.81%) Analytical Mindset
12 2 (0.54%) Cloud Native
12 2 (0.54%) Cyber Threat
12 2 (0.54%) Housing Association
12 2 (0.54%) Hybrid Cloud
12 2 (0.54%) Legacy Applications
12 2 (0.54%) Linux Command Line
Operating Systems
1 11 (2.97%) Windows
2 6 (1.62%) Windows Server
3 5 (1.35%) Linux
4 3 (0.81%) Apple iOS
5 2 (0.54%) Oracle Linux
5 2 (0.54%) Unix
Processes & Methodologies
1 91 (24.59%) Problem-Solving
2 74 (20.00%) CRM
3 70 (18.92%) Process Improvement
4 69 (18.65%) Project Management
5 68 (18.38%) Analytics
6 64 (17.30%) Business Intelligence
7 53 (14.32%) Data Management
8 47 (12.70%) Migration
9 46 (12.43%) Continuous Improvement
10 41 (11.08%) Agile
10 41 (11.08%) Data Analysis
11 40 (10.81%) Data Analytics
11 40 (10.81%) Requirements Gathering
12 37 (10.00%) Logistics
13 35 (9.46%) Visualisation
14 34 (9.19%) Mentoring
15 32 (8.65%) Customer Service
15 32 (8.65%) Stakeholder Management
16 30 (8.11%) E-Commerce
17 28 (7.57%) Economics
Programming Languages
1 88 (23.78%) SQL
2 24 (6.49%) JavaScript
3 13 (3.51%) C#
4 7 (1.89%) T-SQL
5 6 (1.62%) Delphi
5 6 (1.62%) PL/SQL
5 6 (1.62%) Python
6 5 (1.35%) Java
6 5 (1.35%) VB.NET
7 3 (0.81%) OpenEdge ABL
7 3 (0.81%) PowerShell
7 3 (0.81%) Progress 4GL
8 1 (0.27%) ABAP
8 1 (0.27%) Groovy
8 1 (0.27%) SAPscript
8 1 (0.27%) VB
8 1 (0.27%) VBA
8 1 (0.27%) X++
Qualifications
1 82 (22.16%) Degree
2 14 (3.78%) PMI Certification
2 14 (3.78%) PMP
2 14 (3.78%) Security Cleared
3 11 (2.97%) Computer Science Degree
3 11 (2.97%) SC Cleared
4 10 (2.70%) ACCA
4 10 (2.70%) CIMA
4 10 (2.70%) Master's Degree
5 9 (2.43%) HNC
6 8 (2.16%) Microsoft Certification
7 4 (1.08%) MCP
8 2 (0.54%) CISM
8 2 (0.54%) CISSP
8 2 (0.54%) CTC Cleared
8 2 (0.54%) GIAC
8 2 (0.54%) ITIL Certification
8 2 (0.54%) MCSE
8 2 (0.54%) Oracle Certification
8 2 (0.54%) PgMP
Quality Assurance & Compliance
1 32 (8.65%) Data Quality
2 15 (4.05%) Accessibility
3 6 (1.62%) GxP
4 5 (1.35%) QA
5 2 (0.54%) COBIT
5 2 (0.54%) Cyber Essentials
5 2 (0.54%) Cyber Essentials PLUS
5 2 (0.54%) GAAP
5 2 (0.54%) GDPR
5 2 (0.54%) IFRS
5 2 (0.54%) ISO/IEC 27001
5 2 (0.54%) NIST
5 2 (0.54%) PCI DSS
5 2 (0.54%) PMO
5 2 (0.54%) SOC 2
6 1 (0.27%) ITGC
6 1 (0.27%) SLA
System Software
1 6 (1.62%) Active Directory
2 2 (0.54%) Docker
2 2 (0.54%) Hyper-V
3 1 (0.27%) VMware ESXi
Systems Management
1 2 (0.54%) Ansible
1 2 (0.54%) Single Sign-On
1 2 (0.54%) Terraform
2 1 (0.27%) Kubernetes
2 1 (0.27%) Microsoft Intune
2 1 (0.27%) Systems Management Server (SMS)
Vendors
1 89 (24.05%) Microsoft
1 89 (24.05%) SAP
2 57 (15.41%) Oracle
3 21 (5.68%) Infor
4 20 (5.41%) Salesforce
5 11 (2.97%) Dell
5 11 (2.97%) JD Edwards
5 11 (2.97%) PeopleSoft
5 11 (2.97%) Sage
6 8 (2.16%) Workday
7 6 (1.62%) Informatica
8 4 (1.08%) Google
8 4 (1.08%) Hyperion
8 4 (1.08%) IBM
9 3 (0.81%) Concur
9 3 (0.81%) Epicor
9 3 (0.81%) IFS
9 3 (0.81%) Progress
10 2 (0.54%) Cisco
10 2 (0.54%) Databricks