Service Delivery Jobs with Hybrid/Remote/WFH Options

Service Delivery
UK > Work from Home

The table below provides summary statistics for permanent remote or hybrid work requiring Service Delivery skills. It includes a benchmarking guide to the annual salaries offered in vacancies that cited Service Delivery over the 6 months leading up to 30 May 2025, comparing them to the same period in the previous two years.

6 months to
30 May 2025
Same period 2024 Same period 2023
Rank 165 112 144
Rank change year-on-year -53 +32 +30
Permanent jobs citing Service Delivery 404 913 990
As % of all permanent jobs with a WFH option 2.14% 2.65% 2.50%
As % of the Processes & Methodologies category 2.28% 2.93% 2.60%
Number of salaries quoted 229 593 697
10th Percentile £29,880 £32,500 £28,125
25th Percentile £42,750 £41,250 £41,250
Median annual salary (50th Percentile) £58,000 £55,000 £55,000
Median % change year-on-year +5.45% - -
75th Percentile £68,750 £66,000 £75,000
90th Percentile £77,500 £80,000 £95,000
UK median annual salary £55,000 £50,000 £52,500
% change year-on-year +10.00% -4.76% +5.00%

All Process and Methodology Skills
Work from Home

Service Delivery falls under the Processes and Methodologies category. For comparison with the information above, the following table provides summary statistics for all permanent job vacancies with remote or hybrid options requiring process or methodology skills.

Permanent vacancies with a requirement for process or methodology skills 17,749 31,137 38,086
As % of all permanent jobs with a WFH option 93.99% 90.42% 96.09%
Number of salaries quoted 9,374 23,468 26,396
10th Percentile £27,000 £33,750 £37,500
25th Percentile £42,500 £42,500 £47,500
Median annual salary (50th Percentile) £57,500 £57,500 £62,871
Median % change year-on-year - -8.54% +4.79%
75th Percentile £76,840 £75,000 £82,500
90th Percentile £100,000 £95,000 £100,000
UK median annual salary £57,443 £55,000 £60,899
% change year-on-year +4.44% -9.69% +1.50%

Service Delivery
Trend for Jobs with a WFH Option

Job vacancies with remote working options citing Service Delivery as a proportion of all IT jobs advertised.
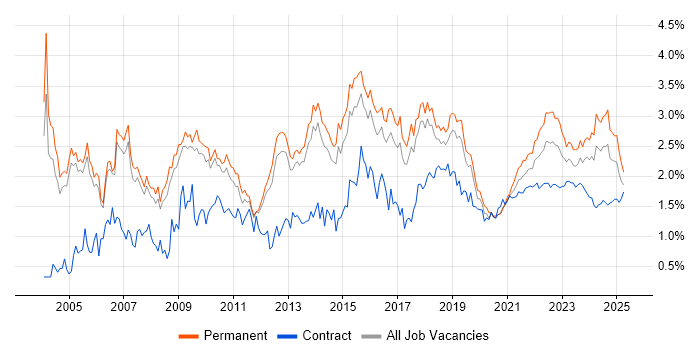
Service Delivery trend for jobs with Hybrid/Remote/WFH options

Service Delivery
Salary Trend for Jobs with a WFH Option

3-month moving average salary quoted in job vacancies with remote working options citing Service Delivery.

Service Delivery salary trend for jobs with a WFH option

Service Delivery
Salary Histogram for Jobs with a WFH Option

Salary distribution for jobs with remote working options citing Service Delivery over the 6 months to 30 May 2025.

Service Delivery salary histogram for jobs with a WFH option

Service Delivery
Co-occurring Skills and Capabilities with WFH Options by Category

The follow tables expand on the table above by listing co-occurrences grouped by category. The same employment type, locality and period is covered with up to 20 co-occurrences shown in each of the following categories:

Application Platforms
1 21 (5.20%) SharePoint
2 7 (1.73%) Microsoft Exchange
3 4 (0.99%) CMS
3 4 (0.99%) Headless CMS
4 3 (0.74%) nginx
5 1 (0.25%) NetWeaver
5 1 (0.25%) Tomcat
5 1 (0.25%) Umbraco
5 1 (0.25%) WordPress
Applications
1 30 (7.43%) Microsoft Excel
2 26 (6.44%) Microsoft Office
3 23 (5.69%) Microsoft PowerPoint
4 5 (1.24%) Spreadsheet
4 5 (1.24%) Stata
5 4 (0.99%) Microsoft Project
6 1 (0.25%) Camtasia
Business Applications
1 7 (1.73%) Salesforce CRM
2 6 (1.49%) Dynamics CRM
3 5 (1.24%) Shopify
4 2 (0.50%) Infor M3
5 1 (0.25%) CiviCRM
5 1 (0.25%) Dynamics GP
5 1 (0.25%) Dynamics NAV
5 1 (0.25%) Elite 3E
5 1 (0.25%) Oracle Subledger Accounting
5 1 (0.25%) Orchard Housing
5 1 (0.25%) Remedy ITSM
5 1 (0.25%) Sage 200
5 1 (0.25%) SAP S/4HANA
Cloud Services
1 110 (27.23%) Azure
2 56 (13.86%) Power Platform
3 51 (12.62%) Microsoft 365
4 35 (8.66%) AWS
5 27 (6.68%) Dynamics 365
6 26 (6.44%) Entra ID
7 16 (3.96%) Azure DevOps
7 16 (3.96%) PowerApps
8 13 (3.22%) Azure Monitor
9 11 (2.72%) SaaS
10 7 (1.73%) Azure Data Factory
10 7 (1.73%) Azure Logic Apps
10 7 (1.73%) Microsoft Copilot
10 7 (1.73%) Power Automate
11 6 (1.49%) GCP
11 6 (1.49%) OneDrive
12 4 (0.99%) IaaS
12 4 (0.99%) PaaS
12 4 (0.99%) Serverless
12 4 (0.99%) SuccessFactors
Communications & Networking
1 85 (21.04%) Broadband
2 18 (4.46%) Wireless
3 16 (3.96%) WAN
4 15 (3.71%) LAN
5 14 (3.47%) Network Security
6 13 (3.22%) Firewall
7 10 (2.48%) DNS
7 10 (2.48%) WLAN
8 7 (1.73%) DHCP
8 7 (1.73%) TCP/IP
8 7 (1.73%) VPN
9 5 (1.24%) Wi-Fi
10 3 (0.74%) Intrusion Detection
11 2 (0.50%) SNMP
11 2 (0.50%) VLAN
11 2 (0.50%) Wireless Security
12 1 (0.25%) Cisco ISE
12 1 (0.25%) GSM
12 1 (0.25%) NetScaler
12 1 (0.25%) VoIP
Database & Business Intelligence
1 31 (7.67%) Power BI
2 20 (4.95%) Data Mining
2 20 (4.95%) SQL Server
3 19 (4.70%) BusinessObjects
4 16 (3.96%) SQL Server Integration Services
5 10 (2.48%) SQL Server Reporting Services
6 9 (2.23%) DB2
6 9 (2.23%) Relational Database
7 8 (1.98%) Data Warehouse
8 5 (1.24%) Microsoft Analysis Services
8 5 (1.24%) SQL Server Analysis Services
9 3 (0.74%) Amazon RDS
9 3 (0.74%) MariaDB
10 2 (0.50%) Elasticsearch
10 2 (0.50%) PostgreSQL
10 2 (0.50%) Tableau
11 1 (0.25%) Electronic Patient Records
11 1 (0.25%) SAP BW
11 1 (0.25%) SAP Data Services
11 1 (0.25%) SAP HANA
Development Applications
1 10 (2.48%) JIRA
1 10 (2.48%) Visual Studio
2 7 (1.73%) SQL Server Management Studio (SSMS)
3 2 (0.50%) GitLab
4 1 (0.25%) Git
4 1 (0.25%) Oracle Forms
General
1 220 (54.46%) Social Skills
2 83 (20.54%) Games
3 54 (13.37%) Finance
4 48 (11.88%) Analytical Skills
5 42 (10.40%) Retail
6 33 (8.17%) Public Sector
7 25 (6.19%) Inclusion and Diversity
8 21 (5.20%) Legal
9 18 (4.46%) Law
10 13 (3.22%) Marketing
11 12 (2.97%) Pharmaceutical
12 10 (2.48%) Tech for Good
13 9 (2.23%) Presentation Skills
14 8 (1.98%) Telecoms
15 5 (1.24%) Organisational Skills
16 4 (0.99%) Advertising
16 4 (0.99%) Influencing Skills
17 3 (0.74%) Back Office
17 3 (0.74%) Banking
18 2 (0.50%) Military
Job Titles
1 100 (24.75%) Senior
2 79 (19.55%) Engineering Manager
2 79 (19.55%) ServiceNow Manager
3 78 (19.31%) Senior Manager
3 78 (19.31%) Senior Service Manager
4 40 (9.90%) Analyst
4 40 (9.90%) Lead
5 37 (9.16%) IT Manager
6 34 (8.42%) IT Support
7 28 (6.93%) Consultant
7 28 (6.93%) Developer
7 28 (6.93%) Service Manager
8 23 (5.69%) Support Analyst
9 18 (4.46%) Junior
9 18 (4.46%) Junior Developer
10 17 (4.21%) 1st Line Support
11 14 (3.47%) Applications Manager
11 14 (3.47%) IT Analyst
11 14 (3.47%) Support Manager
12 13 (3.22%) IT Services Manager
Libraries, Frameworks & Software Standards
1 24 (5.94%) .NET
2 13 (3.22%) .NET Framework
3 11 (2.72%) Web Services
4 9 (2.23%) ASP.NET
5 5 (1.24%) React
6 4 (0.99%) Django
6 4 (0.99%) Express.js
6 4 (0.99%) Flask
6 4 (0.99%) MACH
6 4 (0.99%) Next.js
6 4 (0.99%) Node.js
6 4 (0.99%) REST
7 3 (0.74%) ASP.NET Web API
7 3 (0.74%) Entity Framework
7 3 (0.74%) HTML
7 3 (0.74%) Lambda Expressions
7 3 (0.74%) LINQ
8 2 (0.50%) CSS
8 2 (0.50%) XML
9 1 (0.25%) EDI
Miscellaneous
1 112 (27.72%) Management Information System
2 84 (20.79%) Product Ownership
3 79 (19.55%) Video\Live Streaming
4 18 (4.46%) Data Structures
4 18 (4.46%) Self-Motivation
5 14 (3.47%) Onboarding
6 12 (2.97%) EPoS
7 11 (2.72%) Driving Licence
8 8 (1.98%) CMDB
9 7 (1.73%) NHS
10 6 (1.49%) Enterprise Software
10 6 (1.49%) Virtual Team
11 5 (1.24%) Legacy Systems
11 5 (1.24%) Microsoft Licensing
12 4 (0.99%) Data Centre
12 4 (0.99%) Hackathon
12 4 (0.99%) Mobile Games
12 4 (0.99%) Security Posture
12 4 (0.99%) Tandem
13 3 (0.74%) Analytical Mindset
Operating Systems
1 43 (10.64%) Windows
2 13 (3.22%) Windows 10
3 12 (2.97%) Mac OS
4 11 (2.72%) Apple iOS
5 6 (1.49%) Windows Server
6 4 (0.99%) Linux
7 3 (0.74%) VMS
8 2 (0.50%) Android
9 1 (0.25%) AIX
9 1 (0.25%) Red Hat Enterprise Linux
9 1 (0.25%) Unix
Processes & Methodologies
1 146 (36.14%) Change Management
2 125 (30.94%) ITSM
3 120 (29.70%) Problem Management
4 105 (25.99%) Incident Management
5 102 (25.25%) Roadmaps
6 100 (24.75%) Computer Science
7 98 (24.26%) Software Engineering
8 92 (22.77%) ITIL
9 79 (19.55%) Deployment Automation
9 79 (19.55%) Software Delivery
9 79 (19.55%) Validation
10 78 (19.31%) Problem-Solving
11 71 (17.57%) Service Management
12 64 (15.84%) Continuous Improvement
13 60 (14.85%) Customer Service
14 50 (12.38%) Mentoring
15 46 (11.39%) Coaching
16 44 (10.89%) Agile
17 42 (10.40%) DevOps
18 38 (9.41%) CRM
Programming Languages
1 51 (12.62%) SQL
2 21 (5.20%) C#
3 18 (4.46%) VBA
4 12 (2.97%) Python
5 10 (2.48%) T-SQL
6 9 (2.23%) PL/SQL
6 9 (2.23%) VB.NET
7 8 (1.98%) PowerShell
8 6 (1.49%) R
9 2 (0.50%) Java
10 1 (0.25%) ABAP
10 1 (0.25%) Bicep
10 1 (0.25%) C
10 1 (0.25%) JavaScript
Qualifications
1 141 (34.90%) Degree
2 85 (21.04%) Computer Science Degree
3 14 (3.47%) ITIL Certification
3 14 (3.47%) Security Cleared
4 13 (3.22%) Microsoft Certification
5 9 (2.23%) SC Cleared
6 6 (1.49%) Azure Certification
6 6 (1.49%) CCNA
6 6 (1.49%) Cisco Certification
6 6 (1.49%) MCITP
6 6 (1.49%) Network+ Certification
7 5 (1.24%) AWS Certification
7 5 (1.24%) DBS Check
8 4 (0.99%) AWS Certified DevOps Engineer
8 4 (0.99%) CISSP
8 4 (0.99%) ITIL Foundation Certificate
9 3 (0.74%) BPSS Clearance
9 3 (0.74%) GISP
9 3 (0.74%) PMI Certification
9 3 (0.74%) PMP
Quality Assurance & Compliance
1 21 (5.20%) SLA
2 15 (3.71%) QA
3 11 (2.72%) Accessibility
4 10 (2.48%) GDPR
5 8 (1.98%) ISO/IEC 27001
6 4 (0.99%) COBIT
6 4 (0.99%) NIST
7 3 (0.74%) Cyber Essentials
7 3 (0.74%) Sarbanes-Oxley
8 2 (0.50%) Cyber Essentials PLUS
8 2 (0.50%) ISO 9001
8 2 (0.50%) ISO/IEC 20000
8 2 (0.50%) PMO
9 1 (0.25%) Data Quality
9 1 (0.25%) GRC
9 1 (0.25%) HIPAA
9 1 (0.25%) ISO 13485
9 1 (0.25%) ISO 22301
9 1 (0.25%) SOC 2
System Software
1 36 (8.91%) Active Directory
2 8 (1.98%) VMware Infrastructure
3 2 (0.50%) vSphere
4 1 (0.25%) Docker
4 1 (0.25%) Hyper-V
4 1 (0.25%) Virtual Servers
4 1 (0.25%) XenApp
Systems Management
1 23 (5.69%) Microsoft Intune
2 8 (1.98%) SCCM
3 6 (1.49%) Terraform
4 4 (0.99%) Kubernetes
5 3 (0.74%) Grafana
5 3 (0.74%) Jamf Pro
5 3 (0.74%) Prometheus
6 2 (0.50%) Puppet
7 1 (0.25%) Ansible
7 1 (0.25%) Autotask
7 1 (0.25%) FortiGate
7 1 (0.25%) Panaseer
7 1 (0.25%) Single Sign-On
7 1 (0.25%) Systems Management Server (SMS)
7 1 (0.25%) Tivoli Storage Manager
7 1 (0.25%) WSUS
Vendors
1 120 (29.70%) Microsoft
2 107 (26.49%) ServiceNow
3 18 (4.46%) Facebook
4 13 (3.22%) Cisco
5 10 (2.48%) Apple
6 9 (2.23%) SolarWinds
6 9 (2.23%) VMware
7 8 (1.98%) Salesforce
8 7 (1.73%) SAP
9 5 (1.24%) Google
9 5 (1.24%) Meraki
10 3 (0.74%) Darktrace
10 3 (0.74%) Fortinet
10 3 (0.74%) IBM
10 3 (0.74%) Juniper
10 3 (0.74%) McAfee
10 3 (0.74%) Oracle
10 3 (0.74%) Palo Alto
10 3 (0.74%) Splunk
11 2 (0.50%) Sun