Puppet
UK

The table below provides summary statistics for permanent job vacancies requiring Puppet skills. It includes a benchmarking guide to the annual salaries offered in vacancies that cited Puppet over the 6 months leading up to 2 June 2025, comparing them to the same period in the previous two years.

6 months to
2 Jun 2025
Same period 2024 Same period 2023
Rank 607 558 381
Rank change year-on-year -49 -177 -68
Permanent jobs citing Puppet 119 389 798
As % of all permanent jobs advertised in the UK 0.21% 0.37% 0.84%
As % of the Systems Management category 2.11% 3.93% 5.83%
Number of salaries quoted 70 287 483
10th Percentile £53,750 £42,500 £47,500
25th Percentile £56,250 £48,750 £58,000
Median annual salary (50th Percentile) £70,000 £70,000 £72,500
Median % change year-on-year - -3.45% -
75th Percentile £82,188 £85,000 £88,750
90th Percentile £107,375 £92,500 £102,250
UK excluding London median annual salary £59,000 £60,000 £70,000
% change year-on-year -1.67% -14.29% +16.67%

All Systems Management Skills
UK

Puppet falls under the Systems Management category. For comparison with the information above, the following table provides summary statistics for all permanent job vacancies requiring systems management skills.

Permanent vacancies with a requirement for systems management skills 5,650 9,890 13,690
As % of all permanent jobs advertised in the UK 10.11% 9.42% 14.46%
Number of salaries quoted 3,097 7,029 8,736
10th Percentile £35,000 £32,500 £35,000
25th Percentile £47,231 £45,000 £47,500
Median annual salary (50th Percentile) £67,500 £61,206 £67,500
Median % change year-on-year +10.28% -9.32% -3.57%
75th Percentile £87,500 £83,750 £87,500
90th Percentile £110,000 £100,000 £105,000
UK excluding London median annual salary £59,250 £55,000 £58,000
% change year-on-year +7.73% -5.17% -

Puppet
Job Vacancy Trend

Job postings citing Puppet as a proportion of all IT jobs advertised.
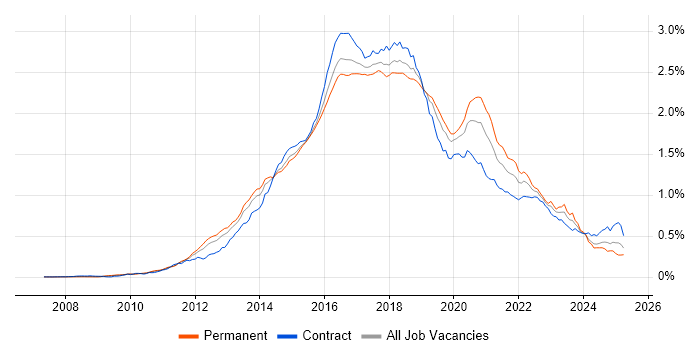
Job vacancy trend for Puppet in the UK

Puppet
Salary Trend

3-month moving average salary quoted in jobs citing Puppet.

Salary trend for Puppet in the UK

Puppet
Salary Histogram

Salary distribution for jobs citing Puppet over the 6 months to 2 June 2025.

Salary histogram for Puppet in the UK

Puppet
Top 14 Job Locations

The table below looks at the demand and provides a guide to the median salaries quoted in IT jobs citing Puppet within the UK over the 6 months to 2 June 2025. The 'Rank Change' column provides an indication of the change in demand within each location based on the same 6 month period last year.

Location Rank Change
on Same Period
Last Year
Matching
Permanent
IT Job Ads
Median Salary
Past 6 Months
Median Salary
% Change
on Same Period
Last Year
Live
Jobs
England -36 115 £70,000 - 660
UK excluding London +7 71 £59,000 -1.67% 615
London +31 49 £80,000 +6.67% 111
Work from Home +19 34 £65,000 -7.14% 412
South East +63 26 £57,500 -11.54% 151
North of England +43 26 £70,000 +33.33% 146
North West +9 18 £70,000 +33.33% 61
Yorkshire +52 8 £70,000 +63.19% 70
Midlands +68 6 £67,500 -22.86% 111
South West -7 6 £85,000 +61.90% 83
West Midlands +65 5 £67,500 -15.63% 60
Scotland +105 4 - - 24
East of England +31 3 £90,000 +41.18% 94
East Midlands +35 1 - - 43

Puppet
Co-occurring Skills and Capabilities by Category

The follow tables expand on the table above by listing co-occurrences grouped by category. The same employment type, locality and period is covered with up to 20 co-occurrences shown in each of the following categories:

Application Platforms
1 8 (6.72%) Confluence
2 6 (5.04%) Microsoft Exchange
3 5 (4.20%) Apache
4 3 (2.52%) WebSphere
5 2 (1.68%) nginx
5 2 (1.68%) Tomcat
5 2 (1.68%) WebSphere Application Server
6 1 (0.84%) JBoss
6 1 (0.84%) OpenStack
Business Applications
1 3 (2.52%) Remedy ITSM
Cloud Services
1 68 (57.14%) AWS
2 51 (42.86%) Azure
3 35 (29.41%) GCP
4 20 (16.81%) GitHub
5 16 (13.45%) Pulumi
6 12 (10.08%) SaaS
7 9 (7.56%) OpenShift
8 8 (6.72%) Microsoft 365
9 7 (5.88%) AWS CloudFormation
9 7 (5.88%) Azure DevOps
9 7 (5.88%) PaaS
10 6 (5.04%) IaaS
11 4 (3.36%) Amazon S3
11 4 (3.36%) AWS Lambda
11 4 (3.36%) Serverless
12 3 (2.52%) Amazon EC2
12 3 (2.52%) Azure AKS
12 3 (2.52%) Azure Key Vault
12 3 (2.52%) GitHub Actions
12 3 (2.52%) Miro
Communications & Networking
1 18 (15.13%) DNS
2 16 (13.45%) DHCP
2 16 (13.45%) Firewall
3 13 (10.92%) SAN
4 11 (9.24%) 5G
4 11 (9.24%) Bluetooth
4 11 (9.24%) LTE
4 11 (9.24%) Wi-Fi
5 8 (6.72%) NAS
6 6 (5.04%) Network Security
6 6 (5.04%) Remote Desktop
6 6 (5.04%) SMTP
6 6 (5.04%) VPN
6 6 (5.04%) VSAN
7 5 (4.20%) VLAN
8 4 (3.36%) Cisco Nexus
8 4 (3.36%) IPv4
9 3 (2.52%) LAN
9 3 (2.52%) TCP/IP
9 3 (2.52%) WAN
Database & Business Intelligence
1 8 (6.72%) Amazon RDS
2 7 (5.88%) NoSQL
3 6 (5.04%) PostgreSQL
4 4 (3.36%) MongoDB
4 4 (3.36%) MySQL
4 4 (3.36%) SQL Server
5 3 (2.52%) Elasticsearch
6 2 (1.68%) Data Mining
7 1 (0.84%) RDBMS
7 1 (0.84%) Relational Database
Development Applications
1 33 (27.73%) Jenkins
2 16 (13.45%) JIRA
3 11 (9.24%) Git
4 8 (6.72%) GitLab
4 8 (6.72%) TeamCity
5 7 (5.88%) Sonatype Nexus
6 6 (5.04%) Atlassian Bamboo
7 5 (4.20%) CircleCI
8 3 (2.52%) AppScan
8 3 (2.52%) SonarQube
8 3 (2.52%) Team Foundation Server
9 2 (1.68%) Artifactory
9 2 (1.68%) Maven
9 2 (1.68%) Spinnaker
9 2 (1.68%) YouTrack
10 1 (0.84%) Ant
10 1 (0.84%) Bitbucket
10 1 (0.84%) Selenium
10 1 (0.84%) Vagrant
General
1 28 (23.53%) Inclusion and Diversity
2 26 (21.85%) Finance
3 25 (21.01%) Social Skills
4 11 (9.24%) Electronics
4 11 (9.24%) Law
5 5 (4.20%) Analytical Skills
6 4 (3.36%) Banking
6 4 (3.36%) Games
6 4 (3.36%) Telecoms
7 3 (2.52%) Marketing
8 2 (1.68%) Financial Institution
9 1 (0.84%) Avionics
9 1 (0.84%) Legal
9 1 (0.84%) Retail
Job Titles
1 29 (24.37%) Platform Engineer
2 27 (22.69%) Lead
3 25 (21.01%) Infrastructure Engineer
4 19 (15.97%) DevOps Engineer
5 14 (11.76%) Linux Engineer
6 13 (10.92%) Support Engineer
7 12 (10.08%) Senior
8 11 (9.24%) Administrator
8 11 (9.24%) Lead Infrastructure Engineer
9 9 (7.56%) Junior
9 9 (7.56%) Systems Administrator
10 8 (6.72%) Azure Engineer
10 8 (6.72%) DevOps Platform Engineer
11 7 (5.88%) Junior Linux Engineer
11 7 (5.88%) Linux Administrator
11 7 (5.88%) Virtualisation Specialist
11 7 (5.88%) VMware Engineer
12 6 (5.04%) Linux Systems Administrator
12 6 (5.04%) VMware Specialist
12 6 (5.04%) VMware Support Engineer
Libraries, Frameworks & Software Standards
1 8 (6.72%) ADO
2 4 (3.36%) ARM Templates
2 4 (3.36%) Elastic Stack
2 4 (3.36%) RESTful
3 3 (2.52%) .NET
3 3 (2.52%) LDAP
3 3 (2.52%) Middleware
3 3 (2.52%) Node.js
4 2 (1.68%) AngularJS
4 2 (1.68%) Django
4 2 (1.68%) Flask
4 2 (1.68%) LAMP
4 2 (1.68%) LAPP Stack
4 2 (1.68%) Laravel
4 2 (1.68%) REST
4 2 (1.68%) Vue
5 1 (0.84%) JSON
5 1 (0.84%) Kafka
5 1 (0.84%) React
5 1 (0.84%) YAML
Miscellaneous
1 28 (23.53%) Public Cloud
2 17 (14.29%) Clustering
3 12 (10.08%) Management Information System
4 11 (9.24%) IoT
4 11 (9.24%) NB-IoT
5 10 (8.40%) Data Centre
6 6 (5.04%) Legacy Systems
6 6 (5.04%) PKI
6 6 (5.04%) Replication
7 5 (4.20%) Cyber Threat
8 4 (3.36%) Cloud Native
8 4 (3.36%) Hybrid Cloud
9 3 (2.52%) Cloud Security Posture
9 3 (2.52%) Linux Command Line
9 3 (2.52%) Machine to Machine
9 3 (2.52%) Security Posture
9 3 (2.52%) Virtual Team
10 2 (1.68%) Cyberattack
10 2 (1.68%) Mobile App
10 2 (1.68%) Private Cloud
Operating Systems
1 79 (66.39%) Linux
2 51 (42.86%) Windows
3 28 (23.53%) Windows Server
4 18 (15.13%) Red Hat Enterprise Linux
5 6 (5.04%) Unix
6 5 (4.20%) CentOS
7 4 (3.36%) Oracle Linux
8 3 (2.52%) Solaris
9 2 (1.68%) Debian
9 2 (1.68%) VMS
10 1 (0.84%) CoreOS
10 1 (0.84%) Ubuntu
10 1 (0.84%) Windows Server 2003
Processes & Methodologies
1 58 (48.74%) Infrastructure as Code
2 49 (41.18%) CI/CD
3 38 (31.93%) Configuration Management
4 37 (31.09%) DevOps
5 33 (27.73%) Platform Engineering
6 27 (22.69%) Infrastructure Engineering
7 23 (19.33%) Agile
8 18 (15.13%) Mentoring
8 18 (15.13%) Site Reliability Engineering
9 17 (14.29%) High Availability
9 17 (14.29%) Roadmaps
9 17 (14.29%) Task Automation
10 16 (13.45%) Deployment Automation
10 16 (13.45%) Incident Management
11 15 (12.61%) Low Latency
11 15 (12.61%) Problem-Solving
12 14 (11.76%) Asset Management
12 14 (11.76%) Fintech
13 12 (10.08%) Software Testing
14 11 (9.24%) Penetration Testing
Programming Languages
1 70 (58.82%) Python
2 43 (36.13%) PowerShell
3 40 (33.61%) Bash
4 22 (18.49%) Bicep
5 18 (15.13%) Ruby
6 12 (10.08%) Java
7 11 (9.24%) Go
8 5 (4.20%) SQL
9 4 (3.36%) Perl
9 4 (3.36%) R
9 4 (3.36%) TypeScript
10 3 (2.52%) C#
10 3 (2.52%) JavaScript
10 3 (2.52%) PHP
11 1 (0.84%) Groovy
11 1 (0.84%) Shell Script
11 1 (0.84%) T-SQL
Qualifications
1 23 (19.33%) Degree
2 21 (17.65%) Security Cleared
3 16 (13.45%) DV Cleared
4 12 (10.08%) Network+ Certification
5 11 (9.24%) CompTIA Security+
6 8 (6.72%) AWS Certification
7 7 (5.88%) VMware Certified Professional (VCP)
8 4 (3.36%) Azure Certification
8 4 (3.36%) CISSP
8 4 (3.36%) SC Cleared
9 3 (2.52%) (ISC)2 CCSP
9 3 (2.52%) CCSP
9 3 (2.52%) Cisco Certification
10 2 (1.68%) Computer Science Degree
11 1 (0.84%) AWS Certified DevOps Engineer
11 1 (0.84%) GCED
11 1 (0.84%) GREM
11 1 (0.84%) Microsoft Certification
11 1 (0.84%) SANS
11 1 (0.84%) VCAP
Quality Assurance & Compliance
1 6 (5.04%) GDPR
1 6 (5.04%) NIST
1 6 (5.04%) SLA
2 5 (4.20%) ISO/IEC 27001
2 5 (4.20%) QA
3 3 (2.52%) SOC 2
4 1 (0.84%) Government Security Classifications
4 1 (0.84%) NIST 800
System Software
1 42 (35.29%) Docker
2 39 (32.77%) VMware Infrastructure
3 25 (21.01%) vSphere
4 19 (15.97%) Active Directory
5 15 (12.61%) Hyper-V
5 15 (12.61%) VMware ESXi
6 6 (5.04%) BitLocker
6 6 (5.04%) Microsoft App-V
6 6 (5.04%) Terminal Services
7 5 (4.20%) KVM
8 4 (3.36%) Virtual Desktop
8 4 (3.36%) Xen
9 3 (2.52%) Veritas Cluster Server
10 2 (1.68%) NFS
10 2 (1.68%) Postfix
10 2 (1.68%) SRDF
11 1 (0.84%) VMware NSX
Systems Management
1 102 (85.71%) Ansible
2 66 (55.46%) Terraform
3 55 (46.22%) Kubernetes
4 54 (45.38%) Progress Chef
5 15 (12.61%) Podman
6 13 (10.92%) vCenter Server
7 12 (10.08%) vMotion
8 11 (9.24%) Nagios
8 11 (9.24%) Prometheus
9 9 (7.56%) Grafana
10 8 (6.72%) vRealize
11 6 (5.04%) PowerCLI
12 5 (4.20%) Salt
13 4 (3.36%) Consul
14 3 (2.52%) Argo
14 3 (2.52%) Istio
14 3 (2.52%) Proxmox
15 2 (1.68%) CFEngine
15 2 (1.68%) Graylog
15 2 (1.68%) Rundeck
Vendors
1 46 (38.66%) VMware
2 34 (28.57%) Microsoft
3 15 (12.61%) Google
4 14 (11.76%) Citrix
4 14 (11.76%) HP
5 12 (10.08%) Red Hat
6 11 (9.24%) Oracle
7 10 (8.40%) Cisco
8 9 (7.56%) Symantec
9 7 (5.88%) EMC
10 6 (5.04%) Atlassian
10 6 (5.04%) Veeam
11 5 (4.20%) NetApp
11 5 (4.20%) New Relic
11 5 (4.20%) ServiceNow
12 4 (3.36%) PagerDuty
12 4 (3.36%) SaltStack
13 3 (2.52%) Alibaba
13 3 (2.52%) Juniper
13 3 (2.52%) Remedy