Service Management Jobs with Hybrid/Remote/WFH Options

Service Management
UK > Work from Home

The table below provides summary statistics for permanent remote or hybrid work requiring Service Management skills. It includes a benchmarking guide to the annual salaries offered in vacancies that cited Service Management over the 6 months leading up to 1 August 2025, comparing them to the same period in the previous two years.

6 months to
1 Aug 2025
Same period 2024 Same period 2023
Rank 171 150 161
Rank change year-on-year -21 +11 +81
Permanent jobs citing Service Management 442 594 688
As % of all permanent jobs with a WFH option 2.05% 2.19% 2.14%
As % of the Processes & Methodologies category 2.21% 2.48% 2.23%
Number of salaries quoted 186 425 547
10th Percentile £31,000 £31,250 £32,500
25th Percentile £37,043 £40,988 £42,396
Median annual salary (50th Percentile) £52,500 £55,000 £60,000
Median % change year-on-year -4.55% -8.33% +8.81%
75th Percentile £67,500 £70,000 £77,500
90th Percentile £85,375 £92,000 £88,750
UK median annual salary £55,000 £50,000 £55,000
% change year-on-year +10.00% -9.09% +4.76%

All Process and Methodology Skills
Work from Home

Service Management falls under the Processes and Methodologies category. For comparison with the information above, the following table provides summary statistics for all permanent job vacancies with remote or hybrid options requiring process or methodology skills.

Permanent vacancies with a requirement for process or methodology skills 19,979 23,935 30,857
As % of all permanent jobs with a WFH option 92.78% 88.32% 95.90%
Number of salaries quoted 10,394 16,694 22,949
10th Percentile £25,313 £35,000 £37,500
25th Percentile £38,199 £42,725 £47,500
Median annual salary (50th Percentile) £56,888 £57,965 £62,500
Median % change year-on-year -1.86% -7.26% +4.17%
75th Percentile £76,250 £77,500 £81,250
90th Percentile £99,800 £97,500 £100,000
UK median annual salary £55,000 £55,000 £60,000
% change year-on-year - -8.33% -

Service Management
Trend for Jobs with a WFH Option

Job vacancies with remote working options citing Service Management as a proportion of all IT jobs advertised.
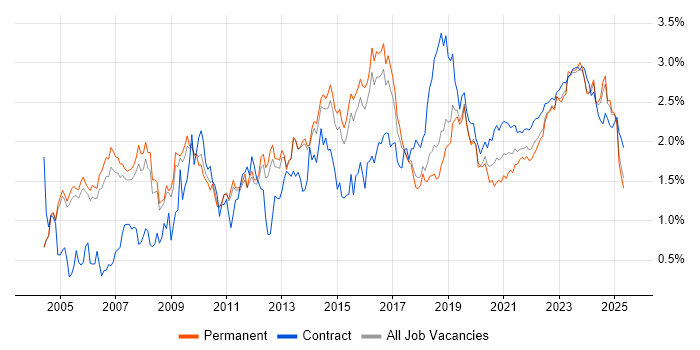
Service Management trend for jobs with Hybrid/Remote/WFH options

Service Management
Salary Trend for Jobs with a WFH Option

3-month moving average salary quoted in job vacancies with remote working options citing Service Management.

Service Management salary trend for jobs with a WFH option

Service Management
Salary Histogram for Jobs with a WFH Option

Salary distribution for jobs with remote working options citing Service Management over the 6 months to 1 August 2025.

Service Management salary histogram for jobs with a WFH option

Service Management
Co-occurring Skills and Capabilities with WFH Options by Category

The follow tables expand on the table above by listing co-occurrences grouped by category. The same employment type, locality and period is covered with up to 20 co-occurrences shown in each of the following categories:

Application Platforms
1 75 (16.97%) Oracle Application Server
2 18 (4.07%) SharePoint
3 7 (1.58%) Microsoft Exchange
4 6 (1.36%) Confluence
4 6 (1.36%) IIS
5 5 (1.13%) Apache
6 1 (0.23%) Tomcat
6 1 (0.23%) WebSphere
6 1 (0.23%) WebSphere Application Server
Applications
1 19 (4.30%) Microsoft Office
2 13 (2.94%) Microsoft Excel
3 7 (1.58%) Microsoft PowerPoint
4 4 (0.90%) Microsoft Project
5 2 (0.45%) Chatbot
6 1 (0.23%) Weka
Business Applications
1 6 (1.36%) Dynamics CRM
2 2 (0.45%) Infor M3
3 1 (0.23%) Carpe Diem
3 1 (0.23%) Elite 3E
3 1 (0.23%) Remedy ITSM
3 1 (0.23%) SAP S/4HANA
3 1 (0.23%) Shopify
Cloud Services
1 67 (15.16%) Azure
2 58 (13.12%) SaaS
3 41 (9.28%) Microsoft 365
4 40 (9.05%) AWS
5 29 (6.56%) Entra ID
5 29 (6.56%) Power Platform
6 25 (5.66%) IaaS
6 25 (5.66%) PaaS
7 23 (5.20%) Azure Monitor
8 17 (3.85%) Azure DevOps
8 17 (3.85%) Power Automate
9 16 (3.62%) Azure AI
9 16 (3.62%) Azure ExpressRoute
9 16 (3.62%) Azure Key Vault
9 16 (3.62%) Azure Service Bus
10 8 (1.81%) Zapier
11 7 (1.58%) Dynamics 365
12 6 (1.36%) Azure Data Factory
12 6 (1.36%) Azure Logic Apps
13 3 (0.68%) Slack
Communications & Networking
1 109 (24.66%) Broadband
2 36 (8.14%) DNS
3 31 (7.01%) Firewall
4 28 (6.33%) VPN
5 25 (5.66%) WAN
6 22 (4.98%) SD-WAN
7 10 (2.26%) Network Security
8 9 (2.04%) LAN
8 9 (2.04%) Remote Desktop
9 8 (1.81%) Wireless
10 7 (1.58%) TCP/IP
11 5 (1.13%) DHCP
11 5 (1.13%) SNMP
11 5 (1.13%) Wi-Fi
12 4 (0.90%) VoIP
13 3 (0.68%) Internet
13 3 (0.68%) SAN
13 3 (0.68%) Unified Communications
14 2 (0.45%) ADSL
14 2 (0.45%) SSL
Database & Business Intelligence
1 109 (24.66%) Metadata
1 109 (24.66%) Tableau
2 77 (17.42%) Oracle Reports
3 76 (17.19%) Data Warehouse
4 75 (16.97%) Enterprise Data Warehouse
5 22 (4.98%) Power BI
6 17 (3.85%) Data Lake
7 16 (3.62%) MySQL
8 14 (3.17%) SQL Server
9 11 (2.49%) Relational Database
10 7 (1.58%) DB2
11 6 (1.36%) SQL Server Integration Services
12 2 (0.45%) Crystal Reports
12 2 (0.45%) Oracle Database
13 1 (0.23%) Amazon RDS
13 1 (0.23%) PostgreSQL
13 1 (0.23%) SQL Server Reporting Services
Development Applications
1 21 (4.75%) JIRA
2 17 (3.85%) Git
3 6 (1.36%) Visual Studio
General
1 321 (72.62%) Social Skills
2 110 (24.89%) Analytical Skills
2 110 (24.89%) Finance
2 110 (24.89%) Games
3 79 (17.87%) Organisational Skills
4 75 (16.97%) Military
5 24 (5.43%) Law
6 21 (4.75%) Public Sector
7 19 (4.30%) Inclusion and Diversity
8 18 (4.07%) Legal
8 18 (4.07%) Retail
9 17 (3.85%) Local Government
9 17 (3.85%) Presentation Skills
10 8 (1.81%) Welsh Language
11 7 (1.58%) Back Office
12 6 (1.36%) Automotive
13 4 (0.90%) Influencing Skills
13 4 (0.90%) Manufacturing
13 4 (0.90%) Telecoms
14 3 (0.68%) Advertising
Job Titles
1 113 (25.57%) Incident Manager
2 40 (9.05%) Analyst
3 39 (8.82%) Lead
4 34 (7.69%) IT Manager
5 31 (7.01%) Service Manager
6 25 (5.66%) Database Engineer
6 25 (5.66%) IT Services Manager
6 25 (5.66%) IT Support
7 22 (4.98%) Applications Support
8 21 (4.75%) Development Manager
8 21 (4.75%) Senior
9 19 (4.30%) Architect
10 18 (4.07%) Business Manager
11 17 (3.85%) Cloud Architect
11 17 (3.85%) Support Analyst
12 15 (3.39%) Applications Support Analyst
12 15 (3.39%) Business Development Manager
13 14 (3.17%) IT Development Manager
13 14 (3.17%) New Business Development Manager
14 13 (2.94%) 2nd Line Support
Libraries, Frameworks & Software Standards
1 12 (2.71%) .NET
2 7 (1.58%) .NET Framework
3 6 (1.36%) ASP.NET
4 4 (0.90%) Node.js
4 4 (0.90%) React
5 3 (0.68%) Web Services
6 2 (0.45%) Elastic Stack
6 2 (0.45%) LDAP
6 2 (0.45%) REST
6 2 (0.45%) SOAP
7 1 (0.23%) .NET Core
7 1 (0.23%) Ajax
7 1 (0.23%) CSS
7 1 (0.23%) HTML
7 1 (0.23%) LAPP Stack
7 1 (0.23%) Middleware
7 1 (0.23%) MvvmCross
7 1 (0.23%) SAML
7 1 (0.23%) SAP Basis
7 1 (0.23%) WebSphere MQ
Miscellaneous
1 109 (24.66%) Over-the-Top Content
2 24 (5.43%) Data Centre
3 23 (5.20%) Management Information System
4 20 (4.52%) Onboarding
5 19 (4.30%) NHS
6 18 (4.07%) Enterprise Software
7 12 (2.71%) IoT
8 9 (2.04%) Cloud Native
8 9 (2.04%) CMDB
8 9 (2.04%) Security Posture
9 6 (1.36%) Foreign Exchange (FX)
10 5 (1.13%) Blackberry
10 5 (1.13%) Client/Server
10 5 (1.13%) Driving Licence
10 5 (1.13%) Product Ownership
11 4 (0.90%) Linux Command Line
11 4 (0.90%) Operational Technology
11 4 (0.90%) Video Conferencing
12 3 (0.68%) Legacy Systems
13 2 (0.45%) Cyber Threat
Operating Systems
1 52 (11.76%) Windows
2 24 (5.43%) Windows Server
3 9 (2.04%) Windows 10
4 7 (1.58%) Linux
5 3 (0.68%) Mac OS
5 3 (0.68%) Red Hat Enterprise Linux
5 3 (0.68%) Windows Server 2019
6 2 (0.45%) Android
7 1 (0.23%) Apple iOS
7 1 (0.23%) Unix
7 1 (0.23%) Windows Server 2008
Processes & Methodologies
1 250 (56.56%) ITIL
2 219 (49.55%) Problem-Solving
3 202 (45.70%) Customer Experience
4 161 (36.43%) Continuous Improvement
5 151 (34.16%) Incident Management
6 145 (32.81%) Artificial Intelligence
7 138 (31.22%) Cybersecurity
8 130 (29.41%) Agile
9 123 (27.83%) Incident Response
10 120 (27.15%) Disaster Recovery
10 120 (27.15%) ITSM
11 115 (26.02%) High Availability
12 114 (25.79%) Actionable Insight
12 114 (25.79%) Machine Learning
13 113 (25.57%) Analytics
13 113 (25.57%) DevOps
14 111 (25.11%) Cloud Operations
15 109 (24.66%) Contingency Planning
16 92 (20.81%) Data Integration
17 81 (18.33%) Data Modelling
Programming Languages
1 53 (11.99%) SQL
2 29 (6.56%) PowerShell
3 20 (4.52%) Python
4 17 (3.85%) Bicep
5 12 (2.71%) C#
6 7 (1.58%) VB.NET
7 6 (1.36%) PL/SQL
7 6 (1.36%) T-SQL
8 4 (0.90%) TypeScript
9 3 (0.68%) Bash
10 2 (0.45%) Perl
11 1 (0.23%) JavaScript
Qualifications
1 103 (23.30%) DBS Check
2 42 (9.50%) Degree
3 35 (7.92%) Azure Certification
4 31 (7.01%) Microsoft Certification
5 24 (5.43%) ITIL Certification
6 16 (3.62%) Security Cleared
7 12 (2.71%) SC Cleared
8 11 (2.49%) AWS Certification
8 11 (2.49%) PMI Certification
8 11 (2.49%) PMP
9 10 (2.26%) Network+ Certification
10 9 (2.04%) MCITP
11 8 (1.81%) MCSA
11 8 (1.81%) MCSE
12 6 (1.36%) Cisco Certification
12 6 (1.36%) CISSP
12 6 (1.36%) Computer Science Degree
13 5 (1.13%) CCNP
14 4 (0.90%) AWS Certified DevOps Engineer
14 4 (0.90%) DV Cleared
Quality Assurance & Compliance
1 29 (6.56%) SLA
2 12 (2.71%) QA
3 6 (1.36%) ISO/IEC 27001
3 6 (1.36%) PMO
4 5 (1.13%) COBIT
4 5 (1.13%) ISO/IEC 20000
5 4 (0.90%) NIST
6 2 (0.45%) Accessibility
6 2 (0.45%) GDPR
7 1 (0.23%) Government Security Classifications
7 1 (0.23%) GRC
7 1 (0.23%) ISO 9001
System Software
1 28 (6.33%) Active Directory
2 16 (3.62%) Virtual Machines
3 10 (2.26%) VMware Infrastructure
4 9 (2.04%) Virtual Desktop
5 2 (0.45%) Docker
5 2 (0.45%) Hyper-V
6 1 (0.23%) VMware ESXi
6 1 (0.23%) VMware NSX
Systems Management
1 19 (4.30%) Single Sign-On
2 13 (2.94%) Microsoft Intune
3 5 (1.13%) Ansible
3 5 (1.13%) ZABBIX
4 3 (0.68%) Progress Chef
4 3 (0.68%) Puppet
4 3 (0.68%) SCCM
4 3 (0.68%) SmoothWall
5 2 (0.45%) Jamf Pro
5 2 (0.45%) Kubernetes
5 2 (0.45%) SCOM
5 2 (0.45%) Terraform
6 1 (0.23%) Avamar
6 1 (0.23%) HP UCMDB
6 1 (0.23%) Plesk
6 1 (0.23%) vCenter Server
6 1 (0.23%) VxRail
Vendors
1 156 (35.29%) ServiceNow
2 103 (23.30%) Microsoft
3 82 (18.55%) Oracle
4 19 (4.30%) Meraki
5 17 (3.85%) Databricks
6 14 (3.17%) Cisco
7 11 (2.49%) Google
8 10 (2.26%) Apple
8 10 (2.26%) VMware
9 7 (1.58%) SolarWinds
10 6 (1.36%) iManage
10 6 (1.36%) Intapp
11 5 (1.13%) Adobe
12 4 (0.90%) EMC
12 4 (0.90%) Palo Alto
13 3 (0.68%) IBM
13 3 (0.68%) Red Hat
14 2 (0.45%) Atlassian
14 2 (0.45%) Infor
14 2 (0.45%) RedGate