Stakeholder Engagement Jobs with Hybrid/Remote/WFH Options

Stakeholder Engagement
UK > Work from Home

The table below provides summary statistics for permanent remote or hybrid work requiring Stakeholder Engagement skills. It includes a benchmarking guide to the annual salaries offered in vacancies that cited Stakeholder Engagement over the 6 months leading up to 9 May 2025, comparing them to the same period in the previous two years.

6 months to
9 May 2025
Same period 2024 Same period 2023
Rank 220 229 308
Rank change year-on-year +9 +79 +89
Permanent jobs citing Stakeholder Engagement 255 468 431
As % of all permanent jobs with a WFH option 1.53% 1.39% 1.04%
As % of the Processes & Methodologies category 1.64% 1.52% 1.08%
Number of salaries quoted 168 288 306
10th Percentile £42,387 £38,951 £41,500
25th Percentile £50,000 £42,286 £52,500
Median annual salary (50th Percentile) £63,750 £55,000 £65,000
Median % change year-on-year +15.91% -15.38% +13.04%
75th Percentile £82,500 £70,000 £81,250
90th Percentile £96,742 £93,750 £95,000
UK median annual salary £62,000 £55,000 £65,000
% change year-on-year +12.73% -15.38% +8.33%

All Process and Methodology Skills
Work from Home

Stakeholder Engagement falls under the Processes and Methodologies category. For comparison with the information above, the following table provides summary statistics for all permanent job vacancies with remote or hybrid options requiring process or methodology skills.

Permanent vacancies with a requirement for process or methodology skills 15,587 30,857 39,858
As % of all permanent jobs with a WFH option 93.80% 91.38% 96.11%
Number of salaries quoted 9,824 23,439 27,686
10th Percentile £29,750 £33,750 £37,500
25th Percentile £44,000 £42,500 £47,500
Median annual salary (50th Percentile) £60,000 £57,500 £62,500
Median % change year-on-year +4.35% -8.00% +4.17%
75th Percentile £77,500 £75,000 £82,500
90th Percentile £102,500 £95,000 £100,000
UK median annual salary £57,500 £55,000 £61,180
% change year-on-year +4.55% -10.10% +1.97%

Stakeholder Engagement
Trend for Jobs with a WFH Option

Job vacancies with remote working options citing Stakeholder Engagement as a proportion of all IT jobs advertised.
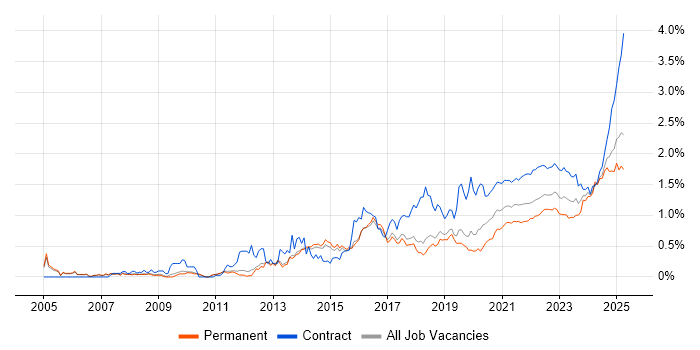
Stakeholder Engagement trend for jobs with Hybrid/Remote/WFH options

Stakeholder Engagement
Salary Trend for Jobs with a WFH Option

3-month moving average salary quoted in job vacancies with remote working options citing Stakeholder Engagement.

Stakeholder Engagement salary trend for jobs with a WFH option

Stakeholder Engagement
Salary Histogram for Jobs with a WFH Option

Salary distribution for jobs with remote working options citing Stakeholder Engagement over the 6 months to 9 May 2025.

Stakeholder Engagement salary histogram for jobs with a WFH option

Stakeholder Engagement
Co-occurring Skills and Capabilities with WFH Options by Category

The follow tables expand on the table above by listing co-occurrences grouped by category. The same employment type, locality and period is covered with up to 20 co-occurrences shown in each of the following categories:

Application Platforms
1 12 (4.71%) SharePoint
2 9 (3.53%) Confluence
3 7 (2.75%) SAS
4 4 (1.57%) nginx
5 2 (0.78%) CMS
5 2 (0.78%) Microsoft Exchange
5 2 (0.78%) WordPress
6 1 (0.39%) ArcGIS
6 1 (0.39%) Drupal
6 1 (0.39%) Umbraco
Applications
1 20 (7.84%) Microsoft Excel
2 12 (4.71%) Microsoft Project
3 9 (3.53%) Microsoft PowerPoint
4 6 (2.35%) Microsoft Office
4 6 (2.35%) MS Visio
5 5 (1.96%) Trello
6 3 (1.18%) Adobe XD
7 2 (0.78%) Notion
8 1 (0.39%) Adobe Creative Suite
Business Applications
1 7 (2.75%) Dynamics CRM
2 5 (1.96%) SAP S/4HANA
3 4 (1.57%) IBM Planning Analytics
4 3 (1.18%) Dynamics NAV
5 2 (0.78%) Infor LN
6 1 (0.39%) Oracle Assets
6 1 (0.39%) Oracle EBS
6 1 (0.39%) Oracle EBS R12
6 1 (0.39%) Oracle ERP
6 1 (0.39%) Oracle Payables
6 1 (0.39%) Oracle Receivables
6 1 (0.39%) SAP CO
6 1 (0.39%) SAP FI
6 1 (0.39%) SAP FI/CO
Cloud Services
1 40 (15.69%) Power Platform
2 34 (13.33%) Azure
3 24 (9.41%) AWS
4 18 (7.06%) GCP
5 17 (6.67%) Microsoft 365
6 15 (5.88%) Dynamics 365
7 11 (4.31%) Amazon CloudWatch
8 9 (3.53%) SaaS
9 7 (2.75%) Amazon EC2
9 7 (2.75%) Amazon S3
9 7 (2.75%) Azure Data Factory
9 7 (2.75%) Azure Service Bus
9 7 (2.75%) PowerApps
9 7 (2.75%) Virtual Private Cloud
10 6 (2.35%) Azure DevOps
10 6 (2.35%) Google Workspace
11 5 (1.96%) Azure Logic Apps
12 4 (1.57%) Figma
12 4 (1.57%) Miro
12 4 (1.57%) Smartsheet
Communications & Networking
1 3 (1.18%) DNS
1 3 (1.18%) SMS
2 2 (0.78%) Intranet
2 2 (0.78%) SAN
3 1 (0.39%) Firewall
3 1 (0.39%) Internet
3 1 (0.39%) NAS
3 1 (0.39%) S/MIME
3 1 (0.39%) SSL
3 1 (0.39%) X.509
Database & Business Intelligence
1 27 (10.59%) Power BI
2 9 (3.53%) Data Hub
3 7 (2.75%) NoSQL
3 7 (2.75%) PostgreSQL
4 6 (2.35%) GIS
4 6 (2.35%) Tableau
5 4 (1.57%) Amazon RDS
5 4 (1.57%) Data Warehouse
5 4 (1.57%) MariaDB
5 4 (1.57%) SQL Server
6 3 (1.18%) Data Mining
7 1 (0.39%) Azure SQL Database
7 1 (0.39%) Geospatial Data
7 1 (0.39%) Relational Database
7 1 (0.39%) SQL Server Reporting Services
Development Applications
1 27 (10.59%) JIRA
2 3 (1.18%) Axure RP
2 3 (1.18%) Balsamiq
2 3 (1.18%) Git
3 2 (0.78%) Jenkins
3 2 (0.78%) Selenium
4 1 (0.39%) Cucumber
4 1 (0.39%) Gradle
4 1 (0.39%) JMeter
4 1 (0.39%) JUnit
4 1 (0.39%) Maven
4 1 (0.39%) Sonatype Nexus
4 1 (0.39%) Spinnaker
4 1 (0.39%) TestNG
4 1 (0.39%) Yeoman
General
1 159 (62.35%) Social Skills
2 77 (30.20%) Finance
3 51 (20.00%) Inclusion and Diversity
4 49 (19.22%) Analytical Skills
5 31 (12.16%) Banking
6 29 (11.37%) Public Sector
7 21 (8.24%) Marketing
8 15 (5.88%) Presentation Skills
9 11 (4.31%) Law
9 11 (4.31%) Legal
9 11 (4.31%) Retail
10 10 (3.92%) Organisational Skills
11 7 (2.75%) Manufacturing
12 4 (1.57%) Advertising
12 4 (1.57%) Financial Institution
12 4 (1.57%) Influencing Skills
12 4 (1.57%) Local Government
13 3 (1.18%) Private Banking
13 3 (1.18%) Retail Banking
14 2 (0.78%) German Language
Job Titles
1 36 (14.12%) Analyst
2 32 (12.55%) Lead
3 27 (10.59%) Senior
4 25 (9.80%) Architect
5 22 (8.63%) Project Manager
6 15 (5.88%) Solutions Architect
7 10 (3.92%) Development Manager
7 10 (3.92%) Lead Architect
8 9 (3.53%) Business Analyst
8 9 (3.53%) Technical Director
9 8 (3.14%) Lead Solutions Architect
9 8 (3.14%) Senior Analyst
10 7 (2.75%) Data Analyst
10 7 (2.75%) Enterprise Management Architect
10 7 (2.75%) Enterprise Solutions Architect
10 7 (2.75%) Head of IT
10 7 (2.75%) Java Development Manager
11 6 (2.35%) Consultant
11 6 (2.35%) IT Manager
11 6 (2.35%) Technical Leader
Libraries, Frameworks & Software Standards
1 11 (4.31%) REST
2 8 (3.14%) React
3 5 (1.96%) SOAP
4 4 (1.57%) .NET
4 4 (1.57%) Lightning Web Components
5 3 (1.18%) EDI
5 3 (1.18%) RESTful
5 3 (1.18%) SailPoint
5 3 (1.18%) Web Services
6 2 (0.78%) Elastic Stack
6 2 (0.78%) Middleware
7 1 (0.39%) CSS
7 1 (0.39%) EJB
7 1 (0.39%) HTML
7 1 (0.39%) jQuery
7 1 (0.39%) Kafka
7 1 (0.39%) ModSecurity
7 1 (0.39%) PySpark
7 1 (0.39%) Visualforce
7 1 (0.39%) YANG
Miscellaneous
1 27 (10.59%) Product Ownership
2 19 (7.45%) Management Information System
3 11 (4.31%) Analytical Mindset
3 11 (4.31%) Renewable Energy
4 10 (3.92%) Onboarding
5 9 (3.53%) Data Centre
5 9 (3.53%) Distributed Systems
5 9 (3.53%) SCADA
6 8 (3.14%) Credit Risk
6 8 (3.14%) Market Risk
6 8 (3.14%) NHS
7 7 (2.75%) Legacy Systems
7 7 (2.75%) Tandem
8 6 (2.35%) Data Structures
8 6 (2.35%) Self-Motivation
8 6 (2.35%) Social Media
9 5 (1.96%) Legacy Applications
9 5 (1.96%) Virtual Team
10 4 (1.57%) Cloud Native
10 4 (1.57%) FMCG
Operating Systems
1 7 (2.75%) Windows
2 6 (2.35%) Android
2 6 (2.35%) Apple iOS
3 4 (1.57%) Linux
4 3 (1.18%) Windows Vista
5 1 (0.39%) Red Hat Enterprise Linux
5 1 (0.39%) Windows Server
Processes & Methodologies
1 80 (31.37%) Problem-Solving
2 74 (29.02%) Agile
3 66 (25.88%) Project Management
4 64 (25.10%) Stakeholder Management
5 55 (21.57%) Analytics
5 55 (21.57%) Continuous Improvement
6 47 (18.43%) Project Delivery
7 44 (17.25%) Decision-Making
8 36 (14.12%) Mentoring
9 34 (13.33%) DevOps
10 33 (12.94%) Business Intelligence
10 33 (12.94%) Business Strategy
10 33 (12.94%) Data Management
11 28 (10.98%) Roadmaps
12 26 (10.20%) CI/CD
13 25 (9.80%) Change Management
13 25 (9.80%) Risk Management
14 24 (9.41%) Data Analytics
14 24 (9.41%) Microservices
15 23 (9.02%) Data Protection
Programming Languages
1 22 (8.63%) SQL
2 21 (8.24%) JavaScript
3 14 (5.49%) Python
4 12 (4.71%) C#
5 9 (3.53%) Java
6 7 (2.75%) R
7 4 (1.57%) TypeScript
8 3 (1.18%) PowerShell
8 3 (1.18%) T-SQL
9 2 (0.78%) Bash
10 1 (0.39%) ABAP
10 1 (0.39%) Apex Code
10 1 (0.39%) VBA
Qualifications
1 65 (25.49%) Degree
2 28 (10.98%) Security Cleared
3 18 (7.06%) SC Cleared
4 10 (3.92%) PMI Certification
5 8 (3.14%) DBS Check
5 8 (3.14%) Microsoft Certification
6 7 (2.75%) PMP
7 6 (2.35%) CISSP
7 6 (2.35%) Master's Degree
8 4 (1.57%) Computer Science Degree
8 4 (1.57%) DV Cleared
8 4 (1.57%) ITIL Certification
9 3 (1.18%) CISM
9 3 (1.18%) PRINCE2 Practitioner
10 2 (0.78%) AWS Certification
10 2 (0.78%) AWS Certified Solutions Architect
10 2 (0.78%) Azure Certification
10 2 (0.78%) PgMP
10 2 (0.78%) Six Sigma Green Belt
11 1 (0.39%) RIBA
Quality Assurance & Compliance
1 24 (9.41%) Accessibility
2 22 (8.63%) GDPR
3 21 (8.24%) QA
4 11 (4.31%) Data Quality
5 10 (3.92%) PMO
6 9 (3.53%) WCAG
7 8 (3.14%) Basel III
7 8 (3.14%) IFRS
7 8 (3.14%) IFRS 9
8 7 (2.75%) Basel II
8 7 (2.75%) Dodd-Frank
8 7 (2.75%) ISO/IEC 27001
8 7 (2.75%) PCI DSS
9 3 (1.18%) Actionable Recommendations
9 3 (1.18%) NIST
10 2 (0.78%) Cyber Essentials
10 2 (0.78%) HIPAA
11 1 (0.39%) ISO 20022
11 1 (0.39%) ISO 8583
11 1 (0.39%) JSP 440
System Software
1 5 (1.96%) Docker
2 4 (1.57%) Active Directory
3 3 (1.18%) VMware ESXi
4 1 (0.39%) EMC RecoverPoint
4 1 (0.39%) Hyper-V
4 1 (0.39%) VMware Infrastructure
Systems Management
1 7 (2.75%) Kubernetes
2 4 (1.57%) Terraform
3 3 (1.18%) Grafana
3 3 (1.18%) vCenter Server
4 2 (0.78%) Ansible
5 1 (0.39%) Computer Emergency Response Teams
5 1 (0.39%) Microsoft Intune
5 1 (0.39%) Progress Chef
5 1 (0.39%) Prometheus
5 1 (0.39%) Puppet
Vendors
1 53 (20.78%) Microsoft
2 14 (5.49%) SAP
3 12 (4.71%) Google
4 11 (4.31%) Cisco
4 11 (4.31%) Salesforce
5 9 (3.53%) Facebook
5 9 (3.53%) ServiceNow
5 9 (3.53%) YouTube
6 8 (3.14%) Adobe
7 7 (2.75%) IBM
8 5 (1.96%) Ariba
9 3 (1.18%) BeyondTrust
9 3 (1.18%) CyberArk
9 3 (1.18%) Dell
9 3 (1.18%) Epicor
9 3 (1.18%) Informatica
9 3 (1.18%) Okta
10 2 (0.78%) Infor
10 2 (0.78%) Siemens
10 2 (0.78%) Splunk