Electronics Jobs

Electronics
UK

The table below looks at the prevalence of the term Electronics in permanent job vacancies. Included is a benchmarking guide to the salaries offered in vacancies that cited Electronics over the 6 months leading up to 10 May 2025, comparing them to the same period in the previous two years.

6 months to
10 May 2025
Same period 2024 Same period 2023
Rank 49 188 254
Rank change year-on-year +139 +66 +49
Permanent jobs citing Electronics 2,673 1,561 1,451
As % of all permanent jobs advertised in the UK 4.90% 1.58% 1.43%
As % of the General category 7.11% 2.64% 2.10%
Number of salaries quoted 922 1,124 733
10th Percentile £37,574 £32,500 £30,000
25th Percentile £44,250 £38,500 £38,250
Median annual salary (50th Percentile) £62,000 £50,000 £50,000
Median % change year-on-year +24.00% - -4.76%
75th Percentile £70,600 £62,500 £65,000
90th Percentile £75,000 £72,500 £77,500
UK excluding London median annual salary £62,000 £50,000 £48,687
% change year-on-year +24.00% +2.70% +2.50%

All General Skills
UK

Electronics falls under the General Skills category. For comparison with the information above, the following table provides summary statistics for all permanent job vacancies requiring common skills.

Permanent vacancies with a requirement for common skills 37,576 59,215 69,122
As % of all permanent jobs advertised in the UK 68.87% 59.75% 68.21%
Number of salaries quoted 18,733 39,629 37,296
10th Percentile £27,500 £27,500 £32,500
25th Percentile £40,584 £36,250 £43,162
Median annual salary (50th Percentile) £55,000 £52,500 £60,000
Median % change year-on-year +4.76% -12.50% -
75th Percentile £75,000 £72,500 £82,500
90th Percentile £100,000 £92,500 £102,000
UK excluding London median annual salary £50,055 £47,500 £52,500
% change year-on-year +5.38% -9.52% +5.00%

Electronics
Job Vacancy Trend

Job postings citing Electronics as a proportion of all IT jobs advertised.
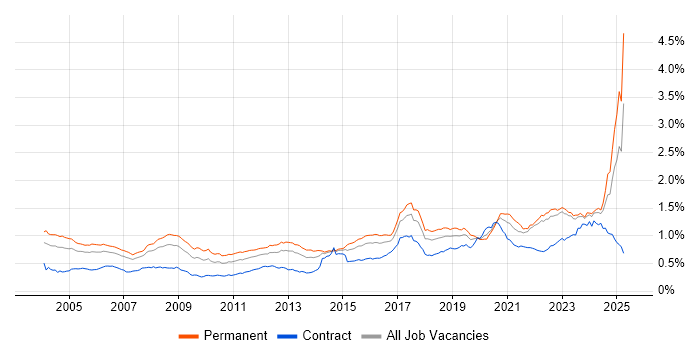
Job vacancy trend for Electronics in the UK

Electronics
Salary Trend

3-month moving average salary quoted in jobs citing Electronics.

Salary trend for Electronics in the UK

Electronics
Salary Histogram

Salary distribution for jobs citing Electronics over the 6 months to 10 May 2025.

Salary histogram for Electronics in the UK

Electronics
Top 17 Job Locations

The table below looks at the demand and provides a guide to the median salaries quoted in IT jobs citing Electronics within the UK over the 6 months to 10 May 2025. The 'Rank Change' column provides an indication of the change in demand within each location based on the same 6 month period last year.

Location Rank Change
on Same Period
Last Year
Matching
Permanent
IT Job Ads
Median Salary
Past 6 Months
Median Salary
% Change
on Same Period
Last Year
Live
Jobs
UK excluding London +112 2,435 £62,000 +24.00% 1,234
England +126 2,291 £62,000 +18.10% 1,331
South East +80 831 £62,000 +30.53% 396
East of England +43 481 £55,000 - 310
North of England +127 417 £47,683 -4.63% 176
Work from Home +110 383 £70,600 +34.48% 692
Yorkshire +138 302 £40,101 -19.80% 62
Midlands +83 290 £47,500 -9.52% 131
East Midlands +103 248 £40,101 -19.80% 49
South West +95 197 £40,101 -10.89% 161
Scotland +170 131 £47,500 - 72
North West +8 103 £47,683 +0.39% 87
Wales +61 89 £62,000 +24.00% 56
London +83 63 £70,000 +19.15% 242
West Midlands -24 41 £56,625 -1.52% 74
North East +53 11 £55,000 +2.33% 29
Northern Ireland +7 3 - - 12

Electronics
Co-occurring Skills and Capabilities by Category

The follow tables expand on the table above by listing co-occurrences grouped by category. The same employment type, locality and period is covered with up to 20 co-occurrences shown in each of the following categories:

Application Platforms
1 9 (0.34%) Kinematics
2 6 (0.22%) Confluence
3 5 (0.19%) SharePoint
4 2 (0.075%) Microsoft Exchange
4 2 (0.075%) Skype for Business
5 1 (0.037%) Apache
5 1 (0.037%) Apache Airflow
5 1 (0.037%) Mendix
Applications
1 181 (6.77%) Simulink
2 55 (2.06%) Microsoft Office
3 13 (0.49%) Microsoft Project
4 4 (0.15%) GNU Octave
5 3 (0.11%) Microsoft Excel
6 2 (0.075%) AutoCAD
6 2 (0.075%) Microsoft PowerPoint
6 2 (0.075%) MS Visio
7 1 (0.037%) Maple
7 1 (0.037%) OrCAD
7 1 (0.037%) SOLIDWORKS
Business Applications
1 146 (5.46%) Teamcenter
2 1 (0.037%) BASE24
2 1 (0.037%) LabWindows
2 1 (0.037%) SAP QM
Cloud Services
1 56 (2.10%) AWS
2 41 (1.53%) Azure
3 21 (0.79%) SaaS
4 11 (0.41%) GCP
4 11 (0.41%) Serverless
5 10 (0.37%) Amazon EC2
5 10 (0.37%) Amazon S3
5 10 (0.37%) Microsoft 365
6 8 (0.30%) Slack
7 7 (0.26%) GitHub
7 7 (0.26%) Virtual Private Cloud
8 6 (0.22%) Amazon ECR
8 6 (0.22%) Amazon EKS
9 4 (0.15%) Amazon SageMaker
9 4 (0.15%) AWS Lambda
10 3 (0.11%) Entra ID
10 3 (0.11%) Salesforce Service Cloud
11 2 (0.075%) Anthropic Claude
11 2 (0.075%) ChatGPT
11 2 (0.075%) OCI
Communications & Networking
1 764 (28.58%) Bluetooth
2 759 (28.40%) 5G
3 757 (28.32%) Wireless
4 754 (28.21%) Wi-Fi
5 745 (27.87%) LTE
6 737 (27.57%) GSM
7 730 (27.31%) UMTS
8 16 (0.60%) Ethernet
8 16 (0.60%) Modbus
8 16 (0.60%) WAN
9 15 (0.56%) SD-WAN
10 14 (0.52%) RS-485
10 14 (0.52%) TCP/IP
11 12 (0.45%) Profibus
12 11 (0.41%) RS-232
13 10 (0.37%) Firewall
14 8 (0.30%) VoIP
14 8 (0.30%) ZigBee
15 7 (0.26%) HTTP
15 7 (0.26%) VPN
Database & Business Intelligence
1 15 (0.56%) NoSQL
2 11 (0.41%) PostgreSQL
3 9 (0.34%) MySQL
4 8 (0.30%) SQL Server
5 7 (0.26%) MongoDB
5 7 (0.26%) RDBMS
5 7 (0.26%) Relational Database
6 6 (0.22%) Amazon QuickSight
7 4 (0.15%) Metadata
7 4 (0.15%) SQLite
8 2 (0.075%) Amazon RDS
8 2 (0.075%) Big Data
8 2 (0.075%) Oracle Exadata
9 1 (0.037%) Data Warehouse
9 1 (0.037%) DynamoDB
9 1 (0.037%) Flink
9 1 (0.037%) GIS
9 1 (0.037%) NonStop SQL
9 1 (0.037%) Oracle Database
9 1 (0.037%) Tableau
Development Applications
1 481 (17.99%) Rational DOORS
2 38 (1.42%) JIRA
3 36 (1.35%) Git
4 14 (0.52%) LabVIEW
5 10 (0.37%) Jenkins
5 10 (0.37%) Subversion
6 7 (0.26%) GitLab
7 5 (0.19%) Visual Studio
8 3 (0.11%) GDB
9 2 (0.075%) Rational Rhapsody
10 1 (0.037%) Bitbucket
10 1 (0.037%) Carbide.c++
10 1 (0.037%) CMake
10 1 (0.037%) Jasmine
10 1 (0.037%) MLflow
10 1 (0.037%) Oracle APEX
10 1 (0.037%) Protractor
10 1 (0.037%) VersaTest
10 1 (0.037%) webpack
10 1 (0.037%) WiX
General
1 723 (27.05%) Social Skills
2 505 (18.89%) Manufacturing
3 414 (15.49%) Marketing
4 278 (10.40%) Presentation Skills
5 224 (8.38%) Analytical Skills
6 217 (8.12%) Aerospace
7 135 (5.05%) Finance
8 115 (4.30%) Telecoms
9 103 (3.85%) Public Sector
10 66 (2.47%) Inclusion and Diversity
11 36 (1.35%) Automotive
11 36 (1.35%) Military
12 35 (1.31%) Aviation
13 34 (1.27%) Advertising
14 25 (0.94%) Law
15 22 (0.82%) Organisational Skills
16 14 (0.52%) Legal
17 13 (0.49%) Avionics
18 7 (0.26%) Billing
19 6 (0.22%) Agriculture
Job Titles
1 847 (31.69%) Electronics Engineer
2 739 (27.65%) Test Engineer
3 734 (27.46%) Electronics Test Engineer
4 518 (19.38%) Systems Engineer
5 431 (16.12%) Senior
6 376 (14.07%) Principal Engineer
7 194 (7.26%) Software Assurance Engineer
8 172 (6.43%) Principal Systems Engineer
9 168 (6.29%) Senior Systems Engineer
10 161 (6.02%) Junior
11 145 (5.42%) Junior Systems Engineer
12 141 (5.27%) Technical Manager
13 136 (5.09%) Help Desk Manager
14 120 (4.49%) Lead
15 109 (4.08%) Software Engineer
16 101 (3.78%) Products Support Manager
17 91 (3.40%) Support Manager
18 84 (3.14%) Senior Electrical Engineer
19 81 (3.03%) Design Engineer
20 80 (2.99%) Product Manager
Libraries, Frameworks & Software Standards
1 19 (0.71%) .NET
2 16 (0.60%) REST
3 13 (0.49%) Flask
4 12 (0.45%) React
5 10 (0.37%) HTML
5 10 (0.37%) JSON
5 10 (0.37%) Middleware
6 9 (0.34%) Node.js
7 8 (0.30%) Django
8 7 (0.26%) FastAPI
9 6 (0.22%) .NET Framework
9 6 (0.22%) ASP.NET
9 6 (0.22%) Lambda Expressions
9 6 (0.22%) pytest
10 5 (0.19%) AngularJS
10 5 (0.19%) CSS
11 4 (0.15%) .NET Core
11 4 (0.15%) Entity Framework
11 4 (0.15%) TensorFlow
11 4 (0.15%) Yocto
Miscellaneous
1 747 (27.95%) Driving Licence
2 389 (14.55%) Algorithms
3 115 (4.30%) Self-Motivation
4 63 (2.36%) Embedded Systems
5 58 (2.17%) IoT
6 43 (1.61%) SCADA
7 41 (1.53%) FPGA
8 32 (1.20%) Analogue Electronics
9 23 (0.86%) VHDL
10 22 (0.82%) Data Centre
10 22 (0.82%) Robotics
11 21 (0.79%) Legacy Systems
11 21 (0.79%) PMI
11 21 (0.79%) Renewable Energy
12 20 (0.75%) Manufacturing Execution System
12 20 (0.75%) Optoelectronics
13 19 (0.71%) Management Information System
14 16 (0.60%) Social Media
15 13 (0.49%) NB-IoT
15 13 (0.49%) Product Ownership
Operating Systems
1 66 (2.47%) Linux
2 52 (1.95%) Windows
3 15 (0.56%) Windows Server
4 13 (0.49%) Android
5 12 (0.45%) Apple iOS
6 11 (0.41%) FreeRTOS
7 5 (0.19%) Debian
7 5 (0.19%) Embedded Linux
7 5 (0.19%) Red Hat Enterprise Linux
7 5 (0.19%) Unix
8 4 (0.15%) Windows 10
9 3 (0.11%) Windows Server 2019
10 2 (0.075%) VMS
11 1 (0.037%) CentOS
11 1 (0.037%) Robot Operating System
11 1 (0.037%) Rocky
11 1 (0.037%) Solaris
11 1 (0.037%) Ubuntu
11 1 (0.037%) VxWorks
Processes & Methodologies
1 897 (33.56%) Mentoring
2 817 (30.56%) Validation
3 816 (30.53%) Systems Engineering
4 760 (28.43%) Coaching
4 760 (28.43%) Customer Requirements
5 747 (27.95%) Verification and Validation
6 734 (27.46%) Test Strategy
7 562 (21.03%) Problem-Solving
8 489 (18.29%) Physics
9 449 (16.80%) Mathematics
10 444 (16.61%) Continuous Improvement
11 398 (14.89%) Signal Processing
12 378 (14.14%) Technical Leadership
13 373 (13.95%) Software Engineering
14 329 (12.31%) Decision-Making
15 239 (8.94%) Software Assurance
16 235 (8.79%) Project Management
17 218 (8.16%) Computer Science
18 172 (6.43%) Test Planning
19 162 (6.06%) Model-Based Systems Engineering
Programming Languages
1 235 (8.79%) MATLAB
2 143 (5.35%) C
3 125 (4.68%) R
4 120 (4.49%) C++
5 100 (3.74%) Python
6 58 (2.17%) C#
7 31 (1.16%) Java
8 23 (0.86%) JavaScript
8 23 (0.86%) SQL
9 18 (0.67%) Embedded C
10 16 (0.60%) PowerShell
11 13 (0.49%) Bash
12 12 (0.45%) TypeScript
13 8 (0.30%) Embedded C++
14 7 (0.26%) VB
15 6 (0.22%) Perl
15 6 (0.22%) Tcl
16 5 (0.19%) Ada
17 4 (0.15%) Kotlin
17 4 (0.15%) PHP
Qualifications
1 1,555 (58.17%) Degree
2 922 (34.49%) BPSS Clearance
3 786 (29.41%) HND
4 113 (4.23%) Master's Degree
5 80 (2.99%) Security Cleared
6 43 (1.61%) DV Cleared
7 35 (1.31%) PMI Certification
8 31 (1.16%) Numerate Degree
9 27 (1.01%) SC Cleared
10 25 (0.94%) Computer Science Degree
11 22 (0.82%) CEH
12 17 (0.64%) CISSP
13 16 (0.60%) PMP
14 11 (0.41%) CompTIA Security+
14 11 (0.41%) Network+ Certification
15 9 (0.34%) HNC
16 7 (0.26%) PhD
17 3 (0.11%) DBS Check
17 3 (0.11%) Microsoft Certification
18 2 (0.075%) CCA
Quality Assurance & Compliance
1 347 (12.98%) ISO/IEC 15288
2 35 (1.31%) QA
3 23 (0.86%) DO-254
4 18 (0.67%) SLA
5 16 (0.60%) Cyber Essentials
5 16 (0.60%) Cyber Essentials PLUS
6 14 (0.52%) NIST
7 13 (0.49%) GDPR
7 13 (0.49%) ISO/IEC 27001
8 11 (0.41%) PMO
9 9 (0.34%) Def Stans
9 9 (0.34%) IEC 62304
9 9 (0.34%) ISO 13485
10 6 (0.22%) Data Quality
10 6 (0.22%) ISO 9001
10 6 (0.22%) JTAG
11 4 (0.15%) Automotive SPICE
11 4 (0.15%) ISO 26262
12 3 (0.11%) Accessibility
12 3 (0.11%) MISRA
System Software
1 99 (3.70%) Firmware
2 47 (1.76%) Embedded Firmware
3 12 (0.45%) VMware Infrastructure
3 12 (0.45%) vSphere
4 11 (0.41%) Docker
5 7 (0.26%) Citrix Hypervisor
6 4 (0.15%) Active Directory
Systems Management
1 24 (0.90%) Terraform
2 18 (0.67%) Kubernetes
3 14 (0.52%) Ansible
4 11 (0.41%) Puppet
5 6 (0.22%) Kustomize
6 4 (0.15%) Functional Safety
6 4 (0.15%) Microsoft Intune
6 4 (0.15%) SCCM
7 1 (0.037%) Data Guard
7 1 (0.037%) Kubeflow
7 1 (0.037%) Marathon
7 1 (0.037%) Oracle ZFS
Vendors
1 467 (17.47%) IBM
2 103 (3.85%) SAP
3 89 (3.33%) Microsoft
4 77 (2.88%) EMC
5 44 (1.65%) Siemens
6 31 (1.16%) Google
7 30 (1.12%) NetApp
8 28 (1.05%) Citrix
9 25 (0.94%) YouTube
10 23 (0.86%) Intel
10 23 (0.86%) Rockwell
11 17 (0.64%) Pure Storage
12 14 (0.52%) Dell
13 13 (0.49%) VMware
14 10 (0.37%) Oracle
15 9 (0.34%) Cisco
15 9 (0.34%) Mentor Graphics
16 8 (0.30%) Altera
16 8 (0.30%) Xilinx
17 7 (0.26%) Allen-Bradley