JavaScript Jobs with Hybrid/Remote/WFH Options

JavaScript (including ECMAScript)
UK > Work from Home

The table below provides summary statistics for permanent remote or hybrid work requiring JavaScript skills. It includes a benchmarking guide to the annual salaries offered in vacancies that cited JavaScript over the 6 months leading up to 30 June 2025, comparing them to the same period in the previous two years.

6 months to
30 Jun 2025
Same period 2024 Same period 2023
Rank 18 13 15
Rank change year-on-year -5 +2 -9
Permanent jobs citing JavaScript 2,167 4,125 4,501
As % of all permanent jobs with a WFH option 10.79% 11.96% 12.50%
As % of the Programming Languages category 30.74% 29.77% 26.41%
Number of salaries quoted 1,197 3,550 3,659
10th Percentile £41,250 £37,500 £40,000
25th Percentile £52,000 £45,000 £47,500
Median annual salary (50th Percentile) £66,340 £60,000 £62,500
Median % change year-on-year +10.57% -4.00% +4.17%
75th Percentile £93,750 £83,750 £82,500
90th Percentile £132,500 £122,500 £100,000
UK median annual salary £66,200 £60,000 £62,500
% change year-on-year +10.33% -4.00% +4.17%

All Programming Languages
Work from Home

JavaScript falls under the Programming Languages category. For comparison with the information above, the following table provides summary statistics for all permanent job vacancies with remote or hybrid options requiring coding skills.

Permanent vacancies with a requirement for coding skills 7,049 13,855 17,041
As % of all permanent jobs with a WFH option 35.10% 40.17% 47.32%
Number of salaries quoted 4,401 11,201 13,324
10th Percentile £38,869 £38,750 £41,000
25th Percentile £47,683 £46,250 £50,000
Median annual salary (50th Percentile) £62,500 £60,000 £65,000
Median % change year-on-year +4.17% -7.69% +4.00%
75th Percentile £83,750 £80,000 £85,000
90th Percentile £115,000 £104,000 £105,000
UK median annual salary £60,000 £60,000 £65,000
% change year-on-year - -7.69% +4.00%

JavaScript
Trend for Jobs with a WFH Option

Job vacancies with remote working options citing JavaScript as a proportion of all IT jobs advertised.
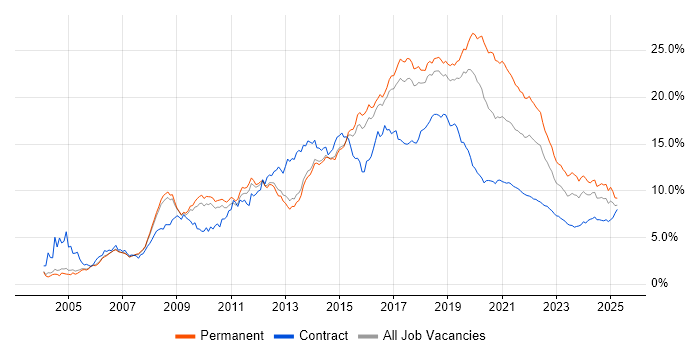
JavaScript trend for jobs with Hybrid/Remote/WFH options

JavaScript
Salary Trend for Jobs with a WFH Option

3-month moving average salary quoted in job vacancies with remote working options citing JavaScript.

JavaScript salary trend for jobs with a WFH option

JavaScript
Salary Histogram for Jobs with a WFH Option

Salary distribution for jobs with remote working options citing JavaScript over the 6 months to 30 June 2025.

JavaScript salary histogram for jobs with a WFH option

JavaScript
Co-occurring Skills and Capabilities with WFH Options by Category

The follow tables expand on the table above by listing co-occurrences grouped by category. The same employment type, locality and period is covered with up to 20 co-occurrences shown in each of the following categories:

Application Platforms
1 164 (7.57%) Confluence
2 152 (7.01%) Apache Airflow
3 74 (3.41%) Apache
4 50 (2.31%) CMS
5 39 (1.80%) WordPress
6 36 (1.66%) SharePoint
7 23 (1.06%) IIS
7 23 (1.06%) Jupyter
8 18 (0.83%) Umbraco
9 14 (0.65%) Drupal
10 11 (0.51%) Tomcat
11 7 (0.32%) Apache Solr
11 7 (0.32%) Headless CMS
12 6 (0.28%) nginx
13 3 (0.14%) ColdFusion
13 3 (0.14%) OpenEdge
14 2 (0.092%) Mendix
14 2 (0.092%) NServiceBus
14 2 (0.092%) Solana
15 1 (0.046%) Appian
Applications
1 126 (5.81%) Chatbot
2 16 (0.74%) Adobe XD
3 9 (0.42%) Microsoft Office
4 8 (0.37%) Photoshop
5 6 (0.28%) Adobe Creative Suite
5 6 (0.28%) Adobe Illustrator
5 6 (0.28%) Sketch
6 3 (0.14%) Trello
7 2 (0.092%) Elementor
7 2 (0.092%) InVision
8 1 (0.046%) Moqups
8 1 (0.046%) S-PLUS
Business Applications
1 46 (2.12%) Dynamics CRM
2 27 (1.25%) NetSuite
3 16 (0.74%) Magento
3 16 (0.74%) Shopify
4 11 (0.51%) JDE OneWorld
5 9 (0.42%) Sage 200
5 9 (0.42%) Sage 50
6 6 (0.28%) Infor CloudSuite
6 6 (0.28%) Infor CloudSuite Industrial (formerly SyteLine)
7 4 (0.18%) Oracle EBS
7 4 (0.18%) Sage 1000
8 2 (0.092%) Elite 3E
8 2 (0.092%) Odoo
9 1 (0.046%) Adobe Campaign
9 1 (0.046%) Dynamics NAV
9 1 (0.046%) Remedy ITSM
9 1 (0.046%) Salesforce CRM
9 1 (0.046%) SAP S/4HANA
Cloud Services
1 1,209 (55.79%) AWS
2 873 (40.29%) Azure
3 561 (25.89%) GCP
4 215 (9.92%) Pulumi
5 150 (6.92%) dbt
6 134 (6.18%) Serverless
7 120 (5.54%) Azure DevOps
8 100 (4.61%) AWS Lambda
9 88 (4.06%) Amazon S3
10 86 (3.97%) Power Platform
11 79 (3.65%) SaaS
12 73 (3.37%) AWS Step Functions
13 72 (3.32%) Snowflake
14 67 (3.09%) Power Automate
15 65 (3.00%) Dynamics 365
15 65 (3.00%) GitHub
16 64 (2.95%) Amazon EKS
17 63 (2.91%) PowerApps
18 59 (2.72%) AWS CloudFormation
19 42 (1.94%) Microsoft 365
Communications & Networking
1 289 (13.34%) Broadband
2 11 (0.51%) SSL
3 10 (0.46%) Internet
4 9 (0.42%) DMARC
5 8 (0.37%) Firewall
6 7 (0.32%) HTTP
7 3 (0.14%) DNS
7 3 (0.14%) TCP/IP
8 2 (0.092%) Multicast
8 2 (0.092%) Network Security
8 2 (0.092%) VLAN
9 1 (0.046%) FTP
9 1 (0.046%) SMTP
9 1 (0.046%) VPN
9 1 (0.046%) Wireless
Database & Business Intelligence
1 394 (18.18%) SQL Server
2 258 (11.91%) NoSQL
3 248 (11.44%) Relational Database
4 219 (10.11%) RDBMS
5 189 (8.72%) Elasticsearch
6 165 (7.61%) PostgreSQL
7 149 (6.88%) Amazon Athena
7 149 (6.88%) Apache Arrow
7 149 (6.88%) Apache Iceberg
7 149 (6.88%) Dremio
8 113 (5.21%) MySQL
9 77 (3.55%) DynamoDB
9 77 (3.55%) MongoDB
10 73 (3.37%) Apache Ignite
11 68 (3.14%) Data Lake
12 42 (1.94%) Azure SQL Database
13 40 (1.85%) Power BI
14 29 (1.34%) SQL Server Reporting Services
15 27 (1.25%) Big Data
16 23 (1.06%) Redis
Development Applications
1 308 (14.21%) JIRA
2 273 (12.60%) Selenium
3 270 (12.46%) Maven
4 263 (12.14%) Sonatype Nexus
5 262 (12.09%) SonarQube
6 261 (12.04%) Cucumber
7 257 (11.86%) GitLab
8 252 (11.63%) Bitbucket
9 251 (11.58%) Git
10 215 (9.92%) Jaeger
11 51 (2.35%) Jenkins
12 47 (2.17%) Visual Studio
13 34 (1.57%) Cypress.io
14 32 (1.48%) Team Foundation Server
14 32 (1.48%) webpack
15 31 (1.43%) Octopus Deploy
16 23 (1.06%) MSBuild
17 21 (0.97%) TeamCity
18 17 (0.78%) JUnit
18 17 (0.78%) NUnit
General
1 769 (35.49%) Inclusion and Diversity
2 662 (30.55%) Finance
3 409 (18.87%) Banking
4 231 (10.66%) Social Skills
5 217 (10.01%) Front Office
6 162 (7.48%) Investment Banking
7 153 (7.06%) Retail
8 118 (5.45%) Analytical Skills
9 90 (4.15%) Corporate Banking
10 68 (3.14%) Law
11 51 (2.35%) Marketing
12 36 (1.66%) Games
13 30 (1.38%) Public Sector
14 21 (0.97%) Manufacturing
15 20 (0.92%) Organisational Skills
16 16 (0.74%) Presentation Skills
16 16 (0.74%) Tech for Good
17 12 (0.55%) iGaming
18 11 (0.51%) Advertising
18 11 (0.51%) Electronics
Job Titles
1 879 (40.56%) Developer
2 769 (35.49%) Software Engineer
3 556 (25.66%) Senior
4 357 (16.47%) Lead
5 271 (12.51%) Senior Software Engineer
6 221 (10.20%) Team Leader
7 208 (9.60%) Senior Developer
8 162 (7.48%) AWS Developer
9 156 (7.20%) AWS Engineer
10 149 (6.88%) AWS Software Engineer
11 142 (6.55%) Developer/Software Engineer
12 133 (6.14%) Full-Stack Developer
13 121 (5.58%) Python Engineer
14 114 (5.26%) Python Software Engineer
15 107 (4.94%) Trainer
16 102 (4.71%) Java Engineer
17 101 (4.66%) Software Developer
18 99 (4.57%) Java Software Engineer
19 85 (3.92%) .NET Developer
20 77 (3.55%) Front-End Developer (Client-Side Developer)
Libraries, Frameworks & Software Standards
1 833 (38.44%) React
2 822 (37.93%) HTML
3 634 (29.26%) CSS
4 543 (25.06%) .NET
5 519 (23.95%) Node.js
6 340 (15.69%) Redux
7 305 (14.07%) AngularJS
8 290 (13.38%) Kafka
9 284 (13.11%) Spring Boot
10 282 (13.01%) Spring
11 250 (11.54%) JPA
12 226 (10.43%) RESTful
13 221 (10.20%) Elastic Stack
14 218 (10.06%) REST
15 215 (9.92%) OpenTelemetry
16 212 (9.78%) Vue
17 209 (9.64%) Pandas
18 194 (8.95%) HTML5
19 184 (8.49%) Hibernate
20 160 (7.38%) CSS3
Miscellaneous
1 323 (14.91%) Product Ownership
2 272 (12.55%) Enterprise Software
3 250 (11.54%) Cyberattack
4 210 (9.69%) Fixed Income
5 196 (9.04%) Self-Motivation
6 184 (8.49%) Linux Command Line
7 163 (7.52%) Equities
8 160 (7.38%) Foreign Exchange (FX)
9 91 (4.20%) Hedge funds
10 71 (3.28%) Derivative
11 58 (2.68%) Mobile App
12 56 (2.58%) Pricing Data
13 55 (2.54%) Cloud Native
14 44 (2.03%) Algorithms
15 30 (1.38%) Virtual Team
16 27 (1.25%) Distributed Systems
17 26 (1.20%) Greenfield Project
18 24 (1.11%) Data Structures
19 17 (0.78%) Public Cloud
20 13 (0.60%) Legacy Systems
Operating Systems
1 522 (24.09%) Linux
2 245 (11.31%) Unix
3 85 (3.92%) Android
4 35 (1.62%) Windows
5 28 (1.29%) Apple iOS
6 11 (0.51%) Windows Server
7 3 (0.14%) CentOS
7 3 (0.14%) Ubuntu
8 2 (0.092%) Embedded Linux
8 2 (0.092%) Rocky
9 1 (0.046%) Debian
Processes & Methodologies
1 1,378 (63.59%) Agile
2 978 (45.13%) Software Engineering
3 723 (33.36%) DevOps
4 704 (32.49%) Mentoring
5 643 (29.67%) Microservices
6 601 (27.73%) CI/CD
7 556 (25.66%) Containerisation
8 526 (24.27%) Performance Optimisation
9 519 (23.95%) Full-Stack Development
10 475 (21.92%) User Experience
11 397 (18.32%) Test Automation
12 396 (18.27%) Front End Development
13 340 (15.69%) Continuous Integration
14 332 (15.32%) SDLC
15 317 (14.63%) Artificial Intelligence
16 303 (13.98%) Clean Code
17 287 (13.24%) Roadmaps
18 284 (13.11%) Scrum
19 279 (12.87%) TDD
20 268 (12.37%) Machine Learning
Programming Languages
1 1,055 (48.68%) Python
2 1,001 (46.19%) Java
3 745 (34.38%) SQL
4 690 (31.84%) TypeScript
5 541 (24.97%) C#
6 487 (22.47%) Go
7 392 (18.09%) C++
8 283 (13.06%) Rust
9 226 (10.43%) Bash
10 181 (8.35%) PHP
11 65 (3.00%) Ruby
12 61 (2.81%) C
13 53 (2.45%) R
14 52 (2.40%) MATLAB
15 50 (2.31%) Dart
16 40 (1.85%) PowerShell
17 22 (1.02%) T-SQL
18 13 (0.60%) VB.NET
18 13 (0.60%) VBA
19 12 (0.55%) PL/SQL
Qualifications
1 468 (21.60%) AWS Certification
2 308 (14.21%) Degree
3 305 (14.07%) Security Cleared
4 254 (11.72%) DV Cleared
5 178 (8.21%) AWS Certified Developer
5 178 (8.21%) AWS Certified Solutions Architect
6 127 (5.86%) Computer Science Degree
7 43 (1.98%) SC Cleared
8 20 (0.92%) Microsoft Certification
9 14 (0.65%) ISTQB
10 8 (0.37%) Master's Degree
11 7 (0.32%) Numerate Degree
12 4 (0.18%) ISTQB Foundation Certification
13 2 (0.092%) ACCA
13 2 (0.092%) AWS Certified DevOps Engineer
13 2 (0.092%) Azure Certification
13 2 (0.092%) TOGAF Certification
14 1 (0.046%) BC Cleared
14 1 (0.046%) Linux+ Certification
14 1 (0.046%) Network+ Certification
Quality Assurance & Compliance
1 349 (16.11%) QA
2 155 (7.15%) Accessibility
3 36 (1.66%) GDPR
4 23 (1.06%) ISO/IEC 27001
5 18 (0.83%) WCAG
6 3 (0.14%) Data Quality
7 2 (0.092%) GRC
8 1 (0.046%) HIPAA
8 1 (0.046%) ISO 9001
8 1 (0.046%) NCSC
System Software
1 684 (31.56%) Docker
2 11 (0.51%) Active Directory
3 3 (0.14%) VMware Infrastructure
4 1 (0.046%) KVM
Systems Management
1 629 (29.03%) Kubernetes
2 314 (14.49%) Terraform
3 274 (12.64%) Ansible
4 219 (10.11%) Prometheus
5 217 (10.01%) Kustomize
6 216 (9.97%) Argo
7 30 (1.38%) Single Sign-On
8 11 (0.51%) Istio
9 9 (0.42%) Grafana
9 9 (0.42%) Microsoft Intune
10 3 (0.14%) Kibana
11 2 (0.092%) Nagios
11 2 (0.092%) Red Hat Satellite
12 1 (0.046%) Check_MK
12 1 (0.046%) FortiGate
12 1 (0.046%) HP Quality Center
12 1 (0.046%) HP UCMDB
12 1 (0.046%) logstash
12 1 (0.046%) Progress Chef
12 1 (0.046%) Puppet
Vendors
1 249 (11.49%) Microsoft
2 247 (11.40%) Google
2 247 (11.40%) Solace
3 117 (5.40%) PayPal
4 39 (1.80%) ServiceNow
5 32 (1.48%) Adobe
6 31 (1.43%) Oracle
7 25 (1.15%) Salesforce
8 13 (0.60%) Dell
8 13 (0.60%) Sage
9 11 (0.51%) MuleSoft
10 10 (0.46%) Rollbar
11 8 (0.37%) Cisco
11 8 (0.37%) HubSpot
12 7 (0.32%) DevExpress
13 6 (0.28%) Facebook
13 6 (0.28%) Guidewire
13 6 (0.28%) IBM
13 6 (0.28%) Infor
13 6 (0.28%) Twitter