Retail Jobs with Hybrid/Remote/WFH Options

Retailing
UK > Work from Home

The table below looks at the prevalence of the term Retail in remote or hybrid work. Included is a benchmarking guide to the salaries offered in vacancies that cited Retail over the 6 months leading up to 22 May 2025, comparing them to the same period in the previous two years.

6 months to
22 May 2025
Same period 2024 Same period 2023
Rank 36 49 33
Rank change year-on-year +13 -16 +23
Permanent jobs citing Retail 1,256 1,747 2,993
As % of all permanent jobs with a WFH option 6.76% 5.17% 7.42%
As % of the General category 8.64% 8.37% 11.24%
Number of salaries quoted 424 1,008 1,627
10th Percentile £30,150 £26,250 £35,000
25th Percentile £40,375 £39,500 £46,454
Median annual salary (50th Percentile) £55,000 £48,000 £62,500
Median % change year-on-year +14.58% -23.20% +8.70%
75th Percentile £68,568 £64,963 £77,715
90th Percentile £83,750 £86,250 £97,328
UK median annual salary £50,000 £47,500 £60,000
% change year-on-year +5.26% -20.83% +4.35%

All General Skills
Work from Home

Retail falls under the General Skills category. For comparison with the information above, the following table provides summary statistics for all permanent job vacancies with remote or hybrid options requiring common skills.

Permanent vacancies with a requirement for common skills 14,536 20,862 26,627
As % of all permanent jobs with a WFH option 78.26% 61.70% 65.97%
Number of salaries quoted 7,301 15,086 17,739
10th Percentile £25,087 £31,800 £36,250
25th Percentile £39,926 £41,500 £46,570
Median annual salary (50th Percentile) £55,000 £55,000 £62,500
Median % change year-on-year - -12.00% +4.17%
75th Percentile £76,840 £75,000 £83,125
90th Percentile £105,000 £95,000 £103,750
UK median annual salary £55,000 £52,500 £60,000
% change year-on-year +4.76% -12.50% -

Retail
Trend for Jobs with a WFH Option

Job vacancies with remote working options citing Retail as a proportion of all IT jobs advertised.
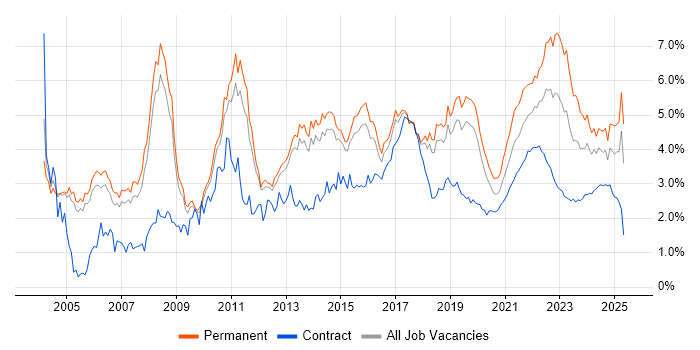
Retail trend for jobs with Hybrid/Remote/WFH options

Retail
Salary Trend for Jobs with a WFH Option

3-month moving average salary quoted in job vacancies with remote working options citing Retail.

Retail salary trend for jobs with a WFH option

Retail
Salary Histogram for Jobs with a WFH Option

Salary distribution for jobs with remote working options citing Retail over the 6 months to 22 May 2025.

Retail salary histogram for jobs with a WFH option

Retail
Co-occurring Skills and Capabilities with WFH Options by Category

The follow tables expand on the table above by listing co-occurrences grouped by category. The same employment type, locality and period is covered with up to 20 co-occurrences shown in each of the following categories:

Application Platforms
1 26 (2.07%) Apache Spark
2 22 (1.75%) Microsoft Exchange
3 7 (0.56%) WordPress
4 6 (0.48%) CMS
5 5 (0.40%) Apache Airflow
5 5 (0.40%) SharePoint
6 4 (0.32%) Confluence
7 3 (0.24%) Apache
7 3 (0.24%) ColdFusion
7 3 (0.24%) SAS
8 2 (0.16%) Headless CMS
8 2 (0.16%) OpenStack
9 1 (0.080%) EPiServer
9 1 (0.080%) IIS
9 1 (0.080%) Strapi
9 1 (0.080%) Umbraco
Applications
1 42 (3.34%) Microsoft Excel
2 37 (2.95%) Microsoft PowerPoint
3 29 (2.31%) Microsoft Office
4 9 (0.72%) Acrobat
5 5 (0.40%) Revit
6 4 (0.32%) Adobe Creative Suite
7 3 (0.24%) Chatbot
7 3 (0.24%) Microsoft Project
8 2 (0.16%) Adobe After Effects
8 2 (0.16%) Adobe Illustrator
8 2 (0.16%) CINEMA 4D
8 2 (0.16%) Photoshop
9 1 (0.080%) Adobe Premiere
9 1 (0.080%) AutoCAD
9 1 (0.080%) Blender
9 1 (0.080%) InDesign
Business Applications
1 27 (2.15%) Shopify
2 18 (1.43%) Magento
3 11 (0.88%) Payment Gateway
4 9 (0.72%) Dynamics CRM
5 3 (0.24%) ResourceLink
6 2 (0.16%) SAP S/4HANA
7 1 (0.080%) Infor M3
7 1 (0.080%) Oracle ERP
7 1 (0.080%) Oracle Payables
Cloud Services
1 209 (16.64%) Azure
2 146 (11.62%) AWS
3 52 (4.14%) Power Platform
4 38 (3.03%) Azure DevOps
5 37 (2.95%) Microsoft 365
6 29 (2.31%) SaaS
7 25 (1.99%) Azure Service Bus
8 24 (1.91%) Google Analytics
9 23 (1.83%) Azure Cosmos DB
9 23 (1.83%) SonarCloud
10 16 (1.27%) GitHub
10 16 (1.27%) Google Ads
11 15 (1.19%) BigCommerce
12 14 (1.11%) Serverless
13 13 (1.04%) Google Tag Manager
14 11 (0.88%) OneDrive
15 10 (0.80%) GCP
16 9 (0.72%) Google Workspace
17 7 (0.56%) Dynamics 365
17 7 (0.56%) PowerApps
Communications & Networking
1 19 (1.51%) HTTP
2 9 (0.72%) Firewall
2 9 (0.72%) Intranet
2 9 (0.72%) WAN
3 5 (0.40%) DNS
4 4 (0.32%) DHCP
4 4 (0.32%) Intrusion Detection
4 4 (0.32%) VPN
5 3 (0.24%) 5G
5 3 (0.24%) Cisco ASA
5 3 (0.24%) Cisco Firepower
5 3 (0.24%) Cisco Nexus
5 3 (0.24%) SD-WAN
5 3 (0.24%) VSAN
6 2 (0.16%) TCP/IP
7 1 (0.080%) Internet
7 1 (0.080%) IPv4
7 1 (0.080%) IPv6
7 1 (0.080%) LAN
7 1 (0.080%) SSL
Database & Business Intelligence
1 125 (9.95%) SQL Server
2 47 (3.74%) Tableau
3 41 (3.26%) Power BI
4 25 (1.99%) Data Mining
5 23 (1.83%) Elasticsearch
6 18 (1.43%) BusinessObjects
7 14 (1.11%) MySQL
8 9 (0.72%) Relational Database
9 8 (0.64%) Data Warehouse
9 8 (0.64%) MongoDB
9 8 (0.64%) Power Query
10 5 (0.40%) Data Lake
10 5 (0.40%) NoSQL
11 4 (0.32%) Big Data
11 4 (0.32%) Metadata
11 4 (0.32%) Metadata Repository
11 4 (0.32%) Oracle BI Publisher
11 4 (0.32%) PostgreSQL
11 4 (0.32%) PowerPivot
11 4 (0.32%) QlikView
Development Applications
1 107 (8.52%) JIRA
2 97 (7.72%) GitLab
3 92 (7.32%) Maven
4 90 (7.17%) Bitbucket
4 90 (7.17%) Cucumber
4 90 (7.17%) Selenium
4 90 (7.17%) SonarQube
4 90 (7.17%) Sonatype Nexus
5 82 (6.53%) Git
6 40 (3.18%) Visual Studio
7 29 (2.31%) Octopus Deploy
8 24 (1.91%) Team Foundation Server
9 23 (1.83%) MSBuild
10 7 (0.56%) webpack
11 6 (0.48%) TeamCity
12 5 (0.40%) Grunt
12 5 (0.40%) gulp
13 4 (0.32%) Bazaar
14 3 (0.24%) Vite
15 2 (0.16%) Gradle
General
1 582 (46.34%) Manufacturing
2 259 (20.62%) Finance
3 235 (18.71%) Social Skills
4 196 (15.61%) Dutch Language
4 196 (15.61%) Finnish Language
5 195 (15.53%) Analytical Skills
6 149 (11.86%) Inclusion and Diversity
7 114 (9.08%) Banking
8 90 (7.17%) Corporate Banking
8 90 (7.17%) Investment Banking
9 77 (6.13%) Marketing
10 49 (3.90%) Catalan Language
11 42 (3.34%) Presentation Skills
12 39 (3.11%) Legal
13 29 (2.31%) Games
14 28 (2.23%) Advertising
14 28 (2.23%) Organisational Skills
15 19 (1.51%) Public Sector
16 15 (1.19%) Law
17 11 (0.88%) Back Office
Job Titles
1 541 (43.07%) Trainer
2 125 (9.95%) Senior
3 118 (9.39%) Software Engineer
4 101 (8.04%) Developer
5 93 (7.40%) Analyst
6 41 (3.26%) Architect
6 41 (3.26%) Data Analyst
6 41 (3.26%) Senior Analyst
7 26 (2.07%) IT Manager
7 26 (2.07%) Lead
7 26 (2.07%) Project Manager
7 26 (2.07%) Senior Data Analyst
7 26 (2.07%) Senior Developer
7 26 (2.07%) Technical Architect
8 25 (1.99%) .NET Developer
9 24 (1.91%) Junior
10 23 (1.83%) Junior Developer
11 22 (1.75%) Senior Software Engineer
12 16 (1.27%) C# Developer
12 16 (1.27%) Technical Support
Libraries, Frameworks & Software Standards
1 150 (11.94%) HTML
2 143 (11.39%) CSS
3 115 (9.16%) Kafka
3 115 (9.16%) REST
4 105 (8.36%) React
4 105 (8.36%) RESTful
5 94 (7.48%) CSS3
5 94 (7.48%) HTML5
6 93 (7.40%) Spring Boot
7 91 (7.25%) Sass
7 91 (7.25%) Spring
8 90 (7.17%) Jest
8 90 (7.17%) JPA
8 90 (7.17%) Redux
9 71 (5.65%) .NET
10 43 (3.42%) ASP.NET
11 32 (2.55%) JSON
12 31 (2.47%) XML
13 30 (2.39%) Bootstrap
14 23 (1.83%) gRPC
Miscellaneous
1 539 (42.91%) Robotics
2 100 (7.96%) Product Ownership
3 91 (7.25%) Enterprise Software
4 30 (2.39%) Data Structures
5 25 (1.99%) EPoS
6 23 (1.83%) Onboarding
7 22 (1.75%) Distributed Systems
7 22 (1.75%) Driving Licence
8 17 (1.35%) Greenfield Project
8 17 (1.35%) Management Information System
9 16 (1.27%) Data Protection Act
10 13 (1.04%) Social Media
11 11 (0.88%) Mobile App
11 11 (0.88%) Security Posture
12 10 (0.80%) e-Learning
12 10 (0.80%) FMCG
13 9 (0.72%) Cloud Native
13 9 (0.72%) Manufacturing Execution System
14 8 (0.64%) Public Cloud
15 6 (0.48%) Security Operations Centre
Operating Systems
1 14 (1.11%) Linux
2 12 (0.96%) Mac OS
3 10 (0.80%) Windows
4 4 (0.32%) Windows Server
5 1 (0.080%) Android
5 1 (0.080%) Solaris
5 1 (0.080%) Unix
Processes & Methodologies
1 713 (56.77%) Problem-Solving
2 574 (45.70%) Data Privacy
3 566 (45.06%) Machine Learning
4 557 (44.35%) Artificial Intelligence
5 542 (43.15%) Generative AI
6 539 (42.91%) LLM
6 539 (42.91%) Red Team
7 193 (15.37%) Agile
8 167 (13.30%) DevOps
9 145 (11.54%) Microservices
10 143 (11.39%) Mentoring
10 143 (11.39%) Software Engineering
11 123 (9.79%) Performance Optimisation
12 119 (9.47%) CI/CD
13 114 (9.08%) Full-Stack Development
14 112 (8.92%) Analytics
15 109 (8.68%) Strategic Thinking
16 106 (8.44%) SDLC
17 104 (8.28%) Containerisation
18 103 (8.20%) Front End Development
Programming Languages
1 246 (19.59%) SQL
2 164 (13.06%) JavaScript
3 101 (8.04%) Java
4 92 (7.32%) TypeScript
5 91 (7.25%) Python
6 79 (6.29%) C#
7 20 (1.59%) Scala
8 19 (1.51%) VBA
9 12 (0.96%) R
10 10 (0.80%) PHP
11 9 (0.72%) C-shell
11 9 (0.72%) Korn
11 9 (0.72%) Shell Script
12 8 (0.64%) PL/SQL
13 7 (0.56%) Delphi
14 5 (0.40%) C++
14 5 (0.40%) Data Analysis Expressions
15 4 (0.32%) Go
16 3 (0.24%) C
16 3 (0.24%) MATLAB
Qualifications
1 676 (53.82%) Degree
2 59 (4.70%) DBS Check
3 28 (2.23%) Security Cleared
4 22 (1.75%) SC Cleared
5 19 (1.51%) Computer Science Degree
6 17 (1.35%) CISSP
7 16 (1.27%) Master's Degree
8 14 (1.11%) CISM
9 13 (1.04%) PhD
10 11 (0.88%) AWS Certification
10 11 (0.88%) Azure Certification
10 11 (0.88%) HNC
11 9 (0.72%) HND
11 9 (0.72%) PMI Certification
12 6 (0.48%) Numerate Degree
13 5 (0.40%) Cisco Certification
13 5 (0.40%) ITIL Certification
13 5 (0.40%) TOGAF Certification
14 4 (0.32%) CISA
14 4 (0.32%) PMP
Quality Assurance & Compliance
1 109 (8.68%) QA
2 101 (8.04%) Accessibility
3 48 (3.82%) GDPR
4 20 (1.59%) ISO/IEC 27001
5 13 (1.04%) Data Quality
5 13 (1.04%) PCI DSS
6 11 (0.88%) Cyber Essentials
7 9 (0.72%) PERC
8 8 (0.64%) PMO
9 6 (0.48%) SLA
10 5 (0.40%) NIST
11 4 (0.32%) GRC
12 3 (0.24%) WCAG
13 2 (0.16%) ISO/IEC 27002 (supersedes ISO/IEC 17799)
13 2 (0.16%) NEBOSH
14 1 (0.080%) Actionable Recommendations
14 1 (0.080%) Cyber Essentials PLUS
14 1 (0.080%) Government Security Classifications
14 1 (0.080%) ISO/IEC 27005
System Software
1 127 (10.11%) Docker
2 21 (1.67%) Active Directory
3 16 (1.27%) VMware Infrastructure
4 4 (0.32%) VMware ESXi
5 1 (0.080%) Embedded Firmware
5 1 (0.080%) Firmware
5 1 (0.080%) LXC
5 1 (0.080%) Samba
5 1 (0.080%) Varnish
5 1 (0.080%) Virtual Desktop
5 1 (0.080%) VMware NSX
Systems Management
1 102 (8.12%) Kubernetes
2 12 (0.96%) Microsoft Intune
3 5 (0.40%) Terraform
4 4 (0.32%) Ansible
5 2 (0.16%) Progress Chef
5 2 (0.16%) Puppet
6 1 (0.080%) Avamar
6 1 (0.080%) Grafana
6 1 (0.080%) Prometheus
6 1 (0.080%) Single Sign-On
6 1 (0.080%) vCenter Server
6 1 (0.080%) VxRail
Vendors
1 620 (49.36%) Google
2 586 (46.66%) Databricks
3 577 (45.94%) Adobe
4 148 (11.78%) Microsoft
5 90 (7.17%) Solace
6 40 (3.18%) TikTok
7 26 (2.07%) Facebook
8 20 (1.59%) Oracle
9 19 (1.51%) Apple
10 17 (1.35%) VMware
11 15 (1.19%) Pinterest
12 11 (0.88%) Instagram
12 11 (0.88%) Salesforce
13 10 (0.80%) Cisco
14 9 (0.72%) OneTrust
15 8 (0.64%) Ahrefs
16 6 (0.48%) SAP
17 5 (0.40%) Twitter
18 4 (0.32%) Hotjar
18 4 (0.32%) WooCommerce