Platform Engineer Jobs

Platform Engineer
UK

The median Platform Engineer salary in the UK is £71,000 per year, according to job vacancies posted during the 6 months leading to 28 May 2025.

The table below provides salary benchmarking and summary statistics, comparing them to the same period in the previous two years.

6 months to
28 May 2025
Same period 2024 Same period 2023
Rank 408 486 520
Rank change year-on-year +78 +34 +153
Permanent jobs requiring a Platform Engineer 330 482 520
As % of all permanent jobs advertised in the UK 0.60% 0.47% 0.53%
As % of the Job Titles category 0.67% 0.50% 0.58%
Number of salaries quoted 199 267 365
10th Percentile - £52,000 £43,750
25th Percentile £56,176 £60,650 £54,500
Median annual salary (50th Percentile) £71,000 £75,000 £70,000
Median % change year-on-year -5.33% +7.14% +7.69%
75th Percentile £88,125 £93,750 £87,500
90th Percentile £101,750 £112,500 £102,500
UK excluding London median annual salary £57,560 £60,000 £65,351
% change year-on-year -4.07% -8.19% +18.82%

All Permanent IT Job Vacancies
UK

For comparison with the information above, the following table provides summary statistics for all permanent IT job vacancies. Most job vacancies include a discernible job title that can be normalized. As such, the figures in the second row provide an indication of the number of permanent jobs in our overall sample.

Permanent vacancies in the UK with a recognized job title 49,435 96,820 89,564
% of permanent jobs with a recognized job title 90.41% 94.78% 91.46%
Number of salaries quoted 25,727 69,155 56,824
10th Percentile £28,822 £28,500 £32,500
25th Percentile £41,000 £38,500 £45,000
Median annual salary (50th Percentile) £55,000 £52,500 £60,000
Median % change year-on-year +4.76% -12.50% -
75th Percentile £73,750 £70,000 £80,000
90th Percentile £96,250 £90,000 £100,000
UK excluding London median annual salary £51,399 £50,000 £53,500
% change year-on-year +2.80% -6.54% +6.63%

Platform Engineer
Job Vacancy Trend

Job postings that featured Platform Engineer in the job title as a proportion of all IT jobs advertised.
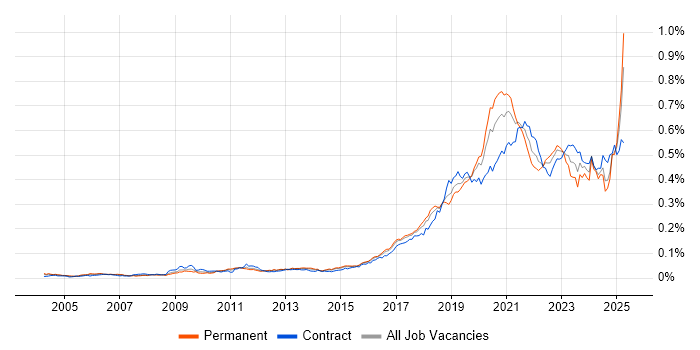
Job vacancy trend for Platform Engineer in the UK

Platform Engineer
Salary Trend

3-month moving average salary quoted in jobs citing Platform Engineer.

Salary trend for Platform Engineer in the UK

Platform Engineer
Salary Histogram

Salary distribution for jobs citing Platform Engineer over the 6 months to 28 May 2025.

Salary histogram for Platform Engineer in the UK

Platform Engineer
Top 15 Job Locations

The table below looks at the demand and provides a guide to the median salaries quoted in IT jobs citing Platform Engineer within the UK over the 6 months to 28 May 2025. The 'Rank Change' column provides an indication of the change in demand within each location based on the same 6 month period last year.

Location Rank Change
on Same Period
Last Year
Matching
Permanent
IT Job Ads
Median Salary
Past 6 Months
Median Salary
% Change
on Same Period
Last Year
Live
Jobs
England +84 324 £71,000 -5.33% 304
UK excluding London +112 195 £57,560 -4.07% 206
North of England +59 147 £57,560 -4.07% 62
North West +55 141 £57,560 -7.90% 41
London +81 122 £82,500 -2.94% 153
Work from Home +44 63 £72,500 -3.33% 170
South East +82 23 £71,750 +19.58% 66
West Midlands +55 11 £75,000 +7.14% 13
Midlands +33 11 £75,000 +15.38% 18
South West +86 6 £82,626 +22.41% 26
East of England +35 5 £77,500 -3.13% 19
Yorkshire +19 5 £65,000 +8.33% 16
Wales +39 2 £63,250 +17.67% 2
Scotland +79 1 - - 11
North East +37 1 £75,500 -5.63% 6

Platform Engineer Skill Set
Top 30 Co-occurring Skills and Capabilities

For the 6 months to 28 May 2025, Platform Engineer job roles required the following skills and capabilities in order of popularity. The figures indicate the absolute number co-occurrences and as a proportion of all permanent job ads featuring Platform Engineer in the job title.

1 261 (79.09%) Platform Engineering
2 146 (44.24%) Degree
3 128 (38.79%) Python
4 122 (36.97%) BPSS Clearance
5 121 (36.67%) Terraform
6 112 (33.94%) CI/CD
7 109 (33.03%) Azure
8 103 (31.21%) AWS
9 99 (30.00%) Infrastructure as Code
10 97 (29.39%) Agile
11 96 (29.09%) Kubernetes
12 89 (26.97%) DevOps
13 84 (25.45%) Ansible
14 79 (23.94%) Mentoring
15 77 (23.33%) Docker
16 68 (20.61%) Stakeholder Engagement
17 65 (19.70%) Rational DOORS
17 65 (19.70%) ArchiMate
17 65 (19.70%) Teamcenter
17 65 (19.70%) MODAF
17 65 (19.70%) SysML
17 65 (19.70%) TOGAF
17 65 (19.70%) Model-Based Systems Engineering
17 65 (19.70%) Programme Delivery
17 65 (19.70%) TOGAF Certification
17 65 (19.70%) Sparx
17 65 (19.70%) Sparx Enterprise Architect
17 65 (19.70%) Product Ownership
18 63 (19.09%) Linux
19 57 (17.27%) Microsoft Office

Platform Engineer Skill Set
Co-occurring Skills and Capabilities by Category

The follow tables expand on the table above by listing co-occurrences grouped by category. The same employment type, locality and period is covered with up to 20 co-occurrences shown in each of the following categories:

Application Platforms
1 9 (2.73%) Apache Spark
2 7 (2.12%) Apache Airflow
2 7 (2.12%) IBM Domino
2 7 (2.12%) Microsoft Exchange
3 6 (1.82%) Confluence
4 5 (1.52%) Apache
4 5 (1.52%) SharePoint
5 2 (0.61%) Jupyter
5 2 (0.61%) nginx
6 1 (0.30%) Apache Pulsar
6 1 (0.30%) IIS
Applications
1 57 (17.27%) Microsoft Office
2 5 (1.52%) Mozilla Thunderbird
Business Applications
1 65 (19.70%) Sparx Enterprise Architect
1 65 (19.70%) Teamcenter
2 1 (0.30%) Dynamics CRM
Cloud Services
1 109 (33.03%) Azure
2 103 (31.21%) AWS
3 55 (16.67%) GCP
4 25 (7.58%) GitHub
4 25 (7.58%) Pulumi
5 23 (6.97%) AWS CloudFormation
5 23 (6.97%) PaaS
6 21 (6.36%) Amazon S3
7 18 (5.45%) Virtual Private Cloud
8 17 (5.15%) Azure DevOps
9 15 (4.55%) Amazon CloudWatch
9 15 (4.55%) Amazon EC2
10 14 (4.24%) Microsoft 365
10 14 (4.24%) SaaS
10 14 (4.24%) Serverless
11 13 (3.94%) Cloud Computing
11 13 (3.94%) IaaS
12 12 (3.64%) AWS Lambda
13 11 (3.33%) AWS KMS
13 11 (3.33%) Power Platform
Communications & Networking
1 12 (3.64%) DNS
2 9 (2.73%) Firewall
2 9 (2.73%) VPN
3 7 (2.12%) Cisco IOS
3 7 (2.12%) DHCP
3 7 (2.12%) LAN
3 7 (2.12%) WAN
4 6 (1.82%) TCP/IP
5 3 (0.91%) SSL
6 2 (0.61%) FTP
6 2 (0.61%) HTTP
6 2 (0.61%) IMAP
6 2 (0.61%) Internet
6 2 (0.61%) OpenLDAP
6 2 (0.61%) SMTP
6 2 (0.61%) SSH
7 1 (0.30%) Network Security
7 1 (0.30%) Structured Cabling
Database & Business Intelligence
1 14 (4.24%) Amazon RDS
2 10 (3.03%) SQL Server
3 9 (2.73%) PostgreSQL
4 8 (2.42%) Elasticsearch
5 7 (2.12%) Power BI
6 6 (1.82%) Amazon Redshift
7 4 (1.21%) Amazon Athena
7 4 (1.21%) Amazon Aurora
7 4 (1.21%) BigQuery
7 4 (1.21%) Hadoop
7 4 (1.21%) HBase
7 4 (1.21%) MongoDB
7 4 (1.21%) Tableau
8 3 (0.91%) Data Lake
8 3 (0.91%) Data Warehouse
8 3 (0.91%) DynamoDB
8 3 (0.91%) SQL Server Integration Services
9 2 (0.61%) Big Data
9 2 (0.61%) Impala
9 2 (0.61%) Redis
Development Applications
1 65 (19.70%) Rational DOORS
2 30 (9.09%) Jenkins
3 23 (6.97%) GitLab
4 14 (4.24%) Sonatype Nexus
5 11 (3.33%) SonarQube
6 9 (2.73%) Git
6 9 (2.73%) TeamCity
7 7 (2.12%) JIRA
7 7 (2.12%) Vagrant
8 3 (0.91%) Artifactory
8 3 (0.91%) Bitbucket Server
8 3 (0.91%) Oracle Forms
9 2 (0.61%) Atlassian Bamboo
9 2 (0.61%) Octopus Deploy
10 1 (0.30%) Bitbucket
10 1 (0.30%) CircleCI
10 1 (0.30%) Team Foundation Server
10 1 (0.30%) Zephyr
General
1 48 (14.55%) Finance
2 45 (13.64%) Social Skills
3 26 (7.88%) Law
4 16 (4.85%) Banking
5 13 (3.94%) Public Sector
6 12 (3.64%) Analytical Skills
7 7 (2.12%) Advertising
8 6 (1.82%) Front Office
9 4 (1.21%) Inclusion and Diversity
10 3 (0.91%) Financial Institution
10 3 (0.91%) Organisational Skills
11 2 (0.61%) Marketing
11 2 (0.61%) Presentation Skills
12 1 (0.30%) Aviation
12 1 (0.30%) Electronics
12 1 (0.30%) Games
12 1 (0.30%) Legal
12 1 (0.30%) Retail
Libraries, Frameworks & Software Standards
1 17 (5.15%) REST
2 15 (4.55%) ARM Templates
2 15 (4.55%) Kafka
3 9 (2.73%) ADO
3 9 (2.73%) Spring Boot
4 7 (2.12%) Spring
5 6 (1.82%) AWS CDK
6 5 (1.52%) .NET
6 5 (1.52%) React
7 4 (1.21%) ActiveMQ
7 4 (1.21%) Elastic Stack
7 4 (1.21%) Loki
7 4 (1.21%) SAML
7 4 (1.21%) YAML
8 3 (0.91%) JSON
8 3 (0.91%) Node.js
8 3 (0.91%) Oracle Fusion
9 2 (0.61%) Django
9 2 (0.61%) LDAP
10 1 (0.30%) .NET Framework
Miscellaneous
1 65 (19.70%) Product Ownership
2 17 (5.15%) Public Cloud
3 11 (3.33%) Clustering
4 9 (2.73%) Distributed Computing
5 8 (2.42%) Replication
6 6 (1.82%) Hybrid Cloud
7 5 (1.52%) Cloud Native
8 4 (1.21%) Low-Code
9 3 (0.91%) Distributed Systems
9 3 (0.91%) Hedge funds
9 3 (0.91%) Linux Command Line
9 3 (0.91%) Virtual Team
10 2 (0.61%) Data Centre
10 2 (0.61%) Data Protection Act
10 2 (0.61%) Private Cloud
11 1 (0.30%) Analytical Mindset
11 1 (0.30%) Blog
11 1 (0.30%) Credit Risk
11 1 (0.30%) Onboarding
11 1 (0.30%) Renewable Energy
Operating Systems
1 63 (19.09%) Linux
2 28 (8.48%) Windows
3 14 (4.24%) Red Hat Enterprise Linux
4 12 (3.64%) Windows Server
5 10 (3.03%) Windows Server 2016
6 9 (2.73%) Android
7 8 (2.42%) VMS
8 7 (2.12%) Mac OS
9 5 (1.52%) Ubuntu
10 4 (1.21%) Unix
10 4 (1.21%) Windows Server 2008
10 4 (1.21%) Windows Server 2012
10 4 (1.21%) Windows Server 2019
11 3 (0.91%) Amazon Linux
12 2 (0.61%) CentOS
12 2 (0.61%) Solaris
Processes & Methodologies
1 261 (79.09%) Platform Engineering
2 112 (33.94%) CI/CD
3 99 (30.00%) Infrastructure as Code
4 97 (29.39%) Agile
5 89 (26.97%) DevOps
6 79 (23.94%) Mentoring
7 68 (20.61%) Stakeholder Engagement
8 65 (19.70%) ArchiMate
8 65 (19.70%) MODAF
8 65 (19.70%) Model-Based Systems Engineering
8 65 (19.70%) Programme Delivery
8 65 (19.70%) SysML
8 65 (19.70%) TOGAF
9 57 (17.27%) CAD
10 52 (15.76%) Containerisation
11 35 (10.61%) Problem-Solving
12 33 (10.00%) Analytics
13 30 (9.09%) Artificial Intelligence
14 29 (8.79%) Roadmaps
15 23 (6.97%) Deployment Automation
Programming Languages
1 128 (38.79%) Python
2 46 (13.94%) PowerShell
3 45 (13.64%) Bash
4 39 (11.82%) Java
5 33 (10.00%) Bicep
6 22 (6.67%) Go
6 22 (6.67%) Ruby
7 17 (5.15%) Scala
8 15 (4.55%) SQL
9 11 (3.33%) Perl
10 8 (2.42%) Groovy
11 7 (2.12%) TypeScript
12 6 (1.82%) JavaScript
13 5 (1.52%) C#
14 4 (1.21%) C++
14 4 (1.21%) Shell Script
15 3 (0.91%) T-SQL
16 2 (0.61%) Kotlin
16 2 (0.61%) PHP
17 1 (0.30%) SHACL
Qualifications
1 146 (44.24%) Degree
2 122 (36.97%) BPSS Clearance
3 65 (19.70%) TOGAF Certification
4 25 (7.58%) Security Cleared
5 22 (6.67%) SC Cleared
6 17 (5.15%) Master's Degree
7 16 (4.85%) Computer Science Degree
8 9 (2.73%) Microsoft Certification
9 8 (2.42%) Azure Certification
10 4 (1.21%) DV Cleared
11 3 (0.91%) AWS Certification
12 1 (0.30%) (ISC)2 CCSP
12 1 (0.30%) CCSP
12 1 (0.30%) Cisco Certification
12 1 (0.30%) CISSP
12 1 (0.30%) MCSE
Quality Assurance & Compliance
1 10 (3.03%) GDPR
2 6 (1.82%) Sarbanes-Oxley
3 5 (1.52%) Data Quality
3 5 (1.52%) QA
4 4 (1.21%) Accessibility
4 4 (1.21%) ISO/IEC 27001
5 1 (0.30%) Cyber Essentials
5 1 (0.30%) Cyber Essentials PLUS
5 1 (0.30%) NIST
5 1 (0.30%) PCI DSS
System Software
1 77 (23.33%) Docker
2 24 (7.27%) Active Directory
3 22 (6.67%) VMware Infrastructure
4 13 (3.94%) Virtual Desktop
5 10 (3.03%) VMware ESXi
6 7 (2.12%) Virtual Machines
7 5 (1.52%) Hyper-V
8 3 (0.91%) DFS Replication
9 2 (0.61%) Dovecot
9 2 (0.61%) HDFS
9 2 (0.61%) Postfix
9 2 (0.61%) Squid
10 1 (0.30%) Veritas Cluster Server
10 1 (0.30%) vSphere
Systems Management
1 121 (36.67%) Terraform
2 96 (29.09%) Kubernetes
3 84 (25.45%) Ansible
4 30 (9.09%) Puppet
5 28 (8.48%) Progress Chef
6 25 (7.58%) Grafana
7 18 (5.45%) Prometheus
8 14 (4.24%) Podman
9 6 (1.82%) Red Hat Satellite
10 5 (1.52%) Nessus
10 5 (1.52%) Proxmox
10 5 (1.52%) SCCM
11 4 (1.21%) Active Directory Federation Services
12 3 (0.91%) Nagios
12 3 (0.91%) Packer
13 2 (0.61%) Argo
13 2 (0.61%) AWS Copilot
13 2 (0.61%) Consul
13 2 (0.61%) Hadoop YARN
13 2 (0.61%) Rancher
Vendors
1 65 (19.70%) Sparx
2 38 (11.52%) Microsoft
3 26 (7.88%) VMware
4 24 (7.27%) Google
5 13 (3.94%) Citrix
5 13 (3.94%) Red Hat
6 9 (2.73%) Cisco
6 9 (2.73%) Oracle
7 8 (2.42%) Databricks
7 8 (2.42%) Palo Alto
8 6 (1.82%) ServiceNow
9 4 (1.21%) Cloudera
9 4 (1.21%) EMC
9 4 (1.21%) Hitachi
9 4 (1.21%) TOWER Software
9 4 (1.21%) WSO2
10 3 (0.91%) Juniper
10 3 (0.91%) SolarWinds
11 2 (0.61%) Jaspersoft
11 2 (0.61%) MapR