Onboarding Jobs with Work from Home Options

Onboarding
UK > Work from Home

The table below looks at the prevalence of the term Onboarding in permanent job vacancies with an option to work from home (WFH). Included is a benchmarking guide to the salaries offered in vacancies that have cited Onboarding over the 6 months to 28 May 2024 with a comparison to the same period over the previous 2 years.

6 months to
28 May 2024
Same period 2023 Same period 2022
Rank 215 198 196
Rank change year-on-year -17 -2 -54
Permanent jobs citing Onboarding 499 712 1,522
As % of all permanent jobs with a WFH option 1.45% 1.79% 2.08%
As % of the Miscellaneous category 4.11% 4.63% 4.40%
Number of salaries quoted 431 499 649
10th Percentile £30,000 £39,740 £31,495
25th Percentile £32,750 £50,000 £46,250
Median annual salary (50th Percentile) £55,000 £65,000 £60,000
Median % change year-on-year -15.38% +8.33% -7.69%
75th Percentile £70,000 £83,750 £82,500
90th Percentile £85,000 £95,000 £97,290
UK median annual salary £50,000 £65,000 £60,000
% change year-on-year -23.08% +8.33% -4.00%

All Generic Skills
Work from Home

Onboarding is in the General and Transferable Skills category. The following table is for comparison with the above and provides summary statistics for all permanent job vacancies with a WFH option and a requirement for generic IT skills.

Permanent vacancies with a requirement for generic IT skills 12,135 15,383 34,616
As % of all permanent jobs with a WFH option 35.32% 38.68% 47.23%
Number of salaries quoted 9,260 11,222 17,141
10th Percentile £32,500 £39,294 £37,500
25th Percentile £42,500 £48,750 £47,500
Median annual salary (50th Percentile) £60,000 £65,000 £65,000
Median % change year-on-year -7.69% - +13.04%
75th Percentile £80,000 £86,250 £83,750
90th Percentile £105,000 £110,000 £100,000
UK median annual salary £55,000 £65,000 £62,500
% change year-on-year -15.38% +4.00% +4.17%

Onboarding
Trend for Jobs with a WFH Option

Job vacancies with a work from home option citing Onboarding as a proportion of all IT jobs advertised.
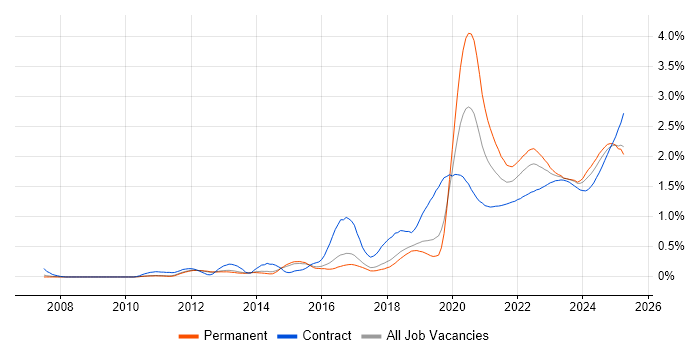
Onboarding trend for jobs with a WFH option

Onboarding
Salary Trend for Jobs with a WFH Option

3-month moving average salary quoted in job vacancies with a work from home option citing Onboarding.

Onboarding salary trend for jobs with a WFH option

Onboarding
Salary Histogram for Jobs with a WFH Option

Salary distribution for jobs with a work from home option citing Onboarding over the 6 months to 28 May 2024.

Onboarding salary histogram for jobs with a WFH option

Onboarding
Co-occurring Skills and Capabilities with WFH Options by Category

The follow tables expand on the table above by listing co-occurrences grouped by category. The same employment type, locality and period is covered with up to 20 co-occurrences shown in each of the following categories:

Application Platforms
1 15 (3.01%) SharePoint
2 13 (2.61%) Microsoft Exchange
3 4 (0.80%) SAS
4 3 (0.60%) Exchange Server 2013
5 2 (0.40%) ArcGIS
5 2 (0.40%) Confluence
6 1 (0.20%) Apache
6 1 (0.20%) WordPress
Applications
1 41 (8.22%) Microsoft Excel
2 26 (5.21%) Microsoft Office
3 8 (1.60%) Microsoft PowerPoint
3 8 (1.60%) Trello
4 7 (1.40%) Adobe XD
5 3 (0.60%) SPSS
6 1 (0.20%) 1Password
6 1 (0.20%) AutoCAD
6 1 (0.20%) Chatbot
6 1 (0.20%) Mathematica
6 1 (0.20%) Photoshop
6 1 (0.20%) Revit
Business Applications
1 9 (1.80%) SAP HR
2 4 (0.80%) SAP ERP
3 3 (0.60%) Salesforce CRM
4 2 (0.40%) Oracle HRMS
4 2 (0.40%) Unit4 Business World
5 1 (0.20%) Dynamics CRM
Cloud Services
1 130 (26.05%) Azure
2 76 (15.23%) AWS
3 64 (12.83%) Microsoft 365
4 40 (8.02%) SaaS
5 33 (6.61%) Azure DevOps
6 26 (5.21%) GCP
7 18 (3.61%) Entra ID
7 18 (3.61%) GitHub
7 18 (3.61%) GitHub Actions
8 17 (3.41%) SuccessFactors
9 16 (3.21%) Google Workspace
10 13 (2.61%) PaaS
11 9 (1.80%) Boomi
11 9 (1.80%) IaaS
11 9 (1.80%) Power Platform
11 9 (1.80%) Serverless
12 7 (1.40%) Google Analytics
13 6 (1.20%) WhatsApp
14 5 (1.00%) AWS Lambda
15 4 (0.80%) OneDrive
Communications & Networking
1 29 (5.81%) Firewall
2 18 (3.61%) DNS
3 13 (2.61%) Broadband
3 13 (2.61%) Wireless
4 11 (2.20%) NAS
5 6 (1.20%) LAN
5 6 (1.20%) VoIP
5 6 (1.20%) WAN
6 5 (1.00%) Fibre Channel
6 5 (1.00%) Internet
6 5 (1.00%) TCP/IP
7 4 (0.80%) DHCP
7 4 (0.80%) FTP
7 4 (0.80%) HTTP
8 3 (0.60%) iSCSI
8 3 (0.60%) Radio Access Network
8 3 (0.60%) Remote Desktop
8 3 (0.60%) SAN
8 3 (0.60%) WebEx
8 3 (0.60%) Wi-Fi
Database & Business Intelligence
1 23 (4.61%) Relational Database
2 17 (3.41%) SQL Server
3 10 (2.00%) Metadata
4 8 (1.60%) Oracle Database
4 8 (1.60%) Power BI
5 5 (1.00%) Big Data
5 5 (1.00%) Tableau
6 4 (0.80%) Data Warehouse
6 4 (0.80%) InfluxDB
6 4 (0.80%) MySQL
6 4 (0.80%) Redis
7 3 (0.60%) Amazon QuickSight
7 3 (0.60%) EDRMS
7 3 (0.60%) SQL Server Reporting Services
8 2 (0.40%) Azure SQL Data Warehouse
8 2 (0.40%) Azure SQL Database
8 2 (0.40%) Data Lake
8 2 (0.40%) GIS
8 2 (0.40%) SQL Server Analysis Services
8 2 (0.40%) SQL Server Integration Services
Development Applications
1 14 (2.81%) Git
2 11 (2.20%) JIRA
3 9 (1.80%) SonarQube
4 8 (1.60%) GitLab
4 8 (1.60%) Jenkins
5 7 (1.40%) Cucumber
6 5 (1.00%) Postman
6 5 (1.00%) TeamCity
7 4 (0.80%) CircleCI
7 4 (0.80%) git-flow
8 2 (0.40%) Cypress.io
8 2 (0.40%) Selenium
9 1 (0.20%) Appium
9 1 (0.20%) Bitbucket
9 1 (0.20%) JMeter
9 1 (0.20%) MSBuild
9 1 (0.20%) REST Assured
9 1 (0.20%) SpecFlow
9 1 (0.20%) Subversion
9 1 (0.20%) Visual Studio Team System
General
1 215 (43.09%) Social Skills
2 115 (23.05%) Finance
3 47 (9.42%) Analytical Skills
4 36 (7.21%) Marketing
5 34 (6.81%) Public Sector
6 31 (6.21%) Legal
7 27 (5.41%) Retail
8 24 (4.81%) Banking
9 21 (4.21%) Presentation Skills
10 17 (3.41%) Games
11 14 (2.81%) Inclusion and Diversity
11 14 (2.81%) Organisational Skills
12 13 (2.61%) Advertising
12 13 (2.61%) Local Government
13 12 (2.40%) Back Office
13 12 (2.40%) French Language
13 12 (2.40%) Front Office
13 12 (2.40%) Law
14 11 (2.20%) Telecoms
15 9 (1.80%) Mandarin Language
Job Titles
1 81 (16.23%) Senior
2 73 (14.63%) Analyst
3 60 (12.02%) Developer
4 39 (7.82%) Consultant
5 35 (7.01%) Senior Developer
6 31 (6.21%) Lead
6 31 (6.21%) Project Manager
7 24 (4.81%) E-Commerce Manager
7 24 (4.81%) E-Commerce Project Manager
8 23 (4.61%) Full Stack Developer
9 18 (3.61%) Development Manager
10 17 (3.41%) Senior Full Stack Developer
11 16 (3.21%) Administrator
11 16 (3.21%) Delivery Manager
11 16 (3.21%) Support Analyst
11 16 (3.21%) Support Engineer
12 15 (3.01%) Applications Support
13 14 (2.81%) .NET Developer
13 14 (2.81%) Senior Analyst
14 13 (2.61%) Service Manager
Libraries, Frameworks & Software Standards
1 48 (9.62%) .NET
2 31 (6.21%) CSS
2 31 (6.21%) HTML
3 28 (5.61%) EDI
3 28 (5.61%) Node.js
4 24 (4.81%) RESTful
5 23 (4.61%) Web Services
6 21 (4.21%) .NET Core
7 19 (3.81%) ASP.NET
8 13 (2.61%) FIX Protocol
9 12 (2.40%) ASP.NET Core
10 11 (2.20%) AngularJS
10 11 (2.20%) Express.js
10 11 (2.20%) OAuth
11 10 (2.00%) OpenID
12 9 (1.80%) ARM Templates
12 9 (1.80%) Azure Blueprints
13 7 (1.40%) Blazor
13 7 (1.40%) Material Design
13 7 (1.40%) NgRx
Miscellaneous
1 29 (5.81%) Management Information System
2 24 (4.81%) Self-Motivation
3 19 (3.81%) Social Media
4 18 (3.61%) Client/Server
5 15 (3.01%) Video Conferencing
6 14 (2.81%) Product Ownership
7 10 (2.00%) iPad
8 8 (1.60%) Cloud Native
9 7 (1.40%) Foreign Exchange (FX)
9 7 (1.40%) PropTech
10 6 (1.20%) Data Centre
10 6 (1.20%) Greenfield Project
10 6 (1.20%) Life Science
10 6 (1.20%) SWIFT Messaging Network
10 6 (1.20%) Virtual Team
11 5 (1.00%) Analytical Mindset
11 5 (1.00%) Equities
11 5 (1.00%) Fixed Income
11 5 (1.00%) Hedge funds
11 5 (1.00%) Low-Code
Operating Systems
1 68 (13.63%) Windows
2 39 (7.82%) Windows Server
3 24 (4.81%) Linux
4 14 (2.81%) Mac OS
5 13 (2.61%) Windows Server 2012
6 12 (2.40%) Windows 10
7 10 (2.00%) Unix
7 10 (2.00%) Windows Server 2019
8 9 (1.80%) Windows Server 2016
9 4 (0.80%) Oracle Linux
9 4 (0.80%) Red Hat Enterprise Linux
9 4 (0.80%) Solaris
10 1 (0.20%) Apple iOS
10 1 (0.20%) Mac OS X
10 1 (0.20%) Windows Server 2008
Processes & Methodologies
1 150 (30.06%) Client Onboarding
2 106 (21.24%) Problem-Solving
3 94 (18.84%) Agile
4 91 (18.24%) Project Management
5 90 (18.04%) Software Engineering
6 62 (12.42%) DevOps
7 54 (10.82%) Full Stack Development
8 52 (10.42%) Cybersecurity
9 50 (10.02%) Customer Service
10 48 (9.62%) Analytics
11 43 (8.62%) ITIL
12 41 (8.22%) CI/CD
13 37 (7.41%) E-Commerce
14 36 (7.21%) Continuous Improvement
15 34 (6.81%) TDD
16 33 (6.61%) Continuous Delivery
17 30 (6.01%) Decision-Making
17 30 (6.01%) Front End Development
17 30 (6.01%) Mentoring
18 29 (5.81%) Software Testing
Programming Languages
1 77 (15.43%) SQL
2 60 (12.02%) C#
3 48 (9.62%) Python
4 41 (8.22%) Java
5 31 (6.21%) JavaScript
6 25 (5.01%) PowerShell
7 21 (4.21%) Go
8 19 (3.81%) Bash
9 8 (1.60%) TypeScript
10 7 (1.40%) T-SQL
11 5 (1.00%) C
11 5 (1.00%) R
12 4 (0.80%) ActionScript
12 4 (0.80%) ActionScript 2.0
12 4 (0.80%) PHP
12 4 (0.80%) Shell Script
12 4 (0.80%) VB
12 4 (0.80%) VBScript
13 3 (0.60%) Bicep
14 2 (0.40%) C++
Qualifications
1 68 (13.63%) Degree
2 62 (12.42%) Security Cleared
3 50 (10.02%) BPSS Clearance
4 28 (5.61%) SC Cleared
5 13 (2.61%) CISSP
6 10 (2.00%) ACCA
6 10 (2.00%) Computer Science Degree
7 6 (1.20%) AWS Certification
7 6 (1.20%) CCSK
7 6 (1.20%) Master's Degree
7 6 (1.20%) OSCP
8 5 (1.00%) AAT
8 5 (1.00%) AWS Certified Solutions Architect
8 5 (1.00%) CIPD
9 4 (0.80%) Azure Certification
9 4 (0.80%) CEH
9 4 (0.80%) DBS Check
9 4 (0.80%) GSEC
10 3 (0.60%) CISM
10 3 (0.60%) Microsoft Certification
Quality Assurance & Compliance
1 26 (5.21%) Accessibility
2 24 (4.81%) ISO/IEC 27001
3 20 (4.01%) QA
4 13 (2.61%) Cyber Essentials
4 13 (2.61%) Data Quality
5 11 (2.20%) NIST
5 11 (2.20%) SOC 2
6 10 (2.00%) PCI DSS
7 9 (1.80%) NCSC
8 8 (1.60%) GDPR
8 8 (1.60%) SLA
9 3 (0.60%) HMG Security Policy Framework
9 3 (0.60%) ISO 9001
10 1 (0.20%) COREP
10 1 (0.20%) FINREP
10 1 (0.20%) GRC
10 1 (0.20%) IFRS
10 1 (0.20%) SEPA
System Software
1 57 (11.42%) Active Directory
2 25 (5.01%) Docker
3 23 (4.61%) VMware Infrastructure
4 8 (1.60%) Hyper-V
5 4 (0.80%) vSphere
6 2 (0.40%) VMware ESXi
6 2 (0.40%) XenDesktop
7 1 (0.20%) Virtual Machines
Systems Management
1 25 (5.01%) Terraform
2 21 (4.21%) Microsoft Intune
3 20 (4.01%) Ansible
3 20 (4.01%) Kubernetes
4 15 (3.01%) Single Sign-On
5 8 (1.60%) Grafana
6 4 (0.80%) Istio
6 4 (0.80%) Kibana
6 4 (0.80%) Prometheus
7 2 (0.40%) vCenter Server
8 1 (0.20%) Cisco CUCM
8 1 (0.20%) SCCM
Vendors
1 109 (21.84%) Microsoft
2 34 (6.81%) Google
3 23 (4.61%) VMware
4 22 (4.41%) Apple
4 22 (4.41%) SAP
5 16 (3.21%) Adobe
6 14 (2.81%) Oracle
7 12 (2.40%) ServiceNow
7 12 (2.40%) Splunk
8 9 (1.80%) Dell
8 9 (1.80%) IBM
8 9 (1.80%) Snow
9 8 (1.60%) Algorithmics
9 8 (1.60%) ION Trading
9 8 (1.60%) Salesforce
10 6 (1.20%) Mitel
11 5 (1.00%) Cisco
11 5 (1.00%) Qualtrics
11 5 (1.00%) Sage
12 4 (0.80%) Xero