Time Management Jobs with Hybrid/Remote/WFH Options

Time Management
UK > Work from Home

The table below provides summary statistics for permanent remote or hybrid work requiring Time Management skills. It includes a benchmarking guide to the annual salaries offered in vacancies that cited Time Management over the 6 months leading up to 22 May 2025, comparing them to the same period in the previous two years.

6 months to
22 May 2025
Same period 2024 Same period 2023
Rank 199 176 201
Rank change year-on-year -23 +25 +9
Permanent jobs citing Time Management 319 613 684
As % of all permanent jobs with a WFH option 1.72% 1.81% 1.69%
As % of the Processes & Methodologies category 1.82% 1.99% 1.76%
Number of salaries quoted 158 411 364
10th Percentile £23,633 £24,000 £29,750
25th Percentile £29,813 £29,288 £37,879
Median annual salary (50th Percentile) £45,000 £40,000 £55,000
Median % change year-on-year +12.50% -27.27% +10.00%
75th Percentile £55,250 £55,000 £67,500
90th Percentile £75,000 £67,500 £80,000
UK median annual salary £45,000 £40,000 £50,000
% change year-on-year +12.50% -20.00% +5.26%

All Process and Methodology Skills
Work from Home

Time Management falls under the Processes and Methodologies category. For comparison with the information above, the following table provides summary statistics for all permanent job vacancies with remote or hybrid options requiring process or methodology skills.

Permanent vacancies with a requirement for process or methodology skills 17,488 30,832 38,771
As % of all permanent jobs with a WFH option 94.15% 91.18% 96.05%
Number of salaries quoted 9,263 23,318 26,920
10th Percentile £27,750 £33,750 £37,500
25th Percentile £42,500 £42,500 £47,500
Median annual salary (50th Percentile) £59,751 £57,500 £62,500
Median % change year-on-year +3.91% -8.00% +4.17%
75th Percentile £77,500 £75,000 £82,500
90th Percentile £102,500 £95,000 £100,000
UK median annual salary £57,500 £55,000 £61,000
% change year-on-year +4.55% -9.84% +1.67%

Time Management
Trend for Jobs with a WFH Option

Job vacancies with remote working options citing Time Management as a proportion of all IT jobs advertised.
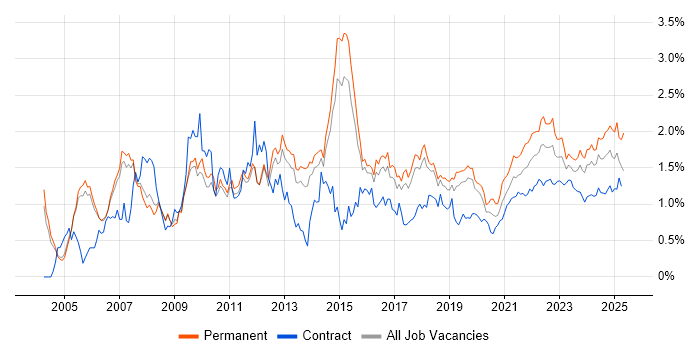
Time Management trend for jobs with Hybrid/Remote/WFH options

Time Management
Salary Trend for Jobs with a WFH Option

3-month moving average salary quoted in job vacancies with remote working options citing Time Management.

Time Management salary trend for jobs with a WFH option

Time Management
Salary Histogram for Jobs with a WFH Option

Salary distribution for jobs with remote working options citing Time Management over the 6 months to 22 May 2025.

Time Management salary histogram for jobs with a WFH option

Time Management
Co-occurring Skills and Capabilities with WFH Options by Category

The follow tables expand on the table above by listing co-occurrences grouped by category. The same employment type, locality and period is covered with up to 20 co-occurrences shown in each of the following categories:

Application Platforms
1 14 (4.39%) Microsoft Exchange
2 6 (1.88%) WordPress
3 4 (1.25%) CMS
3 4 (1.25%) SharePoint
4 3 (0.94%) Apache Spark
4 3 (0.94%) IBM Domino
4 3 (0.94%) OpenEdge
5 2 (0.63%) Drupal
5 2 (0.63%) Oracle Workflow
6 1 (0.31%) Confluence
6 1 (0.31%) IIS
Applications
1 33 (10.34%) Microsoft Excel
2 32 (10.03%) Microsoft Office
3 10 (3.13%) Microsoft PowerPoint
4 5 (1.57%) Adobe Premiere
4 5 (1.57%) Photoshop
4 5 (1.57%) Trello
5 4 (1.25%) Adobe Illustrator
6 3 (0.94%) Adobe After Effects
6 3 (0.94%) Final Cut Pro
6 3 (0.94%) Spreadsheet
7 2 (0.63%) Adobe Creative Suite
7 2 (0.63%) Adobe XD
7 2 (0.63%) AutoCAD
7 2 (0.63%) InDesign
7 2 (0.63%) Sketch
8 1 (0.31%) CINEMA 4D
8 1 (0.31%) Microsoft Project
8 1 (0.31%) MS Visio
8 1 (0.31%) Revit
Business Applications
1 15 (4.70%) SAP S/4HANA
2 14 (4.39%) SAP HCM
2 14 (4.39%) SAP Payroll
3 13 (4.08%) SAP HR
3 13 (4.08%) Shopify
4 3 (0.94%) Elite 3E
5 2 (0.63%) Carpe Diem
6 1 (0.31%) Magento
6 1 (0.31%) Oracle Assets
6 1 (0.31%) Oracle EBS R12
6 1 (0.31%) Oracle Financials
6 1 (0.31%) Oracle General Ledger
6 1 (0.31%) Oracle HRMS
6 1 (0.31%) Oracle Internet Expenses
6 1 (0.31%) Oracle iProcurement
6 1 (0.31%) Oracle iRecruitment
6 1 (0.31%) Oracle Payables
6 1 (0.31%) Oracle Procure-to-Pay
6 1 (0.31%) Oracle Receivables
6 1 (0.31%) SAP ERP
Cloud Services
1 31 (9.72%) Microsoft 365
2 21 (6.58%) Azure
3 16 (5.02%) Google Analytics
3 16 (5.02%) Power Platform
4 15 (4.70%) AWS
5 14 (4.39%) SuccessFactors
6 13 (4.08%) Google Tag Manager
7 11 (3.45%) Google Ads
8 8 (2.51%) AWS Lambda
8 8 (2.51%) Entra ID
8 8 (2.51%) Serverless
9 7 (2.19%) SaaS
10 5 (1.57%) Amazon S3
11 4 (1.25%) Amazon Cognito
11 4 (1.25%) CloudFront
11 4 (1.25%) Figma
12 3 (0.94%) GitHub
12 3 (0.94%) Google Sheets
12 3 (0.94%) Google Workspace
13 2 (0.63%) Amazon SQS
Communications & Networking
1 16 (5.02%) Firewall
2 12 (3.76%) Wireless
3 9 (2.82%) DNS
4 8 (2.51%) DHCP
5 6 (1.88%) LAN
5 6 (1.88%) WAN
6 5 (1.57%) VPN
6 5 (1.57%) Wi-Fi
7 4 (1.25%) Internet
7 4 (1.25%) TCP/IP
8 2 (0.63%) NAS
8 2 (0.63%) SAN
8 2 (0.63%) VLAN
8 2 (0.63%) WebEx
9 1 (0.31%) 5G
9 1 (0.31%) SD-WAN
9 1 (0.31%) TETRA
9 1 (0.31%) Unified Communications
9 1 (0.31%) VoIP
9 1 (0.31%) Wireless Security
Database & Business Intelligence
1 49 (15.36%) Big Data
2 16 (5.02%) Power BI
3 6 (1.88%) Data Mining
4 5 (1.57%) Tableau
5 3 (0.94%) SQL Server
6 2 (0.63%) Elasticsearch
6 2 (0.63%) GIS
6 2 (0.63%) MySQL
6 2 (0.63%) PostgreSQL
7 1 (0.31%) Amazon Aurora
7 1 (0.31%) Amazon RDS
7 1 (0.31%) Amazon Redshift
7 1 (0.31%) NoSQL
7 1 (0.31%) Oracle BI Publisher
7 1 (0.31%) Oracle Reports
7 1 (0.31%) Pentaho
7 1 (0.31%) Power Query
7 1 (0.31%) Relational Database
Development Applications
1 11 (3.45%) JIRA
2 5 (1.57%) Git
3 4 (1.25%) Jasmine
3 4 (1.25%) Karma Test Runner
3 4 (1.25%) Postman
3 4 (1.25%) Selenium
3 4 (1.25%) SoapUI
3 4 (1.25%) SpecFlow
4 3 (0.94%) Eclipse
5 2 (0.63%) Jenkins
6 1 (0.31%) Artifactory
6 1 (0.31%) Bitbucket
6 1 (0.31%) NUnit
6 1 (0.31%) Oracle Forms
6 1 (0.31%) SonarQube
General
1 184 (57.68%) Social Skills
2 100 (31.35%) Analytical Skills
3 88 (27.59%) Marketing
4 57 (17.87%) Organisational Skills
5 53 (16.61%) Advertising
6 41 (12.85%) Finance
7 36 (11.29%) Legal
8 28 (8.78%) Presentation Skills
9 26 (8.15%) Retail
10 21 (6.58%) Inclusion and Diversity
11 15 (4.70%) Public Sector
12 14 (4.39%) Pharmaceutical
13 12 (3.76%) Law
14 10 (3.13%) Publishing
15 8 (2.51%) Health Technology
16 7 (2.19%) Documentation Skills
16 7 (2.19%) Manufacturing
17 4 (1.25%) Automotive
17 4 (1.25%) Local Government
17 4 (1.25%) Social Housing
Job Titles
1 91 (28.53%) Senior
2 64 (20.06%) Senior Manager
3 54 (16.93%) Account Manager
4 49 (15.36%) Senior Account Manager
5 42 (13.17%) Analyst
6 33 (10.34%) Support Analyst
7 24 (7.52%) IT Support
8 16 (5.02%) Consultant
8 16 (5.02%) IT Analyst
9 15 (4.70%) Developer
9 15 (4.70%) Lead
10 14 (4.39%) 1st Line Support
11 13 (4.08%) IT Support Analyst
11 13 (4.08%) SAP Analyst
11 13 (4.08%) SAP Support
11 13 (4.08%) SAP Support Analyst
12 12 (3.76%) Coordinator
12 12 (3.76%) Project Manager
13 11 (3.45%) 1st Line Support Analyst
13 11 (3.45%) Support Engineer
Libraries, Frameworks & Software Standards
1 13 (4.08%) SAP Fiori
2 7 (2.19%) CSS
3 6 (1.88%) HTML
4 5 (1.57%) AngularJS
5 4 (1.25%) HTML5
5 4 (1.25%) RESTful
5 4 (1.25%) Sass
6 3 (0.94%) Elastic Stack
6 3 (0.94%) PySpark
6 3 (0.94%) SailPoint
6 3 (0.94%) Web Services
7 2 (0.63%) .NET
7 2 (0.63%) EDI
7 2 (0.63%) React
7 2 (0.63%) REST
8 1 (0.31%) Kafka
8 1 (0.31%) Laravel
8 1 (0.31%) Spring
8 1 (0.31%) Symfony
8 1 (0.31%) WSH
Miscellaneous
1 53 (16.61%) Digital Media
2 49 (15.36%) Marketing Technology
3 26 (8.15%) Management Information System
3 26 (8.15%) Self-Motivation
4 14 (4.39%) Driving Licence
5 13 (4.08%) EPoS
6 12 (3.76%) Onboarding
7 9 (2.82%) Social Media
8 8 (2.51%) Product Ownership
9 5 (1.57%) Blog
9 5 (1.57%) Video Editing
10 4 (1.25%) Animation
10 4 (1.25%) BBC
10 4 (1.25%) Virtual Team
11 3 (0.94%) Data Centre
11 3 (0.94%) Embedded Systems
11 3 (0.94%) Graphic Design
11 3 (0.94%) Learning Management System
11 3 (0.94%) Renewable Energy
12 2 (0.63%) Video Conferencing
Operating Systems
1 38 (11.91%) Windows
2 16 (5.02%) Windows Server
3 7 (2.19%) Android
4 6 (1.88%) Linux
4 6 (1.88%) Windows Server 2019
5 4 (1.25%) Apple iOS
5 4 (1.25%) Windows 10
5 4 (1.25%) Windows Server 2016
6 3 (0.94%) Windows 7
6 3 (0.94%) Windows Server 2012
7 2 (0.63%) AIX
7 2 (0.63%) Windows Vista
8 1 (0.31%) Debian
Processes & Methodologies
1 98 (30.72%) Problem-Solving
2 88 (27.59%) Project Management
3 65 (20.38%) Digital Marketing
4 63 (19.75%) Marketing Strategy
5 62 (19.44%) Strategic Thinking
6 57 (17.87%) Artificial Intelligence
6 57 (17.87%) Collaborative Working
6 57 (17.87%) Customer Service
6 57 (17.87%) Process Improvement
7 55 (17.24%) Customer Retention
8 52 (16.30%) Analytical Thinking
9 51 (15.99%) Epics
10 43 (13.48%) Agile
11 34 (10.66%) CRM
12 33 (10.34%) Analytics
12 33 (10.34%) Continuous Improvement
13 31 (9.72%) Project Delivery
14 21 (6.58%) Benchmarking
14 21 (6.58%) Due Diligence
15 20 (6.27%) Service Delivery
Programming Languages
1 17 (5.33%) SQL
2 14 (4.39%) ABAP
2 14 (4.39%) Python
3 9 (2.82%) JavaScript
4 6 (1.88%) Delphi
5 5 (1.57%) C++
5 5 (1.57%) PowerShell
5 5 (1.57%) TypeScript
6 3 (0.94%) C
6 3 (0.94%) Embedded C++
6 3 (0.94%) Progress 4GL
7 2 (0.63%) C#
7 2 (0.63%) PHP
7 2 (0.63%) PL/SQL
7 2 (0.63%) VB.NET
7 2 (0.63%) VBA
8 1 (0.31%) Java
8 1 (0.31%) MATLAB
8 1 (0.31%) T-SQL
8 1 (0.31%) VBScript
Qualifications
1 36 (11.29%) Degree
2 21 (6.58%) MRICS
3 8 (2.51%) Security Cleared
4 6 (1.88%) DBS Check
4 6 (1.88%) ITIL Foundation Certificate
4 6 (1.88%) SC Cleared
5 5 (1.57%) CSPO
6 4 (1.25%) DV Cleared
7 3 (0.94%) MCSA
7 3 (0.94%) Microsoft Certification
8 2 (0.63%) ACCA
8 2 (0.63%) CCNA
8 2 (0.63%) CIMA
8 2 (0.63%) Cisco Certification
8 2 (0.63%) CWNA
8 2 (0.63%) CWTS
8 2 (0.63%) MCP
8 2 (0.63%) MCSE
9 1 (0.31%) Chartered Engineer
9 1 (0.31%) MCITP
Quality Assurance & Compliance
1 20 (6.27%) GDPR
1 20 (6.27%) QA
2 14 (4.39%) SLA
3 12 (3.76%) PMO
4 7 (2.19%) Accessibility
5 4 (1.25%) ISO/IEC 27001
6 3 (0.94%) ISO 9001
7 2 (0.63%) ISO 14001
8 1 (0.31%) Cyber Essentials
8 1 (0.31%) Cyber Essentials PLUS
8 1 (0.31%) Data Quality
8 1 (0.31%) GAAP
8 1 (0.31%) GMP
8 1 (0.31%) Government Security Classifications
8 1 (0.31%) GRC
8 1 (0.31%) GxP
8 1 (0.31%) ISO 22301
8 1 (0.31%) NIST
8 1 (0.31%) PCI DSS
System Software
1 25 (7.84%) Active Directory
2 11 (3.45%) VMware Infrastructure
3 8 (2.51%) Hyper-V
4 6 (1.88%) Docker
5 5 (1.57%) Virtual Desktop
6 4 (1.25%) Firmware
7 3 (0.94%) VMware ESXi
8 1 (0.31%) Forefront TMG
8 1 (0.31%) ISA Server
8 1 (0.31%) KVM
8 1 (0.31%) VMware NSX
Systems Management
1 5 (1.57%) AirWatch
1 5 (1.57%) EMC NetWorker
1 5 (1.57%) SCCM
2 4 (1.25%) Microsoft Intune
3 3 (0.94%) vCenter Server
4 2 (0.63%) Ansible
4 2 (0.63%) Kibana
4 2 (0.63%) Kubernetes
4 2 (0.63%) logstash
4 2 (0.63%) Puppet
4 2 (0.63%) Terraform
5 1 (0.31%) Avamar
5 1 (0.31%) NetBackup
5 1 (0.31%) Progress Chef
5 1 (0.31%) Systems Management Server (SMS)
5 1 (0.31%) VxRail
Vendors
1 69 (21.63%) Microsoft
2 30 (9.40%) Google
3 20 (6.27%) SAP
4 13 (4.08%) Adobe
5 11 (3.45%) Cisco
5 11 (3.45%) TikTok
5 11 (3.45%) VMware
6 10 (3.13%) Pinterest
6 10 (3.13%) Salesforce
7 7 (2.19%) Citrix
7 7 (2.19%) Fortinet
8 6 (1.88%) Meraki
8 6 (1.88%) SonicWALL
8 6 (1.88%) WatchGuard
9 5 (1.57%) Apple
9 5 (1.57%) BeyondTrust
9 5 (1.57%) iManage
10 4 (1.25%) Ahrefs
10 4 (1.25%) Instagram
10 4 (1.25%) JD Edwards