OAuth
UK

The table below provides summary statistics for permanent job vacancies requiring OAuth skills. It includes a benchmarking guide to the annual salaries offered in vacancies that cited OAuth over the 6 months leading up to 30 May 2025, comparing them to the same period in the previous two years.

6 months to
30 May 2025
Same period 2024 Same period 2023
Rank 548 673 680
Rank change year-on-year +125 +7 -155
Permanent jobs citing OAuth 164 242 289
As % of all permanent jobs advertised in the UK 0.30% 0.23% 0.30%
As % of the Libraries, Frameworks & Software Standards category 1.73% 1.13% 0.99%
Number of salaries quoted 112 168 187
10th Percentile £51,250 £47,500 £52,500
25th Percentile £58,500 £53,134 £57,500
Median annual salary (50th Percentile) £77,500 £57,875 £75,000
Median % change year-on-year +33.91% -22.83% +20.00%
75th Percentile £87,500 £78,750 £90,000
90th Percentile £98,474 £94,125 £103,750
UK excluding London median annual salary £80,000 £57,500 £62,500
% change year-on-year +39.13% -8.00% +8.70%

All Software Libraries and Frameworks
UK

OAuth falls under the Software Libraries and Frameworks category. For comparison with the information above, the following table provides summary statistics for all permanent job vacancies requiring technical specification, industry standards, software libraries and framework skills.

Permanent vacancies with a requirement for technical specification, industry standards, software libraries and framework skills 9,499 21,396 29,097
As % of all permanent jobs advertised in the UK 17.14% 20.72% 29.95%
Number of salaries quoted 5,834 15,919 18,040
10th Percentile £38,750 £36,250 £40,810
25th Percentile £51,250 £45,000 £50,500
Median annual salary (50th Percentile) £66,206 £60,000 £67,500
Median % change year-on-year +10.34% -11.11% +3.85%
75th Percentile £86,250 £78,750 £87,500
90th Percentile £111,250 £100,000 £106,250
UK excluding London median annual salary £60,000 £55,000 £57,500
% change year-on-year +9.09% -4.35% +4.55%

OAuth
Job Vacancy Trend

Job postings citing OAuth as a proportion of all IT jobs advertised.
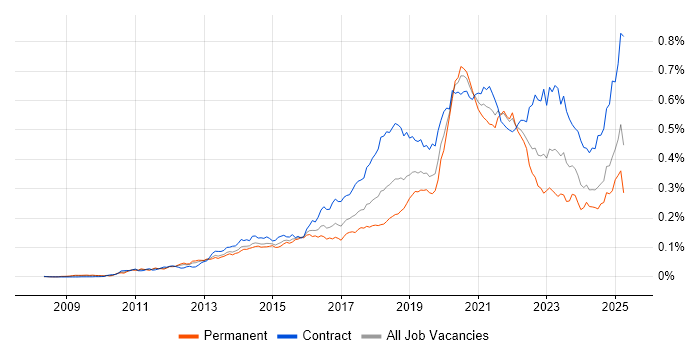
Job vacancy trend for OAuth in the UK

OAuth
Salary Trend

3-month moving average salary quoted in jobs citing OAuth.

Salary trend for OAuth in the UK

OAuth
Salary Histogram

Salary distribution for jobs citing OAuth over the 6 months to 30 May 2025.

Salary histogram for OAuth in the UK

OAuth
Top 15 Job Locations

The table below looks at the demand and provides a guide to the median salaries quoted in IT jobs citing OAuth within the UK over the 6 months to 30 May 2025. The 'Rank Change' column provides an indication of the change in demand within each location based on the same 6 month period last year.

Location Rank Change
on Same Period
Last Year
Matching
Permanent
IT Job Ads
Median Salary
Past 6 Months
Median Salary
% Change
on Same Period
Last Year
Live
Jobs
England +123 139 £75,000 +30.43% 749
UK excluding London +135 91 £80,000 +39.13% 760
Work from Home +98 73 £75,000 +30.43% 437
London +98 60 £63,000 +0.80% 88
Scotland +89 21 £94,637 +11.34% 33
East of England +62 18 £85,000 +54.06% 109
North of England +45 18 £74,500 +35.03% 159
South West +107 16 £65,000 +17.81% 86
Midlands +91 15 £68,750 +19.58% 144
Yorkshire +59 12 £88,662 +54.19% 64
West Midlands +62 11 £73,750 +33.67% 76
South East +49 6 £53,750 -7.73% 227
North West +6 6 £74,500 +35.03% 76
East Midlands +47 4 £60,000 +4.36% 59
Wales +47 3 £65,000 +18.18% 20

OAuth
Co-occurring Skills and Capabilities by Category

The follow tables expand on the table above by listing co-occurrences grouped by category. The same employment type, locality and period is covered with up to 20 co-occurrences shown in each of the following categories:

Application Platforms
1 12 (7.32%) Umbraco
2 8 (4.88%) Confluence
3 5 (3.05%) Apache Airflow
3 5 (3.05%) Apache Spark
4 3 (1.83%) nginx
4 3 (1.83%) OpenEdge
5 1 (0.61%) Appian
5 1 (0.61%) CMS
5 1 (0.61%) EPiServer
5 1 (0.61%) Headless CMS
5 1 (0.61%) NServiceBus
5 1 (0.61%) Oracle SOA Suite
5 1 (0.61%) SharePoint
Applications
1 1 (0.61%) Microsoft Excel
1 1 (0.61%) Microsoft PowerPoint
1 1 (0.61%) MS Visio
Business Applications
1 9 (5.49%) NetSuite
2 8 (4.88%) SAP S/4HANA
3 1 (0.61%) Payment Gateway
3 1 (0.61%) Salesforce CRM
Cloud Services
1 79 (48.17%) Azure
2 60 (36.59%) AWS
3 37 (22.56%) GCP
4 30 (18.29%) SaaS
5 23 (14.02%) Boomi
6 22 (13.41%) Serverless
7 17 (10.37%) Amazon SQS
7 17 (10.37%) AWS Lambda
8 14 (8.54%) Amazon CloudWatch
8 14 (8.54%) Amazon EventBridge
8 14 (8.54%) AWS CodeBuild
8 14 (8.54%) AWS CodeDeploy
8 14 (8.54%) AWS CodePipeline
8 14 (8.54%) AWS Step Functions
9 11 (6.71%) Entra ID
10 9 (5.49%) Azure DevOps
11 8 (4.88%) Amazon S3
12 7 (4.27%) GitHub
13 6 (3.66%) Amazon Kinesis
13 6 (3.66%) Azure Monitor
Communications & Networking
1 10 (6.10%) SSL
2 8 (4.88%) Kerberos
3 3 (1.83%) HTTP
3 3 (1.83%) HTTPS
4 2 (1.22%) Reverse Proxy
5 1 (0.61%) DNS
5 1 (0.61%) X.21
Database & Business Intelligence
1 23 (14.02%) Relational Database
2 20 (12.20%) PostgreSQL
3 16 (9.76%) BigQuery
4 14 (8.54%) Big Data
4 14 (8.54%) NoSQL
5 10 (6.10%) SQL Server
6 9 (5.49%) MySQL
7 8 (4.88%) MongoDB
8 5 (3.05%) Amazon Athena
8 5 (3.05%) Amazon Redshift
8 5 (3.05%) Apache Hive
8 5 (3.05%) Data Lake
8 5 (3.05%) Data Warehouse
8 5 (3.05%) Hadoop
8 5 (3.05%) Sqoop
9 4 (2.44%) Redis
10 3 (1.83%) Amazon RDS
10 3 (1.83%) Metadata
11 2 (1.22%) Azure SQL Database
11 2 (1.22%) SQL Server Integration Services
Development Applications
1 37 (22.56%) Git
2 27 (16.46%) JIRA
3 21 (12.80%) Jenkins
4 12 (7.32%) webpack
5 11 (6.71%) GitLab
6 10 (6.10%) Moq
6 10 (6.10%) SpecFlow
7 8 (4.88%) Mocha
8 7 (4.27%) Grunt
8 7 (4.27%) Postman
9 6 (3.66%) Jasmine
10 5 (3.05%) Babel
10 5 (3.05%) CircleCI
11 4 (2.44%) gulp
12 3 (1.83%) JUnit
12 3 (1.83%) Mockito
12 3 (1.83%) NUnit
12 3 (1.83%) REST Assured
12 3 (1.83%) SoapUI
12 3 (1.83%) SonarQube
General
1 57 (34.76%) Finance
2 51 (31.10%) Social Skills
3 34 (20.73%) Banking
4 27 (16.46%) Public Sector
5 24 (14.63%) Law
6 23 (14.02%) Inclusion and Diversity
7 15 (9.15%) Analytical Skills
8 10 (6.10%) Marketing
9 8 (4.88%) Pharmaceutical
10 6 (3.66%) Retail Banking
11 4 (2.44%) Documentation Skills
12 3 (1.83%) Fire and Rescue
12 3 (1.83%) Influencing Skills
12 3 (1.83%) Organisational Skills
13 2 (1.22%) Aviation
13 2 (1.22%) Manufacturing
13 2 (1.22%) Retail
14 1 (0.61%) Advertising
14 1 (0.61%) Automotive
Job Titles
1 53 (32.32%) Senior
2 50 (30.49%) Developer
3 41 (25.00%) Lead
3 41 (25.00%) Software Engineer
4 24 (14.63%) Senior Software Engineer
5 19 (11.59%) Senior Developer
6 13 (7.93%) Architect
7 11 (6.71%) Lead Architect
7 11 (6.71%) Lead Solutions Architect
7 11 (6.71%) Solutions Architect
8 9 (5.49%) Front-End Developer (Client-Side Developer)
8 9 (5.49%) NetSuite Developer
8 9 (5.49%) Technical Developer
9 8 (4.88%) Integration Developer
10 7 (4.27%) Development Manager
10 7 (4.27%) Identity and Access Management Engineer
10 7 (4.27%) Identity Management Engineer
11 6 (3.66%) Lead Developer
11 6 (3.66%) React Developer
11 6 (3.66%) SAP Developer
Libraries, Frameworks & Software Standards
1 58 (35.37%) OAuth2
2 53 (32.32%) REST
2 53 (32.32%) SAML
3 51 (31.10%) OpenID
4 47 (28.66%) JWT
5 43 (26.22%) React
6 39 (23.78%) CSS
7 36 (21.95%) RESTful
8 28 (17.07%) .NET
9 26 (15.85%) SOAP
10 19 (11.59%) HTML
10 19 (11.59%) Middleware
11 17 (10.37%) Ajax
11 17 (10.37%) AngularJS
11 17 (10.37%) Web Services
12 16 (9.76%) .NET Framework
12 16 (9.76%) XML
13 15 (9.15%) Spring
14 14 (8.54%) JSON
14 14 (8.54%) Spring Boot
Miscellaneous
1 16 (9.76%) Virtual Team
2 12 (7.32%) PKI
3 11 (6.71%) Algorithms
3 11 (6.71%) Data Structures
3 11 (6.71%) Onboarding
3 11 (6.71%) Product Ownership
4 8 (4.88%) Cloud Native
5 7 (4.27%) Enterprise Software
5 7 (4.27%) Private Cloud
5 7 (4.27%) Public Cloud
6 5 (3.05%) Distributed Applications
6 5 (3.05%) Greenfield Project
7 4 (2.44%) Legacy Systems
7 4 (2.44%) Management Information System
7 4 (2.44%) Taxonomies
8 3 (1.83%) Smart City
9 2 (1.22%) Analytical Mindset
9 2 (1.22%) Cyberattack
9 2 (1.22%) Self-Motivation
10 1 (0.61%) Video Conferencing
Operating Systems
1 8 (4.88%) Android
2 7 (4.27%) Apple iOS
2 7 (4.27%) Windows
3 6 (3.66%) Linux
4 5 (3.05%) Windows Server
5 4 (2.44%) Unix
6 3 (1.83%) Ubuntu
Processes & Methodologies
1 76 (46.34%) Agile
2 64 (39.02%) DevOps
3 63 (38.41%) CI/CD
4 48 (29.27%) Software Engineering
5 44 (26.83%) Microservices
6 43 (26.22%) Containerisation
7 34 (20.73%) Analytics
8 33 (20.12%) Problem-Solving
9 31 (18.90%) API Development
9 31 (18.90%) Event-Driven
10 30 (18.29%) Front End Development
10 30 (18.29%) Project Management
11 26 (15.85%) Data Analytics
12 25 (15.24%) API Design
12 25 (15.24%) Continuous Improvement
13 24 (14.63%) Collaborative Working
13 24 (14.63%) Identity Access Management
14 23 (14.02%) Coaching
15 22 (13.41%) Event-Driven Architecture
15 22 (13.41%) Technology Strategy
Programming Languages
1 60 (36.59%) Java
2 44 (26.83%) JavaScript
3 42 (25.61%) SQL
4 37 (22.56%) C#
5 34 (20.73%) TypeScript
6 32 (19.51%) Python
7 9 (5.49%) PowerShell
8 8 (4.88%) Swift
9 7 (4.27%) Kotlin
10 5 (3.05%) Apex Code
10 5 (3.05%) Scala
10 5 (3.05%) Shell Script
11 3 (1.83%) Go
11 3 (1.83%) OpenEdge ABL
11 3 (1.83%) Progress 4GL
11 3 (1.83%) R
11 3 (1.83%) Rust
12 2 (1.22%) Groovy
12 2 (1.22%) SOQL
13 1 (0.61%) Objective-C
Qualifications
1 26 (15.85%) Security Cleared
2 23 (14.02%) Degree
3 16 (9.76%) Computer Science Degree
4 8 (4.88%) Master's Degree
5 7 (4.27%) SC Cleared
6 5 (3.05%) BPSS Clearance
6 5 (3.05%) CISM
6 5 (3.05%) CISSP
6 5 (3.05%) Microsoft Certification
7 3 (1.83%) ISTQB
7 3 (1.83%) ISTQB Foundation Certification
8 2 (1.22%) A+ Certification
8 2 (1.22%) CompTIA Security+
8 2 (1.22%) DBS Check
8 2 (1.22%) Numerate Degree
9 1 (0.61%) AWS Certification
9 1 (0.61%) DV Cleared
Quality Assurance & Compliance
1 16 (9.76%) QA
2 6 (3.66%) CDISC
2 6 (3.66%) NIST
3 5 (3.05%) ISO/IEC 27001
4 2 (1.22%) Accessibility
4 2 (1.22%) Data Quality
4 2 (1.22%) GDPR
4 2 (1.22%) SLA
4 2 (1.22%) WCAG
5 1 (0.61%) Cyber Essentials
5 1 (0.61%) NCSC
5 1 (0.61%) PCI DSS
System Software
1 48 (29.27%) Docker
2 8 (4.88%) Active Directory
3 5 (3.05%) Apache Flume
4 1 (0.61%) NDS
4 1 (0.61%) Virtual Machines
Systems Management
1 39 (23.78%) Single Sign-On
2 34 (20.73%) Kubernetes
3 12 (7.32%) Terraform
4 7 (4.27%) Ansible
5 5 (3.05%) Oozie
5 5 (3.05%) QRadar
6 4 (2.44%) Grafana
6 4 (2.44%) Graylog
7 3 (1.83%) Progress Chef
7 3 (1.83%) Prometheus
8 2 (1.22%) Argo
9 1 (0.61%) CA Single Sign-On
9 1 (0.61%) Nessus
9 1 (0.61%) PingFederate
Vendors
1 28 (17.07%) Microsoft
2 25 (15.24%) MuleSoft
3 19 (11.59%) Salesforce
4 14 (8.54%) Informatica
4 14 (8.54%) ServiceNow
5 13 (7.93%) Google
6 12 (7.32%) ForgeRock
7 10 (6.10%) Splunk
8 8 (4.88%) SAP
9 7 (4.27%) IBM
9 7 (4.27%) Ping Identity
10 5 (3.05%) Cloudera
10 5 (3.05%) Databricks
10 5 (3.05%) SolarWinds
11 3 (1.83%) Oracle
11 3 (1.83%) Progress
12 2 (1.22%) Atlassian
12 2 (1.22%) Facebook
12 2 (1.22%) Okta
13 1 (0.61%) OpenAI