Selenium
UK

The following table provides summary statistics for permanent job vacancies with a requirement for Selenium skills. Included is a benchmarking guide to the salaries offered in vacancies that have cited Selenium over the 6 months to 26 April 2024 with a comparison to the same period in the previous 2 years.

6 months to
26 Apr 2024
Same period 2023 Same period 2022
Rank 390 213 200
Rank change year-on-year -177 -13 -42
Permanent jobs citing Selenium 659 1,916 3,194
As % of all permanent jobs advertised in the UK 0.67% 1.83% 2.07%
As % of the Development Applications category 6.88% 12.53% 9.31%
Number of salaries quoted 474 1,037 1,827
10th Percentile £38,225 £41,250 £40,000
25th Percentile £46,250 £50,000 £46,250
Median annual salary (50th Percentile) £60,500 £62,000 £60,000
Median % change year-on-year -2.42% +3.33% +14.29%
75th Percentile £91,934 £80,000 £73,750
90th Percentile £100,000 £93,750 £88,750
UK excluding London median annual salary £60,000 £55,000 £52,500
% change year-on-year +9.09% +4.76% +6.06%

All Development Application Skills
UK

Selenium is in the Development Applications category. The following table is for comparison with the above and provides summary statistics for all permanent job vacancies with a requirement for development application skills.

Permanent vacancies with a requirement for development application skills 9,581 15,294 34,323
As % of all permanent jobs advertised in the UK 9.76% 14.59% 22.27%
Number of salaries quoted 6,761 9,314 15,878
10th Percentile £36,250 £41,250 £37,500
25th Percentile £45,000 £50,000 £46,250
Median annual salary (50th Percentile) £60,000 £65,000 £62,500
Median % change year-on-year -7.69% +4.00% +9.65%
75th Percentile £77,500 £83,750 £80,000
90th Percentile £95,000 £100,000 £95,000
UK excluding London median annual salary £55,000 £57,500 £55,000
% change year-on-year -4.35% +4.55% +10.00%

Selenium
Job Vacancy Trend

Job postings citing Selenium as a proportion of all IT jobs advertised.
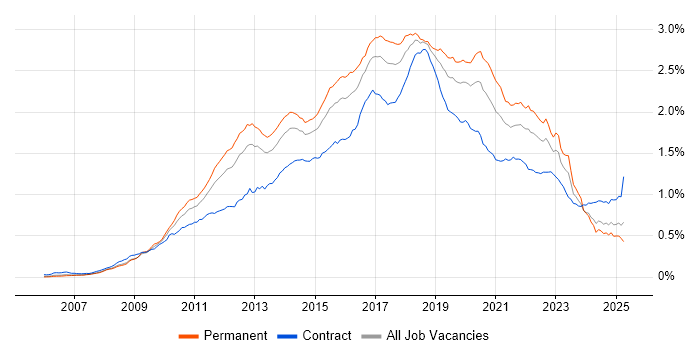
Job vacancy trend for Selenium in the UK

Selenium
Salary Trend

3-month moving average salary quoted in jobs citing Selenium.

Salary trend for Selenium in the UK

Selenium
Salary Histogram

Salary distribution for jobs citing Selenium over the 6 months to 26 April 2024.

Salary histogram for Selenium in the UK

Selenium
Top 16 Job Locations

The table below looks at the demand and provides a guide to the median salaries quoted in IT jobs citing Selenium within the UK over the 6 months to 26 April 2024. The 'Rank Change' column provides an indication of the change in demand within each location based on the same 6 month period last year.

Location Rank Change
on Same Period
Last Year
Matching
Permanent
IT Job Ads
Median Salary
Past 6 Months
Median Salary
% Change
on Same Period
Last Year
Live
Jobs
England -180 536 £62,500 +2.46% 124
UK excluding London -197 455 £60,000 +9.09% 91
Work from Home -126 263 £65,000 +8.33% 67
South East -28 198 £62,500 +13.64% 32
London -115 184 £83,230 +18.90% 45
Scotland -75 79 £39,250 -41.97% 11
North of England -152 62 £52,500 -4.55% 16
South West -101 54 £60,500 +27.37% 10
Yorkshire -41 32 £53,500 +18.89% 7
Midlands -122 31 £50,000 -7.41% 9
Wales +7 25 £45,000 -18.18% 5
North West -75 25 £47,500 -20.83% 8
West Midlands -44 17 £49,000 -9.26% 5
East Midlands -79 14 £60,000 +29.73% 4
East of England -23 6 £57,500 -8.00% 9
North East -40 5 £53,750 -14.00% 1

Selenium
Co-occurring Skills and Capabilities by Category

The follow tables expand on the table above by listing co-occurrences grouped by category. The same employment type, locality and period is covered with up to 20 co-occurrences shown in each of the following categories:

Application Platforms
1 23 (3.49%) Confluence
2 19 (2.88%) Apache
3 5 (0.76%) IIS
3 5 (0.76%) nginx
4 3 (0.46%) CMS
5 1 (0.15%) BizTalk Server
5 1 (0.15%) Drupal
5 1 (0.15%) JBoss
5 1 (0.15%) PrestaShop
5 1 (0.15%) SharePoint
5 1 (0.15%) Tomcat
5 1 (0.15%) WordPress
Applications
1 11 (1.67%) Microsoft PowerPoint
2 2 (0.30%) Chatbot
2 2 (0.30%) Microsoft Excel
Business Applications
1 1 (0.15%) Dynamics CRM
1 1 (0.15%) Magento
1 1 (0.15%) Shopify
Cloud Services
1 175 (26.56%) AWS
2 169 (25.64%) Azure
3 94 (14.26%) SaaS
4 69 (10.47%) Azure DevOps
5 44 (6.68%) GCP
6 28 (4.25%) GitHub
7 17 (2.58%) Cloud Computing
8 15 (2.28%) BrowserStack
8 15 (2.28%) OpenShift
9 10 (1.52%) GitHub Actions
10 8 (1.21%) Slack
11 7 (1.06%) Azure Monitor
11 7 (1.06%) Pulumi
12 6 (0.91%) BlazeMeter
12 6 (0.91%) Serverless
13 5 (0.76%) Dynamics 365
13 5 (0.76%) Sauce Labs
14 4 (0.61%) Datadog
14 4 (0.61%) IBM Cloud
14 4 (0.61%) Power Platform
Communications & Networking
1 9 (1.37%) Network Security
2 7 (1.06%) Internet
3 2 (0.30%) Firewall
3 2 (0.30%) TCP/IP
4 1 (0.15%) DHCP
4 1 (0.15%) DNS
4 1 (0.15%) HTTP
4 1 (0.15%) Multicast
4 1 (0.15%) SSL
4 1 (0.15%) VLAN
4 1 (0.15%) VPN
4 1 (0.15%) Wireshark
Database & Business Intelligence
1 42 (6.37%) NoSQL
2 37 (5.61%) SQL Server
3 26 (3.95%) Relational Database
4 23 (3.49%) PostgreSQL
5 20 (3.03%) Elasticsearch
6 15 (2.28%) MongoDB
7 10 (1.52%) Data Lake
7 10 (1.52%) Redis
8 9 (1.37%) MySQL
9 8 (1.21%) Data Warehouse
10 5 (0.76%) Amazon RDS
11 3 (0.46%) Big Data
11 3 (0.46%) MariaDB
12 1 (0.15%) Amazon Aurora
12 1 (0.15%) Azure SQL Database
12 1 (0.15%) Delta Lake
12 1 (0.15%) DynamoDB
12 1 (0.15%) Geospatial Data
12 1 (0.15%) Power BI
Development Applications
1 200 (30.35%) Cypress.io
2 181 (27.47%) Cucumber
3 168 (25.49%) Git
3 168 (25.49%) Jenkins
4 145 (22.00%) WebDriver
5 130 (19.73%) Postman
6 119 (18.06%) JUnit
7 98 (14.87%) JIRA
8 72 (10.93%) JMeter
9 69 (10.47%) Jasmine
10 66 (10.02%) Protractor
11 60 (9.10%) Karma Test Runner
12 51 (7.74%) SoapUI
13 45 (6.83%) SpecFlow
14 39 (5.92%) Visual Studio
15 38 (5.77%) REST Assured
15 38 (5.77%) TeamCity
15 38 (5.77%) TestNG
16 31 (4.70%) Appium
17 27 (4.10%) Team Foundation Server
General
1 164 (24.89%) Finance
2 107 (16.24%) Social Skills
3 90 (13.66%) Banking
4 81 (12.29%) Inclusion and Diversity
5 80 (12.14%) Law
6 69 (10.47%) Investment Banking
7 23 (3.49%) Analytical Skills
8 21 (3.19%) Organisational Skills
9 20 (3.03%) Aerospace
10 14 (2.12%) Influencing Skills
11 12 (1.82%) Games
11 12 (1.82%) Public Sector
12 10 (1.52%) Marketing
12 10 (1.52%) Retail
12 10 (1.52%) Turkish Language
13 8 (1.21%) Financial Institution
14 7 (1.06%) Automotive
14 7 (1.06%) Telecoms
15 5 (0.76%) Legal
15 5 (0.76%) Manufacturing
Job Titles
1 162 (24.58%) Lead
2 125 (18.97%) Developer
3 104 (15.78%) Senior
4 95 (14.42%) Tester
5 88 (13.35%) Software Engineer
6 66 (10.02%) Automation Tester
6 66 (10.02%) Java Engineer
7 65 (9.86%) Java Software Engineer
8 52 (7.89%) Front-End Developer (Client-Side Developer)
9 48 (7.28%) Test Engineer
10 46 (6.98%) Analyst
11 44 (6.68%) QA Engineer
12 34 (5.16%) Test Analyst
13 32 (4.86%) QA Leader
13 32 (4.86%) Senior Developer
14 31 (4.70%) Test Leader
15 30 (4.55%) Java Developer
16 25 (3.79%) Lead Software Engineer
17 22 (3.34%) Lead Java Engineer
18 21 (3.19%) QA Analyst
Libraries, Frameworks & Software Standards
1 169 (25.64%) React
2 121 (18.36%) Jest
3 112 (17.00%) HTML
3 112 (17.00%) REST
4 111 (16.84%) CSS
5 102 (15.48%) Spring
6 93 (14.11%) JSON
7 89 (13.51%) .NET
8 84 (12.75%) AngularJS
9 67 (10.17%) jQuery
10 65 (9.86%) Node.js
11 63 (9.56%) Twitter Bootstrap
12 60 (9.10%) Hibernate
12 60 (9.10%) J2EE
12 60 (9.10%) JMS
13 44 (6.68%) HTML5
14 42 (6.37%) Web Services
15 40 (6.07%) RESTful
16 37 (5.61%) CSS3
16 37 (5.61%) Playwright
Miscellaneous
1 60 (9.10%) Data Structures
2 22 (3.34%) Product Ownership
3 21 (3.19%) Algorithms
4 16 (2.43%) Mobile App
5 13 (1.97%) Self-Motivation
6 12 (1.82%) Onboarding
7 11 (1.67%) Enterprise Software
7 11 (1.67%) Greenfield Project
8 8 (1.21%) Data Protection Act
8 8 (1.21%) Private Cloud
8 8 (1.21%) Virtual Team
9 7 (1.06%) Client/Server
10 6 (0.91%) Data Centre
10 6 (0.91%) Hackathon
10 6 (0.91%) Management Information System
10 6 (0.91%) Social Media
11 5 (0.76%) Public Cloud
11 5 (0.76%) Replication
12 4 (0.61%) IoT
13 3 (0.46%) W3C
Operating Systems
1 15 (2.28%) Windows
2 10 (1.52%) Android
3 6 (0.91%) Linux
4 5 (0.76%) Apple iOS
5 4 (0.61%) Red Hat Enterprise Linux
6 2 (0.30%) Ubuntu
6 2 (0.30%) Windows Server
Processes & Methodologies
1 393 (59.64%) Agile
1 393 (59.64%) Test Automation
2 227 (34.45%) CI/CD
3 192 (29.14%) BDD
4 156 (23.67%) Software Testing
5 148 (22.46%) DevOps
6 139 (21.09%) Software Engineering
7 138 (20.94%) API Testing
8 128 (19.42%) Artificial Intelligence
9 120 (18.21%) SDET
10 118 (17.91%) TDD
11 103 (15.63%) Continuous Integration
12 102 (15.48%) Test Strategy
13 99 (15.02%) Scrum
14 98 (14.87%) Test Scripting
15 90 (13.66%) SDLC
16 84 (12.75%) Machine Learning
17 80 (12.14%) Mentoring
17 80 (12.14%) Web Development
18 73 (11.08%) Multithreading
Programming Languages
1 292 (44.31%) Java
2 255 (38.69%) JavaScript
3 193 (29.29%) C#
4 159 (24.13%) TypeScript
5 151 (22.91%) SQL
6 62 (9.41%) Python
7 41 (6.22%) PHP
8 14 (2.12%) C++
9 13 (1.97%) PowerShell
10 11 (1.67%) Kotlin
11 8 (1.21%) Bicep
12 7 (1.06%) Bash
13 6 (0.91%) PL/SQL
14 5 (0.76%) Go
14 5 (0.76%) XAML
15 4 (0.61%) Ruby
16 3 (0.46%) VB.NET
16 3 (0.46%) VBScript
17 2 (0.30%) T-SQL
18 1 (0.15%) Perl
Qualifications
1 119 (18.06%) Degree
2 69 (10.47%) Security Cleared
3 53 (8.04%) ISTQB
4 40 (6.07%) SC Cleared
5 29 (4.40%) DV Cleared
6 22 (3.34%) ISEB
7 18 (2.73%) Computer Science Degree
8 5 (0.76%) ITIL Certification
9 3 (0.46%) BPSS Clearance
9 3 (0.46%) ISEB Practitioner
10 2 (0.30%) Azure Certification
10 2 (0.30%) HND
11 1 (0.15%) CCNA
11 1 (0.15%) CCNP
11 1 (0.15%) Cisco Certification
11 1 (0.15%) DBS Check
11 1 (0.15%) ISTQB Foundation Certification
11 1 (0.15%) JNCIA
11 1 (0.15%) Master's Degree
11 1 (0.15%) PMI Certification
Quality Assurance & Compliance
1 249 (37.78%) QA
2 40 (6.07%) WCAG
3 19 (2.88%) Accessibility
4 11 (1.67%) GDPR
5 8 (1.21%) PSD2
6 2 (0.30%) PMO
7 1 (0.15%) Data Quality
7 1 (0.15%) ISO 9001
7 1 (0.15%) ISO/IEC 27001
System Software
1 153 (23.22%) Docker
2 6 (0.91%) VMware Infrastructure
3 5 (0.76%) Firmware
4 4 (0.61%) Active Directory
5 3 (0.46%) Hyper-V
5 3 (0.46%) Virtual Machines
5 3 (0.46%) VirtualBox
6 1 (0.15%) Virtual Desktop
Systems Management
1 136 (20.64%) Kubernetes
2 29 (4.40%) Terraform
3 20 (3.03%) Ansible
4 10 (1.52%) Puppet
5 9 (1.37%) Progress Chef
6 7 (1.06%) MIIS
7 6 (0.91%) Kibana
8 5 (0.76%) Argo
8 5 (0.76%) Control-M
8 5 (0.76%) Nagios
9 4 (0.61%) Consul
10 3 (0.46%) logstash
10 3 (0.46%) Prometheus
10 3 (0.46%) ZABBIX
11 1 (0.15%) HP ALM
11 1 (0.15%) Iperf
11 1 (0.15%) Kustomize
11 1 (0.15%) Nmap
11 1 (0.15%) Packer
11 1 (0.15%) Single Sign-On
Vendors
1 44 (6.68%) Microsoft
2 29 (4.40%) Google
3 28 (4.25%) Oracle
4 10 (1.52%) Databricks
5 9 (1.37%) Splunk
6 8 (1.21%) Duck Creek
7 6 (0.91%) New Relic
7 6 (0.91%) VMware
8 4 (0.61%) Atlassian
8 4 (0.61%) Dynatrace
8 4 (0.61%) IBM
9 3 (0.46%) Red Hat
9 3 (0.46%) Salesforce
10 2 (0.30%) SAP
10 2 (0.30%) Xamarin
11 1 (0.15%) AppDynamics
11 1 (0.15%) HP
11 1 (0.15%) OpenAI
11 1 (0.15%) SaltStack
11 1 (0.15%) Veracode