JavaScript Jobs with Work from Home Options

JavaScript (including ECMAScript)
UK > Work from Home

The table below provides summary statistics for permanent job vacancies with an option to work from home (WFH) and a requirement for JavaScript skills. Included is a benchmarking guide to the salaries offered in vacancies that have cited JavaScript over the 6 months to 26 April 2024 with a comparison to the same period in the previous 2 years.

6 months to
26 Apr 2024
Same period 2023 Same period 2022
Rank 13 13 7
Rank change year-on-year 0 -6 -4
Permanent jobs citing JavaScript 3,948 5,844 13,654
As % of all permanent jobs with a WFH option 11.67% 13.51% 20.46%
As % of the Programming Languages category 28.68% 27.44% 34.83%
Number of salaries quoted 3,423 4,198 7,840
10th Percentile £37,500 £40,000 £37,500
25th Percentile £45,000 £47,500 £45,000
Median annual salary (50th Percentile) £60,000 £62,500 £60,000
Median % change year-on-year -4.00% +4.17% +14.29%
75th Percentile £76,250 £81,250 £77,500
90th Percentile £102,500 £97,290 £93,750
UK median annual salary £60,000 £62,500 £60,000
% change year-on-year -4.00% +4.17% +14.29%

All Programming Languages
Work from Home

JavaScript is in the Programming Languages category. The following table is for comparison with the above and provides summary statistics for all permanent job vacancies with a WFH option and a requirement for coding skills.

Permanent vacancies with a requirement for coding skills 13,764 21,297 39,199
As % of all permanent jobs with a WFH option 40.70% 49.25% 58.74%
Number of salaries quoted 11,419 15,642 23,967
10th Percentile £38,750 £41,000 £37,500
25th Percentile £46,250 £50,000 £46,250
Median annual salary (50th Percentile) £60,000 £65,000 £62,500
Median % change year-on-year -7.69% +4.00% +13.64%
75th Percentile £78,750 £85,000 £81,250
90th Percentile £100,000 £103,797 £95,000
UK median annual salary £60,000 £65,000 £62,500
% change year-on-year -7.69% +4.00% +13.64%

JavaScript
Trend for Jobs with a WFH Option

Job vacancies with a work from home option citing JavaScript as a proportion of all IT jobs advertised.
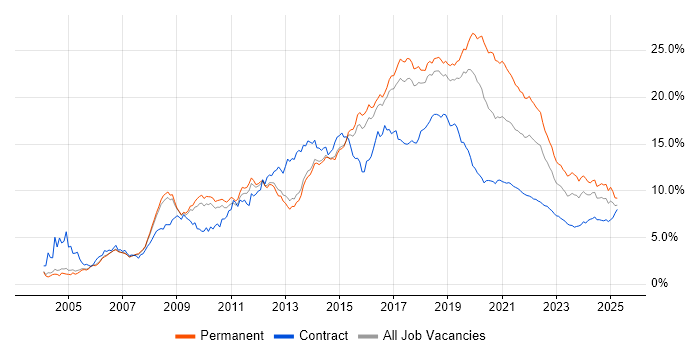
JavaScript trend for jobs with a WFH option

JavaScript
Salary Trend for Jobs with a WFH Option

3-month moving average salary quoted in job vacancies with a work from home option citing JavaScript.

JavaScript salary trend for jobs with a WFH option

JavaScript
Salary Histogram for Jobs with a WFH Option

Salary distribution for jobs with a work from home option citing JavaScript over the 6 months to 26 April 2024.

JavaScript salary histogram for jobs with a WFH option

JavaScript
Co-occurring Skills and Capabilities with WFH Options by Category

The follow tables expand on the table above by listing co-occurrences grouped by category. The same employment type, locality and period is covered with up to 20 co-occurrences shown in each of the following categories:

Application Platforms
1 230 (5.83%) Apache Airflow
2 224 (5.67%) ArcGIS
3 214 (5.42%) GeoServer
4 193 (4.89%) Apache
5 138 (3.50%) CMS
6 103 (2.61%) IIS
7 99 (2.51%) WordPress
8 71 (1.80%) Umbraco
9 68 (1.72%) SharePoint
10 48 (1.22%) Sitecore CMS
11 44 (1.11%) Kentico
12 38 (0.96%) Headless CMS
13 35 (0.89%) nginx
14 27 (0.68%) OpenStack
15 23 (0.58%) Confluence
15 23 (0.58%) Drupal
16 12 (0.30%) NServiceBus
17 10 (0.25%) JBoss
17 10 (0.25%) Microsoft Exchange
17 10 (0.25%) Tomcat
Applications
1 43 (1.09%) Microsoft Office
2 25 (0.63%) Adobe XD
3 22 (0.56%) Microsoft Excel
4 17 (0.43%) Simulink
5 8 (0.20%) Adobe Illustrator
5 8 (0.20%) Photoshop
5 8 (0.20%) Sketch
6 6 (0.15%) Adobe Creative Suite
7 5 (0.13%) Microsoft PowerPoint
8 4 (0.10%) Adobe After Effects
8 4 (0.10%) Maya
8 4 (0.10%) SPSS
9 3 (0.076%) Trello
10 2 (0.051%) FileZilla
11 1 (0.025%) Chatbot
11 1 (0.025%) Notion
11 1 (0.025%) Spreadsheet
11 1 (0.025%) UXPin
11 1 (0.025%) Zeplin
Business Applications
1 54 (1.37%) Shopify
2 47 (1.19%) Dynamics CRM
3 29 (0.73%) Magento
4 14 (0.35%) Payment Gateway
5 8 (0.20%) Remedy ITSM
5 8 (0.20%) Siebel CRM
6 6 (0.15%) BusinessWorks
7 2 (0.051%) Distributed Ledger
7 2 (0.051%) nopCommerce
7 2 (0.051%) R3 Corda
7 2 (0.051%) SAP MII
8 1 (0.025%) Dynamics NAV
8 1 (0.025%) Sage 200
8 1 (0.025%) Sage 50
8 1 (0.025%) Salesforce CRM
8 1 (0.025%) Scribe Insight
Cloud Services
1 1,854 (46.96%) Azure
2 1,481 (37.51%) AWS
3 347 (8.79%) GCP
4 318 (8.05%) Azure DevOps
5 307 (7.78%) SaaS
6 204 (5.17%) Serverless
7 201 (5.09%) dbt
8 188 (4.76%) Snowflake
9 162 (4.10%) GitHub
10 129 (3.27%) Power Platform
11 74 (1.87%) Dynamics 365
12 68 (1.72%) AWS Lambda
13 64 (1.62%) Power Automate
14 60 (1.52%) PowerApps
15 57 (1.44%) Amazon ECS
16 47 (1.19%) Amazon EKS
17 40 (1.01%) Google Play
17 40 (1.01%) npm
18 37 (0.94%) Cloud Computing
19 36 (0.91%) PaaS
Communications & Networking
1 130 (3.29%) Internet
2 27 (0.68%) HTTP
3 21 (0.53%) DNS
4 18 (0.46%) VPN
5 16 (0.41%) Hyperconnected
5 16 (0.41%) SSL
6 15 (0.38%) MQTT
7 14 (0.35%) Network Security
8 10 (0.25%) DHCP
9 9 (0.23%) AMQP
10 8 (0.20%) VoIP
11 7 (0.18%) OpenVPN
11 7 (0.18%) TCP/IP
11 7 (0.18%) Wi-Fi
12 5 (0.13%) FTP
12 5 (0.13%) HTTPS
12 5 (0.13%) Reverse Proxy
12 5 (0.13%) Wireless
13 3 (0.076%) GPRS
13 3 (0.076%) Intranet
Database & Business Intelligence
1 1,030 (26.09%) SQL Server
2 362 (9.17%) PostgreSQL
3 293 (7.42%) MongoDB
4 275 (6.97%) MySQL
5 236 (5.98%) Elasticsearch
6 235 (5.95%) GIS
7 214 (5.42%) QGIS
8 201 (5.09%) Amazon Athena
8 201 (5.09%) Apache Arrow
8 201 (5.09%) Dremio
9 189 (4.79%) Relational Database
10 179 (4.53%) Azure SQL Database
11 172 (4.36%) Apache Ignite
12 162 (4.10%) Data Lake
13 121 (3.06%) NoSQL
14 70 (1.77%) Oracle Database
15 63 (1.60%) Power BI
16 49 (1.24%) Big Data
17 45 (1.14%) Redis
18 38 (0.96%) RDBMS
Development Applications
1 515 (13.04%) Git
2 162 (4.10%) Jenkins
3 130 (3.29%) JIRA
4 121 (3.06%) Visual Studio
5 84 (2.13%) GitLab
6 78 (1.98%) Cypress.io
7 63 (1.60%) Selenium
8 48 (1.22%) Maven
9 47 (1.19%) webpack
10 46 (1.17%) Jasmine
11 45 (1.14%) Postman
12 44 (1.11%) Cucumber
13 39 (0.99%) Visual Studio Code
14 36 (0.91%) JDeveloper
14 36 (0.91%) Team Foundation Server
15 34 (0.86%) TeamCity
16 28 (0.71%) Karma Test Runner
17 25 (0.63%) NUnit
18 24 (0.61%) gulp
18 24 (0.61%) Oracle APEX
General
1 710 (17.98%) Finance
2 591 (14.97%) Social Skills
3 264 (6.69%) Front Office
4 245 (6.21%) Banking
5 207 (5.24%) Marketing
6 179 (4.53%) Investment Banking
7 173 (4.38%) Retail
8 137 (3.47%) Public Sector
9 136 (3.44%) Analytical Skills
10 122 (3.09%) Games
11 88 (2.23%) Inclusion and Diversity
11 88 (2.23%) Law
12 74 (1.87%) Advertising
13 57 (1.44%) Manufacturing
14 51 (1.29%) Back Office
14 51 (1.29%) Tech for Good
15 42 (1.06%) Telecoms
16 37 (0.94%) Legal
17 33 (0.84%) Publishing
18 32 (0.81%) Electronics
Job Titles
1 2,579 (65.32%) Developer
2 1,046 (26.49%) Senior
3 1,005 (25.46%) .NET Developer
4 733 (18.57%) Software Engineer
5 573 (14.51%) Senior Developer
6 375 (9.50%) C# Developer
7 374 (9.47%) Senior Software Engineer
8 352 (8.92%) Full Stack Developer
9 331 (8.38%) Lead
10 305 (7.73%) C# .NET Developer
11 277 (7.02%) Software Developer
12 216 (5.47%) PHP Developer
13 184 (4.66%) Front-End Developer (Client-Side Developer)
14 165 (4.18%) Lead Developer
15 156 (3.95%) Senior .NET Developer
16 154 (3.90%) Developer/Software Engineer
17 142 (3.60%) Java Developer
18 134 (3.39%) React Developer
19 113 (2.86%) JavaScript Developer
20 109 (2.76%) Architect
Libraries, Frameworks & Software Standards
1 1,741 (44.10%) .NET
2 1,514 (38.35%) React
3 1,443 (36.55%) HTML
4 1,383 (35.03%) CSS
5 1,186 (30.04%) AngularJS
6 1,141 (28.90%) .NET Core
7 1,019 (25.81%) ASP.NET
8 806 (20.42%) ASP.NET MVC
9 717 (18.16%) Node.js
10 647 (16.39%) .NET Framework
11 616 (15.60%) Vue
12 613 (15.53%) Entity Framework
13 612 (15.50%) ASP.NET Web API
14 543 (13.75%) HTML5
15 470 (11.90%) RESTful
16 286 (7.24%) REST
17 276 (6.99%) CSS3
18 271 (6.86%) jQuery
19 248 (6.28%) Laravel
20 239 (6.05%) Twitter Bootstrap
Miscellaneous
1 286 (7.24%) Greenfield Project
2 251 (6.36%) Fixed Income
3 239 (6.05%) Hedge funds
4 218 (5.52%) Foreign Exchange (FX)
5 211 (5.34%) Derivative
6 209 (5.29%) Equities
7 127 (3.22%) Mobile App
8 118 (2.99%) Product Ownership
9 77 (1.95%) Cloud Native
10 75 (1.90%) Client/Server
11 70 (1.77%) Enterprise Software
11 70 (1.77%) Self-Motivation
12 64 (1.62%) Data Structures
13 60 (1.52%) IoT
14 52 (1.32%) Virtual Team
15 49 (1.24%) Distributed Systems
16 47 (1.19%) Private Cloud
17 40 (1.01%) iPhone
17 40 (1.01%) Social Media
18 39 (0.99%) Social Network
Operating Systems
1 190 (4.81%) Linux
2 115 (2.91%) Android
3 72 (1.82%) Windows
4 67 (1.70%) Ubuntu
5 54 (1.37%) Apple iOS
6 18 (0.46%) CentOS
7 16 (0.41%) Unix
8 11 (0.28%) Red Hat Enterprise Linux
9 10 (0.25%) Windows Server
10 6 (0.15%) Alpine Linux
11 4 (0.10%) AIX
11 4 (0.10%) VMS
12 3 (0.076%) Kali Linux
13 2 (0.051%) Mac OS
14 1 (0.025%) Debian
14 1 (0.025%) FreeBSD
14 1 (0.025%) Mac OS X
14 1 (0.025%) Solaris
14 1 (0.025%) Windows 7
14 1 (0.025%) Windows Server 2012
Processes & Methodologies
1 1,978 (50.10%) Agile
2 1,425 (36.09%) Full Stack Development
3 1,108 (28.06%) Software Engineering
4 1,040 (26.34%) MVC
5 898 (22.75%) DevOps
6 869 (22.01%) Microservices
7 629 (15.93%) TDD
8 589 (14.92%) Web Development
9 576 (14.59%) Problem-Solving
10 502 (12.72%) BDD
11 455 (11.52%) Scrum
12 355 (8.99%) Front End Development
13 342 (8.66%) Asset Management
14 338 (8.56%) CI/CD
15 304 (7.70%) OO
16 291 (7.37%) User Experience
17 282 (7.14%) Actionable Insight
17 282 (7.14%) Computer Science
18 280 (7.09%) Mentoring
19 277 (7.02%) Kanban
Programming Languages
1 1,697 (42.98%) C#
2 1,197 (30.32%) TypeScript
3 1,084 (27.46%) Python
4 929 (23.53%) SQL
5 760 (19.25%) Java
6 438 (11.09%) PHP
7 159 (4.03%) Go
8 131 (3.32%) T-SQL
9 99 (2.51%) Ruby
10 78 (1.98%) VB.NET
11 66 (1.67%) Bash
12 64 (1.62%) Kotlin
13 56 (1.42%) PowerShell
14 52 (1.32%) C++
15 43 (1.09%) VB
16 42 (1.06%) PL/SQL
17 38 (0.96%) Perl
18 33 (0.84%) C
18 33 (0.84%) Groovy
19 28 (0.71%) VB6
Qualifications
1 476 (12.06%) Security Cleared
2 416 (10.54%) Degree
3 365 (9.25%) SC Cleared
4 165 (4.18%) Computer Science Degree
5 40 (1.01%) BPSS Clearance
6 28 (0.71%) DV Cleared
7 26 (0.66%) Microsoft Certification
8 21 (0.53%) CTC Cleared
9 20 (0.51%) Azure Certification
10 19 (0.48%) DBS Check
11 11 (0.28%) ITIL Foundation Certificate
12 10 (0.25%) Master's Degree
13 7 (0.18%) AWS Certification
13 7 (0.18%) ISTQB
14 6 (0.15%) HNC
15 5 (0.13%) ITIL Certification
16 4 (0.10%) CIPD
17 3 (0.076%) OCP
17 3 (0.076%) Oracle Certification
17 3 (0.076%) OSCP
Quality Assurance & Compliance
1 286 (7.24%) QA
2 79 (2.00%) Accessibility
3 60 (1.52%) Data Quality
4 26 (0.66%) SLA
5 20 (0.51%) WCAG
6 17 (0.43%) GDPR
7 11 (0.28%) ISO/IEC 27001
8 6 (0.15%) Cyber Essentials
9 4 (0.10%) HL7
10 2 (0.051%) GRC
10 2 (0.051%) ISO 9001
11 1 (0.025%) NIST
11 1 (0.025%) PCI DSS
11 1 (0.025%) Sarbanes-Oxley
System Software
1 356 (9.02%) Docker
2 21 (0.53%) Hyper-V
3 14 (0.35%) Active Directory
4 8 (0.20%) Firmware
5 4 (0.10%) Virtual Machines
5 4 (0.10%) VMware Infrastructure
5 4 (0.10%) VMware Server
6 2 (0.051%) OpenSIPS
7 1 (0.025%) VMware ESXi
Systems Management
1 255 (6.46%) Kubernetes
2 169 (4.28%) Terraform
3 70 (1.77%) Ansible
4 46 (1.17%) Prometheus
5 30 (0.76%) Grafana
6 17 (0.43%) Progress Chef
7 14 (0.35%) Puppet
8 13 (0.33%) SCOM
9 8 (0.20%) HP UCMDB
9 8 (0.20%) MIIS
10 6 (0.15%) Argo
10 6 (0.15%) Kibana
10 6 (0.15%) Opsgenie
11 5 (0.13%) HP Quality Center
11 5 (0.13%) Rancher
12 4 (0.10%) cPanel
12 4 (0.10%) Istio
12 4 (0.10%) Single Sign-On
13 3 (0.076%) Active Directory Federation Services
13 3 (0.076%) logstash
Vendors
1 1,075 (27.23%) Microsoft
2 216 (5.47%) ESRI
3 149 (3.77%) Google
4 122 (3.09%) Oracle
5 93 (2.36%) Facebook
6 67 (1.70%) ServiceNow
7 53 (1.34%) Sitecore
8 47 (1.19%) Adobe
9 39 (0.99%) Apple
10 37 (0.94%) Optimizely
11 36 (0.91%) Sony
11 36 (0.91%) Yahoo!
12 28 (0.71%) SAP
13 27 (0.68%) WSO2
14 26 (0.66%) HP
15 23 (0.58%) YouTube
16 20 (0.51%) Salesforce
17 19 (0.48%) WooCommerce
18 15 (0.38%) Dynatrace
19 13 (0.33%) PayPal