Microservices Jobs with Hybrid/Remote/WFH Options

Microservices
UK > Work from Home

The table below provides summary statistics for permanent remote or hybrid work requiring Microservices skills. It includes a benchmarking guide to the annual salaries offered in vacancies that cited Microservices over the 6 months leading up to 3 May 2025, comparing them to the same period in the previous two years.

6 months to
3 May 2025
Same period 2024 Same period 2023
Rank 44 43 37
Rank change year-on-year -1 -6 -7
Permanent jobs citing Microservices 845 1,907 2,996
As % of all permanent jobs with a WFH option 5.57% 5.64% 7.04%
As % of the Processes & Methodologies category 5.98% 6.15% 7.32%
Number of salaries quoted 618 1,680 2,043
10th Percentile £48,575 £42,500 £49,800
25th Percentile £56,250 £50,000 £57,500
Median annual salary (50th Percentile) £71,991 £62,500 £75,000
Median % change year-on-year +15.19% -16.67% +4.83%
75th Percentile £93,778 £82,500 £92,500
90th Percentile £115,000 £96,539 £107,500
UK median annual salary £74,870 £65,000 £78,142
% change year-on-year +15.18% -16.82% +4.19%

All Process and Methodology Skills
Work from Home

Microservices falls under the Processes and Methodologies category. For comparison with the information above, the following table provides summary statistics for all permanent job vacancies with remote or hybrid options requiring process or methodology skills.

Permanent vacancies with a requirement for process or methodology skills 14,134 30,993 40,912
As % of all permanent jobs with a WFH option 93.17% 91.62% 96.10%
Number of salaries quoted 9,780 23,560 28,419
10th Percentile £30,000 £33,750 £37,500
25th Percentile £45,000 £42,500 £47,500
Median annual salary (50th Percentile) £60,000 £57,500 £62,500
Median % change year-on-year +4.35% -8.00% +4.17%
75th Percentile £77,500 £75,000 £82,500
90th Percentile £102,500 £95,000 £100,000
UK median annual salary £57,500 £55,000 £61,500
% change year-on-year +4.55% -10.57% +2.50%

Microservices
Trend for Jobs with a WFH Option

Job vacancies with remote working options citing Microservices as a proportion of all IT jobs advertised.
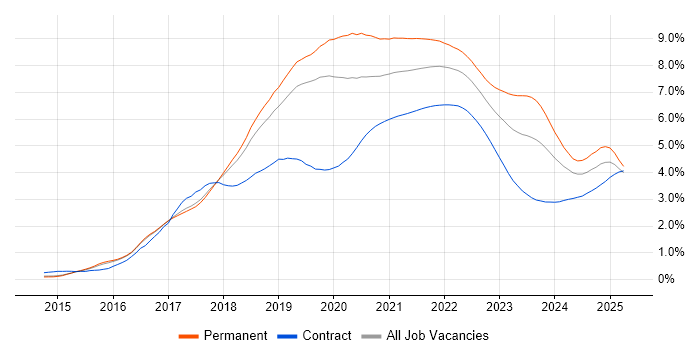
Microservices trend for jobs with Hybrid/Remote/WFH options

Microservices
Salary Trend for Jobs with a WFH Option

3-month moving average salary quoted in job vacancies with remote working options citing Microservices.

Microservices salary trend for jobs with a WFH option

Microservices
Salary Histogram for Jobs with a WFH Option

Salary distribution for jobs with remote working options citing Microservices over the 6 months to 3 May 2025.

Microservices salary histogram for jobs with a WFH option

Microservices
Co-occurring Skills and Capabilities with WFH Options by Category

The follow tables expand on the table above by listing co-occurrences grouped by category. The same employment type, locality and period is covered with up to 20 co-occurrences shown in each of the following categories:

Application Platforms
1 84 (9.94%) Confluence
2 23 (2.72%) Jupyter
3 8 (0.95%) SAS
4 5 (0.59%) Apache
4 5 (0.59%) Oracle SOA Suite
5 4 (0.47%) CMS
5 4 (0.47%) JBoss
6 3 (0.36%) GemFire
6 3 (0.36%) NetWeaver
6 3 (0.36%) OpenEdge
6 3 (0.36%) OpenStack
7 2 (0.24%) NServiceBus
7 2 (0.24%) Sitecore CMS
8 1 (0.12%) Apache Airflow
8 1 (0.12%) ColdFusion
8 1 (0.12%) Headless CMS
8 1 (0.12%) Microsoft Exchange
8 1 (0.12%) SharePoint
Applications
1 9 (1.07%) Microsoft Office
2 2 (0.24%) Adobe XD
2 2 (0.24%) Moqups
2 2 (0.24%) Sketch
3 1 (0.12%) Chatbot
3 1 (0.12%) Microsoft Excel
3 1 (0.12%) Microsoft PowerPoint
3 1 (0.12%) MS Visio
Business Applications
1 4 (0.47%) Oracle EBS
2 2 (0.24%) Dynamics CRM
Cloud Services
1 419 (49.59%) Azure
2 389 (46.04%) AWS
3 223 (26.39%) GCP
4 98 (11.60%) Serverless
5 74 (8.76%) SaaS
6 67 (7.93%) Azure DevOps
7 65 (7.69%) AWS Lambda
8 38 (4.50%) GitHub
9 36 (4.26%) Azure Service Bus
10 33 (3.91%) Azure Cosmos DB
11 29 (3.43%) AWS CloudFormation
12 24 (2.84%) SonarCloud
13 22 (2.60%) Apigee
14 19 (2.25%) Google Kubernetes Engine
15 18 (2.13%) Amazon EC2
16 17 (2.01%) Amazon S3
16 17 (2.01%) npm
17 15 (1.78%) GitHub Actions
18 14 (1.66%) AWS KMS
19 13 (1.54%) PaaS
Communications & Networking
1 18 (2.13%) Internet
2 15 (1.78%) Network Security
3 4 (0.47%) DAB
4 3 (0.36%) TCP/IP
5 2 (0.24%) Broadband
5 2 (0.24%) Firewall
5 2 (0.24%) VPN
6 1 (0.12%) 3GPP
6 1 (0.12%) 4G
6 1 (0.12%) 5G
6 1 (0.12%) Diameter Protocol
6 1 (0.12%) HTTP
6 1 (0.12%) MQTT
6 1 (0.12%) OpenVPN
6 1 (0.12%) SCTP
6 1 (0.12%) SSH
6 1 (0.12%) VSAN
Database & Business Intelligence
1 148 (17.51%) SQL Server
2 119 (14.08%) NoSQL
3 85 (10.06%) MongoDB
4 71 (8.40%) PostgreSQL
5 56 (6.63%) Elasticsearch
6 47 (5.56%) Relational Database
7 39 (4.62%) DynamoDB
8 38 (4.50%) Big Data
8 38 (4.50%) MySQL
9 30 (3.55%) Azure SQL Database
10 22 (2.60%) Redis
11 13 (1.54%) Data Lake
12 11 (1.30%) Data Warehouse
12 11 (1.30%) RDBMS
13 6 (0.71%) NonStop SQL
13 6 (0.71%) Oracle Database
13 6 (0.71%) Tableau
14 5 (0.59%) Amazon Aurora
15 4 (0.47%) InterSystems Cache
15 4 (0.47%) Oracle ODI
Development Applications
1 135 (15.98%) Git
2 116 (13.73%) SonarQube
3 114 (13.49%) Maven
4 112 (13.25%) JIRA
4 112 (13.25%) Sonatype Nexus
5 104 (12.31%) GitLab
6 99 (11.72%) Cucumber
7 90 (10.65%) Selenium
8 85 (10.06%) Bitbucket
9 68 (8.05%) Jenkins
10 41 (4.85%) JUnit
11 38 (4.50%) Visual Studio
12 27 (3.20%) Jasmine
12 27 (3.20%) Karma Test Runner
12 27 (3.20%) Mockito
12 27 (3.20%) Octopus Deploy
13 24 (2.84%) MSBuild
13 24 (2.84%) Team Foundation Server
14 23 (2.72%) Protractor
15 22 (2.60%) webpack
General
1 317 (37.51%) Finance
2 241 (28.52%) Banking
3 184 (21.78%) Social Skills
4 141 (16.69%) Inclusion and Diversity
5 84 (9.94%) Retail
6 28 (3.31%) Law
7 21 (2.49%) Corporate Banking
7 21 (2.49%) Investment Banking
8 19 (2.25%) Analytical Skills
9 18 (2.13%) Games
9 18 (2.13%) Public Sector
10 12 (1.42%) Automotive
11 10 (1.18%) Advertising
12 9 (1.07%) Marketing
13 8 (0.95%) Pharmaceutical
14 7 (0.83%) Back Office
14 7 (0.83%) Tech for Good
15 5 (0.59%) Documentation Skills
15 5 (0.59%) Front Office
16 4 (0.47%) Telecoms
Job Titles
1 256 (30.30%) Developer
2 240 (28.40%) Software Engineer
3 231 (27.34%) Senior
4 147 (17.40%) Architect
5 124 (14.67%) Lead
6 85 (10.06%) Solutions Architect
7 79 (9.35%) Senior Developer
8 72 (8.52%) Senior Software Engineer
9 70 (8.28%) .NET Developer
10 47 (5.56%) Java Developer
11 44 (5.21%) Java Engineer
12 38 (4.50%) Software Developer
13 35 (4.14%) C# Developer
14 33 (3.91%) Full-Stack Developer
14 33 (3.91%) Senior Architect
15 29 (3.43%) Senior Software Developer
16 27 (3.20%) Technical Architect
17 24 (2.84%) Java Software Engineer
18 23 (2.72%) Data Scientist
18 23 (2.72%) Senior Data Scientist
Libraries, Frameworks & Software Standards
1 298 (35.27%) React
2 219 (25.92%) .NET
3 202 (23.91%) Spring
4 186 (22.01%) Spring Boot
5 184 (21.78%) HTML
6 171 (20.24%) CSS
7 161 (19.05%) Kafka
8 148 (17.51%) RESTful
9 128 (15.15%) REST
10 123 (14.56%) AngularJS
11 109 (12.90%) Node.js
12 107 (12.66%) Hibernate
13 106 (12.54%) JPA
14 102 (12.07%) .NET Core
15 101 (11.95%) Redux
16 80 (9.47%) ASP.NET
17 67 (7.93%) .NET Framework
18 59 (6.98%) RabbitMQ
19 49 (5.80%) GraphQL
20 47 (5.56%) HTML5
Miscellaneous
1 158 (18.70%) Product Ownership
2 93 (11.01%) Enterprise Software
3 74 (8.76%) Cloud Native
4 61 (7.22%) Algorithms
5 36 (4.26%) Distributed Systems
5 36 (4.26%) Management Information System
6 34 (4.02%) Greenfield Project
7 29 (3.43%) Legacy Systems
8 26 (3.08%) Public Cloud
9 25 (2.96%) Cyberattack
10 18 (2.13%) Private Cloud
11 17 (2.01%) IoT
12 16 (1.89%) Mobile App
13 15 (1.78%) Virtual Team
14 12 (1.42%) Mobile Games
15 11 (1.30%) Data Structures
16 9 (1.07%) Online Banking
17 8 (0.95%) Credit Risk
17 8 (0.95%) Distributed Applications
17 8 (0.95%) Distributed Architecture
Operating Systems
1 67 (7.93%) Linux
2 19 (2.25%) Unix
3 17 (2.01%) Android
3 17 (2.01%) Windows
4 7 (0.83%) Apple iOS
5 2 (0.24%) Debian
6 1 (0.12%) Red Hat Enterprise Linux
6 1 (0.12%) Ubuntu
6 1 (0.12%) Windows Server
Processes & Methodologies
1 451 (53.37%) Agile
2 429 (50.77%) DevOps
3 406 (48.05%) Software Engineering
4 329 (38.93%) CI/CD
5 272 (32.19%) Containerisation
6 230 (27.22%) Test Automation
7 223 (26.39%) Full-Stack Development
8 205 (24.26%) TDD
9 200 (23.67%) Mentoring
10 154 (18.22%) Event-Driven
11 152 (17.99%) Problem-Solving
12 145 (17.16%) Clean Code
13 141 (16.69%) SDLC
14 132 (15.62%) Continuous Improvement
15 130 (15.38%) Front End Development
16 127 (15.03%) Unit Testing
17 125 (14.79%) Event-Driven Architecture
17 125 (14.79%) Performance Optimisation
18 104 (12.31%) Design Patterns
19 95 (11.24%) Roadmaps
Programming Languages
1 390 (46.15%) Java
2 311 (36.80%) JavaScript
3 304 (35.98%) SQL
4 228 (26.98%) C#
5 146 (17.28%) TypeScript
6 135 (15.98%) Python
7 54 (6.39%) Go
8 27 (3.20%) PHP
9 26 (3.08%) C++
10 19 (2.25%) C
11 15 (1.78%) Kotlin
12 13 (1.54%) Ruby
13 10 (1.18%) Rust
14 9 (1.07%) Perl
15 8 (0.95%) Groovy
15 8 (0.95%) PowerShell
15 8 (0.95%) T-SQL
16 7 (0.83%) R
17 5 (0.59%) Bash
17 5 (0.59%) Shell Script
Qualifications
1 108 (12.78%) Degree
2 77 (9.11%) Security Cleared
3 74 (8.76%) Computer Science Degree
4 39 (4.62%) SC Cleared
5 38 (4.50%) AWS Certification
6 31 (3.67%) AWS Certified Solutions Architect
7 29 (3.43%) DV Cleared
8 15 (1.78%) Master's Degree
9 12 (1.42%) Azure Certification
10 7 (0.83%) DBS Check
11 5 (0.59%) TOGAF Certification
12 3 (0.36%) AWS Certified Developer
12 3 (0.36%) OCP
12 3 (0.36%) Oracle Certification
12 3 (0.36%) PhD
13 2 (0.24%) Cisco Certification
13 2 (0.24%) CISM
13 2 (0.24%) CISSP
13 2 (0.24%) ISTQB
13 2 (0.24%) ISTQB Foundation Certification
Quality Assurance & Compliance
1 130 (15.38%) QA
2 52 (6.15%) GDPR
3 34 (4.02%) Accessibility
4 19 (2.25%) HIPAA
5 7 (0.83%) Basel II
5 7 (0.83%) Basel III
5 7 (0.83%) Dodd-Frank
5 7 (0.83%) IFRS
5 7 (0.83%) IFRS 9
5 7 (0.83%) NIST
5 7 (0.83%) PCI DSS
6 6 (0.71%) CDISC
7 3 (0.36%) ISO/IEC 27001
8 2 (0.24%) Cyber Essentials
9 1 (0.12%) Actionable Recommendations
9 1 (0.12%) GRC
9 1 (0.12%) ISO 15022
9 1 (0.12%) ISO 20022
9 1 (0.12%) NCSC
9 1 (0.12%) WCAG
System Software
1 388 (45.92%) Docker
2 1 (0.12%) Active Directory
2 1 (0.12%) Virtual Machines
2 1 (0.12%) VMware Infrastructure
2 1 (0.12%) VMware NSX
Systems Management
1 358 (42.37%) Kubernetes
2 93 (11.01%) Terraform
3 34 (4.02%) Prometheus
4 23 (2.72%) Grafana
5 16 (1.89%) Istio
6 12 (1.42%) Ansible
7 11 (1.30%) Argo
8 3 (0.36%) Packer
8 3 (0.36%) Progress Chef
9 1 (0.12%) Check_MK
9 1 (0.12%) FortiGate
9 1 (0.12%) Kibana
9 1 (0.12%) Kustomize
9 1 (0.12%) logstash
9 1 (0.12%) Microsoft Intune
9 1 (0.12%) Opsgenie
9 1 (0.12%) Puppet
9 1 (0.12%) Single Sign-On
Vendors
1 90 (10.65%) Microsoft
2 85 (10.06%) Solace
3 50 (5.92%) Google
4 40 (4.73%) IBM
5 18 (2.13%) Oracle
6 13 (1.54%) Dynatrace
7 8 (0.95%) Atlassian
7 8 (0.95%) Cisco
7 8 (0.95%) New Relic
8 6 (0.71%) Apple
9 5 (0.59%) YouTube
10 4 (0.47%) AppDynamics
10 4 (0.47%) Facebook
10 4 (0.47%) Progress
10 4 (0.47%) Splunk
11 3 (0.36%) Databricks
11 3 (0.36%) SAP
11 3 (0.36%) TIBCO
12 2 (0.24%) CA Agile Central
12 2 (0.24%) OpenAI