PowerShell Jobs with Hybrid/Remote/WFH Options

Windows PowerShell
UK > Work from Home

The table below provides summary statistics for permanent remote or hybrid work requiring PowerShell skills. It includes a benchmarking guide to the annual salaries offered in vacancies that cited PowerShell over the 6 months leading up to 2 May 2025, comparing them to the same period in the previous two years.

6 months to
2 May 2025
Same period 2024 Same period 2023
Rank 104 126 88
Rank change year-on-year +22 -38 +32
Permanent jobs citing PowerShell 453 835 1,600
As % of all permanent jobs with a WFH option 3.03% 2.47% 3.75%
As % of the Programming Languages category 7.57% 6.06% 7.62%
Number of salaries quoted 374 697 1,223
10th Percentile £36,250 £39,450 £39,000
25th Percentile £47,500 £46,250 £49,250
Median annual salary (50th Percentile) £57,500 £58,000 £60,000
Median % change year-on-year -0.86% -3.33% -4.00%
75th Percentile £75,000 £77,500 £84,625
90th Percentile £90,000 £90,774 £105,000
UK median annual salary £60,000 £55,000 £60,000
% change year-on-year +9.09% -8.33% -

All Programming Languages
Work from Home

PowerShell falls under the Programming Languages category. For comparison with the information above, the following table provides summary statistics for all permanent job vacancies with remote or hybrid options requiring coding skills.

Permanent vacancies with a requirement for coding skills 5,982 13,776 21,000
As % of all permanent jobs with a WFH option 39.97% 40.70% 49.18%
Number of salaries quoted 4,850 11,429 15,460
10th Percentile £41,250 £38,750 £41,000
25th Percentile £47,683 £46,250 £50,000
Median annual salary (50th Percentile) £62,500 £60,000 £65,000
Median % change year-on-year +4.17% -7.69% +4.00%
75th Percentile £83,750 £78,750 £85,000
90th Percentile £111,250 £100,000 £105,000
UK median annual salary £60,000 £60,000 £65,000
% change year-on-year - -7.69% +4.00%

PowerShell
Trend for Jobs with a WFH Option

Job vacancies with remote working options citing PowerShell as a proportion of all IT jobs advertised.
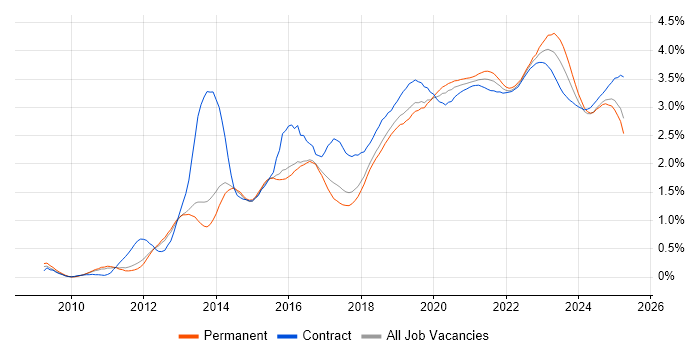
PowerShell trend for jobs with Hybrid/Remote/WFH options

PowerShell
Salary Trend for Jobs with a WFH Option

3-month moving average salary quoted in job vacancies with remote working options citing PowerShell.

PowerShell salary trend for jobs with a WFH option

PowerShell
Salary Histogram for Jobs with a WFH Option

Salary distribution for jobs with remote working options citing PowerShell over the 6 months to 2 May 2025.

PowerShell salary histogram for jobs with a WFH option

PowerShell
Co-occurring Skills and Capabilities with WFH Options by Category

The follow tables expand on the table above by listing co-occurrences grouped by category. The same employment type, locality and period is covered with up to 20 co-occurrences shown in each of the following categories:

Application Platforms
1 88 (19.43%) Microsoft Exchange
2 59 (13.02%) SharePoint
3 19 (4.19%) IIS
4 8 (1.77%) Apache Spark
5 5 (1.10%) Apache
5 5 (1.10%) Apache Airflow
5 5 (1.10%) Tomcat
6 3 (0.66%) Apache Solr
6 3 (0.66%) CMS
6 3 (0.66%) Confluence
6 3 (0.66%) Skype for Business
7 2 (0.44%) SharePoint Server
8 1 (0.22%) NetWeaver
8 1 (0.22%) OpenEdge
Applications
1 23 (5.08%) Microsoft Office
2 10 (2.21%) Microsoft Excel
3 1 (0.22%) 1Password
3 1 (0.22%) Microsoft PowerPoint
3 1 (0.22%) MS Visio
Business Applications
1 6 (1.32%) Dynamics CRM
2 5 (1.10%) Elite 3E
3 3 (0.66%) Sage 50
4 1 (0.22%) Oracle Applications
4 1 (0.22%) SAP HCM
Cloud Services
1 277 (61.15%) Azure
2 154 (34.00%) Microsoft 365
3 91 (20.09%) Entra ID
4 82 (18.10%) AWS
5 61 (13.47%) Power Platform
6 49 (10.82%) Azure DevOps
7 42 (9.27%) Power Automate
8 41 (9.05%) PowerApps
9 39 (8.61%) SaaS
10 29 (6.40%) GitHub
11 24 (5.30%) GCP
11 24 (5.30%) PaaS
12 21 (4.64%) IaaS
13 19 (4.19%) GitHub Actions
14 17 (3.75%) Azure Logic Apps
14 17 (3.75%) Azure Monitor
15 15 (3.31%) Serverless
16 14 (3.09%) Cloud Computing
17 13 (2.87%) Azure AKS
17 13 (2.87%) OneDrive
Communications & Networking
1 87 (19.21%) Firewall
2 47 (10.38%) DNS
3 41 (9.05%) DHCP
4 36 (7.95%) WAN
5 27 (5.96%) VPN
6 26 (5.74%) SAN
6 26 (5.74%) TCP/IP
7 25 (5.52%) LAN
7 25 (5.52%) VLAN
8 13 (2.87%) Network Security
8 13 (2.87%) VoIP
9 10 (2.21%) NAS
9 10 (2.21%) SD-WAN
10 8 (1.77%) HTTPS
11 6 (1.32%) Intranet
12 5 (1.10%) ADSL
12 5 (1.10%) DMARC
12 5 (1.10%) Internet
12 5 (1.10%) Unified Communications
12 5 (1.10%) VSAN
Database & Business Intelligence
1 69 (15.23%) SQL Server
2 37 (8.17%) Power BI
3 34 (7.51%) Data Warehouse
4 28 (6.18%) SQL Server Integration Services
5 20 (4.42%) SQL Server Reporting Services
6 15 (3.31%) Azure SQL Database
7 11 (2.43%) PostgreSQL
8 10 (2.21%) Big Data
9 9 (1.99%) MySQL
10 8 (1.77%) Amazon RDS
10 8 (1.77%) Relational Database
11 6 (1.32%) Microsoft Analysis Services
12 5 (1.10%) MongoDB
13 4 (0.88%) Data Lake
14 3 (0.66%) Airbyte
14 3 (0.66%) Azure SQL Data Warehouse
14 3 (0.66%) Elasticsearch
14 3 (0.66%) Metadata
14 3 (0.66%) NoSQL
14 3 (0.66%) Qlik Sense
Development Applications
1 24 (5.30%) Git
2 15 (3.31%) JIRA
3 14 (3.09%) Jenkins
4 6 (1.32%) Visual Studio
5 5 (1.10%) GitLab
5 5 (1.10%) IBM UrbanCode
6 4 (0.88%) Octopus Deploy
6 4 (0.88%) WiX
7 3 (0.66%) TeamCity
8 2 (0.44%) Artifactory
8 2 (0.44%) Bitbucket
8 2 (0.44%) ESLint
8 2 (0.44%) gulp
8 2 (0.44%) Sinon.JS
8 2 (0.44%) webpack
8 2 (0.44%) Yeoman
9 1 (0.22%) Atlassian Bamboo
9 1 (0.22%) Hudson
9 1 (0.22%) Sonatype Nexus
9 1 (0.22%) Zephyr
General
1 109 (24.06%) Social Skills
2 96 (21.19%) Finance
3 53 (11.70%) Analytical Skills
4 21 (4.64%) German Language
4 21 (4.64%) Legal
5 19 (4.19%) Law
6 18 (3.97%) Banking
7 17 (3.75%) Inclusion and Diversity
8 12 (2.65%) Telecoms
9 11 (2.43%) Back Office
9 11 (2.43%) Public Sector
10 9 (1.99%) Automotive
11 7 (1.55%) Organisational Skills
11 7 (1.55%) Retail
12 6 (1.32%) Advertising
12 6 (1.32%) Games
12 6 (1.32%) Manufacturing
13 5 (1.10%) Documentation Skills
13 5 (1.10%) Local Government
13 5 (1.10%) Marketing
Job Titles
1 57 (12.58%) Infrastructure Engineer
2 54 (11.92%) Senior
3 48 (10.60%) Developer
4 45 (9.93%) Support Engineer
5 43 (9.49%) Analyst
6 38 (8.39%) Lead
7 34 (7.51%) Azure Engineer
8 33 (7.28%) Cloud Engineer
9 32 (7.06%) IT Support
10 29 (6.40%) IT Engineer
11 26 (5.74%) Security Engineer
12 25 (5.52%) DevOps Engineer
12 25 (5.52%) Security Specialist
13 23 (5.08%) 3rd Line Support
13 23 (5.08%) Information Security Specialist
13 23 (5.08%) Information Specialist
14 22 (4.86%) Administrator
15 21 (4.64%) 3rd Line Engineer
15 21 (4.64%) Data Engineer
16 18 (3.97%) 3rd Line Support Engineer
Libraries, Frameworks & Software Standards
1 30 (6.62%) REST
2 23 (5.08%) .NET
3 21 (4.64%) SailPoint
4 16 (3.53%) HTML
4 16 (3.53%) SOAP
5 14 (3.09%) React
6 13 (2.87%) JSON
6 13 (2.87%) Pandas
6 13 (2.87%) Web Services
7 10 (2.21%) ARM Templates
7 10 (2.21%) CSS
8 8 (1.77%) .NET Framework
8 8 (1.77%) XML
9 7 (1.55%) GraphQL
9 7 (1.55%) Middleware
9 7 (1.55%) YAML
10 6 (1.32%) RESTful
11 5 (1.10%) Entity Framework
11 5 (1.10%) FIX Protocol
11 5 (1.10%) LDAP
Miscellaneous
1 46 (10.15%) Management Information System
2 27 (5.96%) Onboarding
3 24 (5.30%) Data Centre
3 24 (5.30%) Hybrid Cloud
4 21 (4.64%) Virtual Team
5 16 (3.53%) Cloud Native
6 15 (3.31%) Security Posture
7 14 (3.09%) Public Cloud
7 14 (3.09%) Self-Motivation
8 10 (2.21%) Clustering
8 10 (2.21%) Hedge funds
9 9 (1.99%) Podcast
10 8 (1.77%) Greenfield Project
10 8 (1.77%) Product Ownership
10 8 (1.77%) Replication
11 6 (1.32%) Driving Licence
11 6 (1.32%) Enterprise Software
12 5 (1.10%) Linux Command Line
12 5 (1.10%) Mainframe
12 5 (1.10%) NHS
Operating Systems
1 193 (42.60%) Windows
2 101 (22.30%) Windows Server
3 92 (20.31%) Linux
4 31 (6.84%) Windows Server 2019
5 27 (5.96%) Windows Server 2016
6 19 (4.19%) Red Hat Enterprise Linux
7 16 (3.53%) Unix
8 15 (3.31%) Windows 10
9 9 (1.99%) VMS
10 8 (1.77%) Mac OS
11 6 (1.32%) Ubuntu
11 6 (1.32%) Windows Server 2012
12 4 (0.88%) Android
12 4 (0.88%) Apple iOS
12 4 (0.88%) Windows Server 2008
13 3 (0.66%) CentOS
14 2 (0.44%) Windows Server 2003
15 1 (0.22%) Windows 7
Processes & Methodologies
1 111 (24.50%) DevOps
2 93 (20.53%) Problem-Solving
3 86 (18.98%) CI/CD
4 78 (17.22%) Infrastructure Engineering
5 75 (16.56%) Mentoring
6 72 (15.89%) Cybersecurity
7 60 (13.25%) Infrastructure as Code
8 56 (12.36%) ITIL
9 48 (10.60%) Agile
9 48 (10.60%) Task Automation
10 45 (9.93%) Disaster Recovery
11 42 (9.27%) Information Security
11 42 (9.27%) Migration
12 40 (8.83%) Business Intelligence
12 40 (8.83%) Identity Management
12 40 (8.83%) Risk Management
13 38 (8.39%) Containerisation
13 38 (8.39%) Infrastructure Management
13 38 (8.39%) Project Delivery
14 34 (7.51%) Identity Access Management
Programming Languages
1 170 (37.53%) Python
2 118 (26.05%) SQL
3 89 (19.65%) Bash
4 46 (10.15%) C#
5 38 (8.39%) JavaScript
6 26 (5.74%) T-SQL
7 25 (5.52%) Java
8 17 (3.75%) TypeScript
9 14 (3.09%) Data Analysis Expressions
10 13 (2.87%) Bicep
11 10 (2.21%) Shell Script
12 8 (1.77%) R
13 6 (1.32%) Go
14 5 (1.10%) C++
14 5 (1.10%) JCL
15 4 (0.88%) Kusto Query Language
15 4 (0.88%) Perl
15 4 (0.88%) VBA
16 2 (0.44%) Progress 4GL
16 2 (0.44%) VBScript
Qualifications
1 96 (21.19%) Degree
2 45 (9.93%) Azure Certification
3 40 (8.83%) Microsoft Certification
4 28 (6.18%) Computer Science Degree
5 22 (4.86%) AWS Certification
6 20 (4.42%) CISSP
7 17 (3.75%) CompTIA Security+
8 14 (3.09%) CEH
8 14 (3.09%) Cisco Certification
8 14 (3.09%) Security Cleared
9 12 (2.65%) SANS
10 11 (2.43%) CCNA
10 11 (2.43%) GCIH
11 9 (1.99%) GCIA
11 9 (1.99%) OSCP
12 8 (1.77%) MCSA
12 8 (1.77%) Network+ Certification
13 7 (1.55%) DV Cleared
14 6 (1.32%) A+ Certification
15 5 (1.10%) MCSE
Quality Assurance & Compliance
1 28 (6.18%) GDPR
2 21 (4.64%) ISO/IEC 27001
3 18 (3.97%) Data Quality
4 14 (3.09%) NIST
5 11 (2.43%) SLA
6 10 (2.21%) Cyber Essentials
7 7 (1.55%) HIPAA
7 7 (1.55%) QA
8 6 (1.32%) Cyber Essentials PLUS
9 4 (0.88%) PCI DSS
9 4 (0.88%) Sarbanes-Oxley
10 2 (0.44%) Accessibility
10 2 (0.44%) ISO/IEC 27002 (supersedes ISO/IEC 17799)
11 1 (0.22%) Actionable Recommendations
11 1 (0.22%) COBIT
11 1 (0.22%) ISO 13485
System Software
1 175 (38.63%) Active Directory
2 68 (15.01%) VMware Infrastructure
3 29 (6.40%) Docker
3 29 (6.40%) Hyper-V
4 18 (3.97%) Virtual Machines
5 17 (3.75%) XenApp
6 13 (2.87%) VMware ESXi
7 11 (2.43%) vSphere
8 5 (1.10%) Firmware
8 5 (1.10%) Virtual Desktop
9 3 (0.66%) Dovecot
9 3 (0.66%) Postfix
10 2 (0.44%) EMC RecoverPoint
10 2 (0.44%) Virtual Servers
10 2 (0.44%) VMware NSX
10 2 (0.44%) XenDesktop
11 1 (0.22%) Microsoft App-V
Systems Management
1 76 (16.78%) Microsoft Intune
2 58 (12.80%) Terraform
3 49 (10.82%) Ansible
4 40 (8.83%) Kubernetes
5 33 (7.28%) SCCM
6 18 (3.97%) Single Sign-On
7 10 (2.21%) Prometheus
7 10 (2.21%) SCOM
8 9 (1.99%) vCenter Server
9 8 (1.77%) Puppet
10 6 (1.32%) Active Directory Federation Services
10 6 (1.32%) Progress Chef
10 6 (1.32%) SCOrch
11 5 (1.10%) CA Endevor
11 5 (1.10%) WSUS
12 4 (0.88%) Grafana
12 4 (0.88%) ZABBIX
13 3 (0.66%) Failover Clustering
13 3 (0.66%) Jamf Pro
13 3 (0.66%) linkerd
Vendors
1 248 (54.75%) Microsoft
2 95 (20.97%) VMware
3 30 (6.62%) Cisco
3 30 (6.62%) Okta
4 26 (5.74%) Citrix
5 23 (5.08%) Meraki
6 21 (4.64%) Oracle
6 21 (4.64%) Salesforce
7 20 (4.42%) Red Hat
8 17 (3.75%) SonicWALL
9 16 (3.53%) ServiceNow
10 15 (3.31%) CheckPoint
11 13 (2.87%) iManage
11 13 (2.87%) Intapp
12 10 (2.21%) Databricks
12 10 (2.21%) Google
13 9 (1.99%) CrowdStrike
14 8 (1.77%) Fortinet
15 7 (1.55%) EMC
16 6 (1.32%) Veeam