Infrastructure Automation Jobs

Infrastructure Automation
UK

The table below provides summary statistics for permanent job vacancies requiring Infrastructure Automation skills. It includes a benchmarking guide to the annual salaries offered in vacancies that cited Infrastructure Automation over the 6 months leading up to 22 May 2025, comparing them to the same period in the previous two years.

6 months to
22 May 2025
Same period 2024 Same period 2023
Rank 581 726 629
Rank change year-on-year +145 -97 +26
Permanent jobs citing Infrastructure Automation 133 188 357
As % of all permanent jobs advertised in the UK 0.24% 0.19% 0.36%
As % of the Processes & Methodologies category 0.26% 0.22% 0.38%
Number of salaries quoted 92 148 183
10th Percentile £52,500 £50,000 £48,400
25th Percentile £60,000 £57,500 £62,500
Median annual salary (50th Percentile) £80,000 £67,500 £67,500
Median % change year-on-year +18.52% - -3.57%
75th Percentile £90,000 £77,500 £95,000
90th Percentile £110,000 £95,000 £115,000
UK excluding London median annual salary £62,500 £62,500 £65,000
% change year-on-year - -3.85% +18.18%

All Process and Methodology Skills
UK

Infrastructure Automation falls under the Processes and Methodologies category. For comparison with the information above, the following table provides summary statistics for all permanent job vacancies requiring process or methodology skills.

Permanent vacancies with a requirement for process or methodology skills 51,521 85,132 94,507
As % of all permanent jobs advertised in the UK 93.87% 85.14% 95.59%
Number of salaries quoted 25,367 59,760 55,710
10th Percentile £29,625 £29,078 £34,000
25th Percentile £41,250 £40,000 £45,000
Median annual salary (50th Percentile) £57,500 £55,000 £61,000
Median % change year-on-year +4.55% -9.84% +1.67%
75th Percentile £75,000 £72,500 £81,250
90th Percentile £97,500 £92,500 £100,000
UK excluding London median annual salary £51,645 £50,000 £55,000
% change year-on-year +3.29% -9.09% +4.76%

Infrastructure Automation
Job Vacancy Trend

Job postings citing Infrastructure Automation as a proportion of all IT jobs advertised.
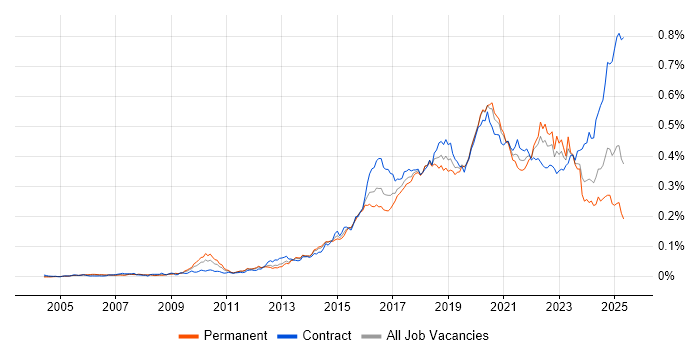
Job vacancy trend for Infrastructure Automation in the UK

Infrastructure Automation
Salary Trend

3-month moving average salary quoted in jobs citing Infrastructure Automation.

Salary trend for Infrastructure Automation in the UK

Infrastructure Automation
Salary Histogram

Salary distribution for jobs citing Infrastructure Automation over the 6 months to 22 May 2025.

Salary histogram for Infrastructure Automation in the UK

Infrastructure Automation
Top 16 Job Locations

The table below looks at the demand and provides a guide to the median salaries quoted in IT jobs citing Infrastructure Automation within the UK over the 6 months to 22 May 2025. The 'Rank Change' column provides an indication of the change in demand within each location based on the same 6 month period last year.

Location Rank Change
on Same Period
Last Year
Matching
Permanent
IT Job Ads
Median Salary
Past 6 Months
Median Salary
% Change
on Same Period
Last Year
Live
Jobs
England +114 126 £80,000 +17.65% 329
London +117 68 £82,500 +10.00% 211
UK excluding London +138 54 £62,500 - 171
Work from Home +98 46 £77,500 +10.71% 152
North of England +51 25 £61,250 +2.08% 42
South East +65 18 £75,000 +20.00% 78
North West +3 17 £60,000 -4.00% 17
Yorkshire +60 5 £62,500 +4.17% 18
South West +99 3 - - 10
North East +45 3 £57,500 -28.13% 7
Scotland +124 2 £55,000 -3.51% 11
Wales +42 2 £57,500 +6.98%
East of England +33 2 £45,000 -34.55% 12
West Midlands +63 1 £77,500 +14.81% 6
Midlands +47 1 £77,500 +21.57% 16
Isle of Man - 1 £34,500 -

Infrastructure Automation
Co-occurring Skills and Capabilities by Category

The follow tables expand on the table above by listing co-occurrences grouped by category. The same employment type, locality and period is covered with up to 20 co-occurrences shown in each of the following categories:

Application Platforms
1 6 (4.51%) Apache
1 6 (4.51%) Apache Spark
1 6 (4.51%) IIS
2 2 (1.50%) Confluence
2 2 (1.50%) Microsoft Exchange
3 1 (0.75%) Apache Airflow
3 1 (0.75%) nginx
3 1 (0.75%) SharePoint
Cloud Services
1 84 (63.16%) Azure
2 57 (42.86%) AWS
3 39 (29.32%) GitHub
4 36 (27.07%) Azure DevOps
5 31 (23.31%) GCP
6 22 (16.54%) Serverless
7 20 (15.04%) AWS CloudFormation
7 20 (15.04%) PaaS
8 19 (14.29%) GitHub Actions
9 17 (12.78%) Entra ID
10 16 (12.03%) AWS Lambda
11 15 (11.28%) Azure Monitor
12 13 (9.77%) Amazon EC2
12 13 (9.77%) Amazon S3
13 12 (9.02%) Amazon EKS
13 12 (9.02%) SaaS
14 11 (8.27%) IaaS
15 10 (7.52%) Virtual Private Cloud
16 8 (6.02%) Azure Key Vault
17 7 (5.26%) Amazon ECS
Communications & Networking
1 31 (23.31%) Firewall
2 22 (16.54%) VPN
3 16 (12.03%) DNS
4 9 (6.77%) Network Security
5 6 (4.51%) DHCP
6 5 (3.76%) TCP/IP
7 3 (2.26%) WAN
8 2 (1.50%) BGP
8 2 (1.50%) LAN
8 2 (1.50%) SAN
9 1 (0.75%) Ethernet VPN
9 1 (0.75%) Internet
9 1 (0.75%) NAS
9 1 (0.75%) OSPF
9 1 (0.75%) SSL
9 1 (0.75%) Structured Cabling
Database & Business Intelligence
1 14 (10.53%) SQL Server
2 12 (9.02%) Amazon RDS
3 6 (4.51%) Big Data
4 5 (3.76%) DynamoDB
5 4 (3.01%) Data Lake
6 3 (2.26%) Amazon Athena
6 3 (2.26%) Amazon Redshift
6 3 (2.26%) Data Warehouse
7 2 (1.50%) Amazon Aurora
7 2 (1.50%) Azure SQL Data Warehouse
7 2 (1.50%) Azure SQL Database
7 2 (1.50%) HDInsight
7 2 (1.50%) MongoDB
7 2 (1.50%) Oracle Database
7 2 (1.50%) PostgreSQL
7 2 (1.50%) Power BI
7 2 (1.50%) Redis
8 1 (0.75%) BigQuery
8 1 (0.75%) Elasticsearch
8 1 (0.75%) Relational Database
Development Applications
1 19 (14.29%) GitLab
1 19 (14.29%) Jenkins
2 13 (9.77%) Git
3 5 (3.76%) JIRA
4 3 (2.26%) Artifactory
4 3 (2.26%) Maven
4 3 (2.26%) SonarQube
5 2 (1.50%) Atlassian Bamboo
5 2 (1.50%) CircleCI
5 2 (1.50%) JUnit
5 2 (1.50%) Mockito
5 2 (1.50%) Octopus Deploy
5 2 (1.50%) Postman
5 2 (1.50%) REST Assured
5 2 (1.50%) SoapUI
5 2 (1.50%) Subversion
5 2 (1.50%) TeamCity
5 2 (1.50%) Xcode
5 2 (1.50%) XCTest
6 1 (0.75%) Jaeger
General
1 36 (27.07%) Finance
1 36 (27.07%) Social Skills
2 14 (10.53%) Banking
3 8 (6.02%) Law
4 7 (5.26%) Analytical Skills
5 6 (4.51%) Telecoms
6 5 (3.76%) Front Office
6 5 (3.76%) Public Sector
7 4 (3.01%) Advertising
8 3 (2.26%) Marketing
9 2 (1.50%) Automotive
9 2 (1.50%) Games
9 2 (1.50%) Inclusion and Diversity
9 2 (1.50%) Manufacturing
10 1 (0.75%) Electronics
10 1 (0.75%) Investment Banking
10 1 (0.75%) Retail
Job Titles
1 39 (29.32%) Senior
2 29 (21.80%) Azure Engineer
2 29 (21.80%) Cloud Engineer
3 27 (20.30%) DevOps Engineer
4 20 (15.04%) Infrastructure Engineer
5 18 (13.53%) Senior Cloud Engineer
6 17 (12.78%) Platform Engineer
7 15 (11.28%) AWS Engineer
8 11 (8.27%) Cloud Platform Engineer
8 11 (8.27%) Lead
9 9 (6.77%) Architect
9 9 (6.77%) Cloud Infrastructure Engineer
9 9 (6.77%) Senior Infrastructure Engineer
10 8 (6.02%) Automation Engineer
10 8 (6.02%) Azure Infrastructure Engineer
10 8 (6.02%) Senior Platform Engineer
11 7 (5.26%) AWS DevOps
11 7 (5.26%) AWS DevOps Engineer
12 6 (4.51%) Infrastructure Manager
12 6 (4.51%) Network Engineer
Libraries, Frameworks & Software Standards
1 12 (9.02%) YAML
2 11 (8.27%) ARM Templates
3 10 (7.52%) Elastic Stack
4 5 (3.76%) REST
4 5 (3.76%) RESTful
4 5 (3.76%) Spring
4 5 (3.76%) Spring Boot
4 5 (3.76%) Web Services
5 3 (2.26%) AngularJS
5 3 (2.26%) AWS CDK
5 3 (2.26%) Kafka
6 2 (1.50%) Bootstrap
6 2 (1.50%) Hibernate
6 2 (1.50%) HTML
6 2 (1.50%) J2EE
6 2 (1.50%) Material-UI
6 2 (1.50%) PySpark
6 2 (1.50%) React
6 2 (1.50%) Spring Cloud
6 2 (1.50%) Swagger
Miscellaneous
1 13 (9.77%) Hybrid Cloud
2 11 (8.27%) Data Centre
3 10 (7.52%) Cloud Native
4 9 (6.77%) Management Information System
5 8 (6.02%) Public Cloud
6 7 (5.26%) Clustering
6 7 (5.26%) Cyber Threat
7 6 (4.51%) Replication
8 5 (3.76%) Enterprise Cloud
9 4 (3.01%) Distributed Systems
9 4 (3.01%) Legacy Systems
9 4 (3.01%) Virtual Team
10 3 (2.26%) Private Cloud
11 2 (1.50%) Hedge funds
11 2 (1.50%) IoT
11 2 (1.50%) Mobile App
11 2 (1.50%) Self-Motivation
12 1 (0.75%) Life Science
12 1 (0.75%) Mainframe
12 1 (0.75%) Media Streaming
Operating Systems
1 46 (34.59%) Linux
2 27 (20.30%) Windows
3 10 (7.52%) Red Hat Enterprise Linux
3 10 (7.52%) Windows Server
4 8 (6.02%) Unix
5 4 (3.01%) Windows Server 2019
6 3 (2.26%) CentOS
6 3 (2.26%) VMS
6 3 (2.26%) Windows Server 2016
7 2 (1.50%) Ubuntu
8 1 (0.75%) Solaris
Processes & Methodologies
1 83 (62.41%) DevOps
2 77 (57.89%) CI/CD
3 73 (54.89%) Infrastructure as Code
4 43 (32.33%) Problem-Solving
5 37 (27.82%) Agile
6 31 (23.31%) Containerisation
7 26 (19.55%) Platform Engineering
8 25 (18.80%) Infrastructure Engineering
9 22 (16.54%) High Availability
10 21 (15.79%) Mentoring
11 17 (12.78%) Analytics
11 17 (12.78%) Observability
12 16 (12.03%) Configuration Management
12 16 (12.03%) Disaster Recovery
13 15 (11.28%) Computer Science
14 14 (10.53%) Cloud Security
14 14 (10.53%) Cost Management
14 14 (10.53%) Incident Management
14 14 (10.53%) Infrastructure Management
15 12 (9.02%) Microservices
Programming Languages
1 71 (53.38%) Python
2 42 (31.58%) PowerShell
3 40 (30.08%) Bash
4 21 (15.79%) SQL
5 17 (12.78%) Bicep
6 15 (11.28%) Java
7 6 (4.51%) C#
7 6 (4.51%) JavaScript
7 6 (4.51%) TypeScript
8 4 (3.01%) Shell Script
9 3 (2.26%) Go
9 3 (2.26%) Groovy
9 3 (2.26%) Scala
10 2 (1.50%) T-SQL
11 1 (0.75%) Perl
11 1 (0.75%) R
11 1 (0.75%) Ruby
Qualifications
1 20 (15.04%) Azure Certification
2 17 (12.78%) Degree
3 10 (7.52%) Security Cleared
4 9 (6.77%) Microsoft Certification
5 8 (6.02%) Computer Science Degree
5 8 (6.02%) SC Cleared
6 4 (3.01%) AWS Certification
7 2 (1.50%) AWS Certified Solutions Architect
7 2 (1.50%) Cisco Certification
7 2 (1.50%) DV Cleared
7 2 (1.50%) Master's Degree
7 2 (1.50%) VMware Certified Professional (VCP)
8 1 (0.75%) CCNA
8 1 (0.75%) CCNP
8 1 (0.75%) PhD
Quality Assurance & Compliance
1 7 (5.26%) QA
2 5 (3.76%) ISO/IEC 27001
3 3 (2.26%) GDPR
3 3 (2.26%) NIST
4 2 (1.50%) Cyber Essentials
5 1 (0.75%) Data Quality
5 1 (0.75%) HIPAA
5 1 (0.75%) NCSC
5 1 (0.75%) Sarbanes-Oxley
5 1 (0.75%) SOC 2
System Software
1 40 (30.08%) Docker
2 25 (18.80%) Active Directory
3 13 (9.77%) VMware Infrastructure
4 11 (8.27%) Virtual Machines
5 6 (4.51%) Virtual Desktop
6 5 (3.76%) Hyper-V
7 3 (2.26%) VMware ESXi
7 3 (2.26%) vSphere
8 2 (1.50%) VMware NSX
Systems Management
1 95 (71.43%) Terraform
2 62 (46.62%) Kubernetes
3 42 (31.58%) Ansible
4 15 (11.28%) Prometheus
5 13 (9.77%) Grafana
6 7 (5.26%) Puppet
7 6 (4.51%) Argo
8 5 (3.76%) Microsoft Intune
8 5 (3.76%) SCCM
9 4 (3.01%) Failover Clustering
9 4 (3.01%) Progress Chef
10 2 (1.50%) Docker Swarm
10 2 (1.50%) SCOM
11 1 (0.75%) Bugsnag
11 1 (0.75%) FortiGate
11 1 (0.75%) Istio
11 1 (0.75%) Kiali
11 1 (0.75%) Nessus
11 1 (0.75%) QRadar
11 1 (0.75%) vCenter Server
Vendors
1 32 (24.06%) Microsoft
2 31 (23.31%) VMware
3 11 (8.27%) Databricks
4 8 (6.02%) Red Hat
5 7 (5.26%) Atlassian
6 6 (4.51%) Cisco
6 6 (4.51%) Google
7 5 (3.76%) Citrix
7 5 (3.76%) Oracle
7 5 (3.76%) Splunk
8 3 (2.26%) Pure Storage
9 2 (1.50%) CA Agile Central
9 2 (1.50%) Dynatrace
9 2 (1.50%) ServiceNow
10 1 (0.75%) AppDynamics
10 1 (0.75%) DataCore
10 1 (0.75%) LogicMonitor
10 1 (0.75%) Mellanox
10 1 (0.75%) NVIDIA
10 1 (0.75%) Palo Alto