GCP Jobs with Hybrid/Remote/WFH Options

Google Cloud Platform (GCP)
UK > Work from Home

The table below provides summary statistics for permanent remote or hybrid work requiring GCP skills. It includes a benchmarking guide to the annual salaries offered in vacancies that cited GCP over the 6 months leading up to 8 May 2025, comparing them to the same period in the previous two years.

6 months to
8 May 2025
Same period 2024 Same period 2023
Rank 43 75 40
Rank change year-on-year +32 -35 +8
Permanent jobs citing GCP 976 1,326 2,763
As % of all permanent jobs with a WFH option 5.94% 3.92% 6.57%
As % of the Cloud Services category 15.93% 9.07% 13.77%
Number of salaries quoted 578 1,062 2,057
10th Percentile £52,259 £48,750 £46,250
25th Percentile £66,063 £60,670 £56,250
Median annual salary (50th Percentile) £85,253 £77,500 £77,500
Median % change year-on-year +10.00% - -
75th Percentile £110,000 £110,000 £103,750
90th Percentile £137,500 £142,500 £130,000
UK median annual salary £82,500 £77,500 £80,000
% change year-on-year +6.45% -3.13% -

All Cloud Skills
Work from Home

GCP falls under the Cloud Services category. For comparison with the information above, the following table provides summary statistics for all permanent job vacancies with remote or hybrid options requiring cloud computing skills.

Permanent vacancies with a requirement for cloud computing skills 6,125 14,614 20,070
As % of all permanent jobs with a WFH option 37.28% 43.25% 47.69%
Number of salaries quoted 4,576 11,962 14,701
10th Percentile £32,500 £35,750 £38,000
25th Percentile £46,250 £45,000 £48,750
Median annual salary (50th Percentile) £62,500 £60,000 £65,000
Median % change year-on-year +4.17% -7.69% -
75th Percentile £83,000 £78,750 £85,000
90th Percentile £109,375 £97,500 £102,500
UK median annual salary £60,000 £57,500 £65,000
% change year-on-year +4.35% -11.54% +4.00%

GCP
Trend for Jobs with a WFH Option

Job vacancies with remote working options citing GCP as a proportion of all IT jobs advertised.
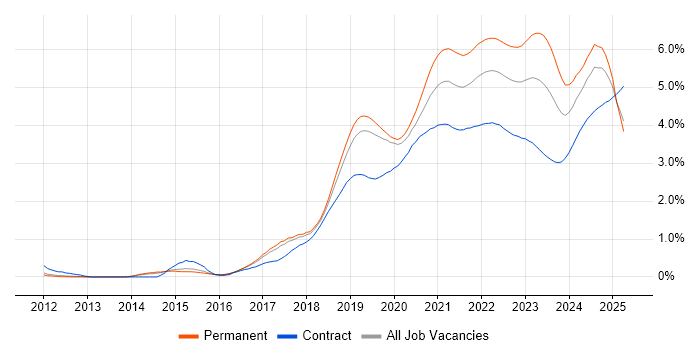
GCP trend for jobs with Hybrid/Remote/WFH options

GCP
Salary Trend for Jobs with a WFH Option

3-month moving average salary quoted in job vacancies with remote working options citing GCP.

GCP salary trend for jobs with a WFH option

GCP
Salary Histogram for Jobs with a WFH Option

Salary distribution for jobs with remote working options citing GCP over the 6 months to 8 May 2025.

GCP salary histogram for jobs with a WFH option

GCP
Co-occurring Skills and Capabilities with WFH Options by Category

The follow tables expand on the table above by listing co-occurrences grouped by category. The same employment type, locality and period is covered with up to 20 co-occurrences shown in each of the following categories:

Application Platforms
1 184 (18.85%) Confluence
2 106 (10.86%) Apache Airflow
3 60 (6.15%) Apache
4 14 (1.43%) Apache Spark
5 11 (1.13%) Umbraco
6 7 (0.72%) SAS
7 5 (0.51%) nginx
8 4 (0.41%) Tomcat
9 3 (0.31%) Apache Solr
9 3 (0.31%) Jupyter
9 3 (0.31%) OpenStack
10 2 (0.20%) WebSphere
10 2 (0.20%) WebSphere Application Server
11 1 (0.10%) CICS
11 1 (0.10%) CMS
11 1 (0.10%) IIS
Applications
1 10 (1.02%) Chatbot
1 10 (1.02%) Microsoft Excel
2 5 (0.51%) Microsoft Project
3 4 (0.41%) Trello
4 2 (0.20%) Microsoft PowerPoint
4 2 (0.20%) MS Visio
5 1 (0.10%) Adobe XD
5 1 (0.10%) Microsoft Office
5 1 (0.10%) Sketch
Business Applications
1 2 (0.20%) Oracle BPM
1 2 (0.20%) Oracle Subledger Accounting
2 1 (0.10%) SAP S/4HANA
2 1 (0.10%) Shopify
Cloud Services
1 750 (76.84%) AWS
2 664 (68.03%) Azure
3 124 (12.70%) dbt
4 66 (6.76%) SaaS
5 58 (5.94%) Snowflake
6 48 (4.92%) Amazon ECS
7 47 (4.82%) GitHub
8 44 (4.51%) Amazon EKS
9 38 (3.89%) Dagster
10 37 (3.79%) Amazon EC2
11 35 (3.59%) Power Platform
12 33 (3.38%) Cloud Computing
13 29 (2.97%) PaaS
14 24 (2.46%) Serverless
15 21 (2.15%) Google Kubernetes Engine
16 17 (1.74%) AWS CloudFormation
16 17 (1.74%) OpenShift
17 16 (1.64%) GitHub Actions
18 14 (1.43%) Apigee
18 14 (1.43%) Azure DevOps
Communications & Networking
1 19 (1.95%) TCP/IP
2 17 (1.74%) Firewall
3 10 (1.02%) DNS
4 7 (0.72%) NAS
4 7 (0.72%) SAN
4 7 (0.72%) VPN
5 6 (0.61%) Broadband
5 6 (0.61%) HTTP
5 6 (0.61%) Network Security
6 5 (0.51%) DHCP
6 5 (0.51%) Internet
6 5 (0.51%) VSAN
7 4 (0.41%) 5G
7 4 (0.41%) LAN
7 4 (0.41%) Multicast
7 4 (0.41%) WAN
8 3 (0.31%) MQTT
9 2 (0.20%) Cisco Nexus
9 2 (0.20%) FCoE
9 2 (0.20%) Fibre Channel
Database & Business Intelligence
1 173 (17.73%) SQL Server
2 111 (11.37%) PostgreSQL
3 103 (10.55%) Amazon Athena
4 98 (10.04%) Apache Iceberg
4 98 (10.04%) Dremio
5 94 (9.63%) Apache Arrow
6 86 (8.81%) NoSQL
7 64 (6.56%) BigQuery
8 57 (5.84%) Data Lake
9 55 (5.64%) Apache Ignite
10 38 (3.89%) MongoDB
11 36 (3.69%) MySQL
12 35 (3.59%) Power BI
13 26 (2.66%) Data Warehouse
14 22 (2.25%) Tableau
15 21 (2.15%) Big Data
16 19 (1.95%) Elasticsearch
16 19 (1.95%) Redis
17 16 (1.64%) Amazon Redshift
17 16 (1.64%) Looker
Development Applications
1 191 (19.57%) JIRA
2 190 (19.47%) Sonatype Nexus
3 183 (18.75%) SonarQube
4 181 (18.55%) Maven
5 176 (18.03%) GitLab
6 170 (17.42%) Cucumber
7 165 (16.91%) Selenium
8 158 (16.19%) Bitbucket
9 104 (10.66%) Git
10 81 (8.30%) Jenkins
11 22 (2.25%) webpack
12 17 (1.74%) JUnit
13 14 (1.43%) Cypress.io
14 13 (1.33%) Oracle Forms
15 11 (1.13%) IBM UrbanCode
16 9 (0.92%) Gradle
17 4 (0.41%) Appium
17 4 (0.41%) Visual Studio
18 3 (0.31%) MLflow
18 3 (0.31%) Mockito
General
1 560 (57.38%) Finance
2 436 (44.67%) Banking
3 301 (30.84%) Inclusion and Diversity
4 183 (18.75%) Social Skills
5 145 (14.86%) Front Office
6 55 (5.64%) Analytical Skills
7 34 (3.48%) Investment Banking
8 28 (2.87%) Games
9 24 (2.46%) Public Sector
10 23 (2.36%) Law
11 22 (2.25%) Telecoms
12 14 (1.43%) Influencing Skills
13 13 (1.33%) Retail
14 12 (1.23%) Marketing
14 12 (1.23%) Tech for Good
15 8 (0.82%) Presentation Skills
16 6 (0.61%) Cantonese Language
16 6 (0.61%) Mandarin Language
17 5 (0.51%) Advertising
18 4 (0.41%) Back Office
Job Titles
1 555 (56.86%) Software Engineer
2 313 (32.07%) Senior
3 186 (19.06%) Senior Software Engineer
4 156 (15.98%) Developer
5 106 (10.86%) Developer/Software Engineer
6 105 (10.76%) AWS Engineer
7 94 (9.63%) AWS Software Engineer
8 91 (9.32%) Architect
8 91 (9.32%) Lead
9 79 (8.09%) Python Engineer
10 62 (6.35%) AWS Developer
11 61 (6.25%) Solutions Architect
12 59 (6.05%) Java Engineer
12 59 (6.05%) Python Software Engineer
13 50 (5.12%) Python Developer
14 49 (5.02%) Java Software Engineer
15 39 (4.00%) React Developer
16 37 (3.79%) Cloud Engineer
17 29 (2.97%) Data Engineer
18 26 (2.66%) DevOps Engineer
Libraries, Frameworks & Software Standards
1 340 (34.84%) React
2 273 (27.97%) Node.js
3 244 (25.00%) Spring
4 241 (24.69%) Spring Boot
5 232 (23.77%) Redux
6 211 (21.62%) Kafka
7 198 (20.29%) CSS
8 188 (19.26%) HTML
9 173 (17.73%) Hibernate
10 160 (16.39%) JPA
11 135 (13.83%) .NET
12 114 (11.68%) Pandas
13 104 (10.66%) NumPy
14 98 (10.04%) SciPy
15 97 (9.94%) AngularJS
16 85 (8.71%) Vue
17 56 (5.74%) gRPC
18 55 (5.64%) Protocol Buffers
19 51 (5.23%) RESTful
20 41 (4.20%) PySpark
Miscellaneous
1 205 (21.00%) Product Ownership
2 167 (17.11%) Enterprise Software
3 140 (14.34%) Fixed Income
4 122 (12.50%) Self-Motivation
5 121 (12.40%) Linux Command Line
6 115 (11.78%) Cyberattack
7 78 (7.99%) Equities
7 78 (7.99%) Foreign Exchange (FX)
8 62 (6.35%) Cloud Native
9 58 (5.94%) Public Cloud
10 56 (5.74%) Management Information System
11 47 (4.82%) Hedge funds
12 42 (4.30%) Distributed Systems
13 34 (3.48%) Derivative
14 21 (2.15%) Algorithms
14 21 (2.15%) Legacy Systems
15 13 (1.33%) Clustering
16 12 (1.23%) Data Structures
16 12 (1.23%) Mobile Games
17 11 (1.13%) Hybrid Cloud
Operating Systems
1 203 (20.80%) Linux
2 45 (4.61%) Windows
3 32 (3.28%) Unix
4 8 (0.82%) Windows Server
5 4 (0.41%) CentOS
5 4 (0.41%) VMS
5 4 (0.41%) Windows Server 2008
5 4 (0.41%) Windows Server 2012
5 4 (0.41%) Windows Server 2016
5 4 (0.41%) Windows Server 2019
6 3 (0.31%) Android
6 3 (0.31%) Apple iOS
7 2 (0.20%) Rocky
7 2 (0.20%) Solaris
7 2 (0.20%) Ubuntu
8 1 (0.10%) zOS
Processes & Methodologies
1 637 (65.27%) Agile
2 636 (65.16%) Software Engineering
3 434 (44.47%) Microservices
4 398 (40.78%) DevOps
5 396 (40.57%) CI/CD
6 291 (29.82%) Containerisation
7 258 (26.43%) Test Automation
8 251 (25.72%) TDD
9 220 (22.54%) Full-Stack Development
10 218 (22.34%) Mentoring
11 211 (21.62%) SDLC
12 198 (20.29%) Continuous Improvement
13 190 (19.47%) Clean Code
14 181 (18.55%) Performance Optimisation
15 174 (17.83%) Front End Development
16 166 (17.01%) Data Engineering
17 162 (16.60%) Machine Learning
18 156 (15.98%) Cloud Security
18 156 (15.98%) User Experience
19 152 (15.57%) Scrum
Programming Languages
1 526 (53.89%) JavaScript
2 496 (50.82%) Java
3 476 (48.77%) Python
4 329 (33.71%) SQL
5 187 (19.16%) TypeScript
6 161 (16.50%) Go
7 117 (11.99%) C++
7 117 (11.99%) Rust
8 42 (4.30%) Bash
9 33 (3.38%) C#
10 25 (2.56%) PowerShell
11 14 (1.43%) PL/SQL
12 11 (1.13%) R
13 10 (1.02%) PHP
14 7 (0.72%) Scala
15 6 (0.61%) JCL
16 5 (0.51%) Shell Script
17 4 (0.41%) Groovy
18 3 (0.31%) Data Analysis Expressions
18 3 (0.31%) Ruby
Qualifications
1 149 (15.27%) Security Cleared
2 146 (14.96%) AWS Certification
3 130 (13.32%) AWS Certified Solutions Architect
4 117 (11.99%) DV Cleared
5 116 (11.89%) AWS Certified Developer
6 84 (8.61%) Degree
7 46 (4.71%) Computer Science Degree
8 28 (2.87%) SC Cleared
9 23 (2.36%) Azure Certification
9 23 (2.36%) Master's Degree
10 10 (1.02%) Microsoft Certification
11 8 (0.82%) BPSS Clearance
11 8 (0.82%) Cisco Certification
12 7 (0.72%) PhD
12 7 (0.72%) PMI Certification
13 6 (0.61%) PMP
13 6 (0.61%) VMware Certified Professional (VCP)
14 5 (0.51%) ISTQB
15 4 (0.41%) CISSP
15 4 (0.41%) SAP Certification
Quality Assurance & Compliance
1 176 (18.03%) QA
2 27 (2.77%) GDPR
3 21 (2.15%) Data Quality
4 14 (1.43%) NIST
5 11 (1.13%) HIPAA
6 10 (1.02%) PCI DSS
7 8 (0.82%) Basel III
7 8 (0.82%) IFRS
7 8 (0.82%) IFRS 9
7 8 (0.82%) ISO/IEC 27001
8 7 (0.72%) Basel II
8 7 (0.72%) Dodd-Frank
9 5 (0.51%) Accessibility
10 3 (0.31%) Sarbanes-Oxley
11 1 (0.10%) California Consumer Privacy Act
11 1 (0.10%) COBIT
11 1 (0.10%) Cyber Essentials
11 1 (0.10%) ISO/IEC 27005
11 1 (0.10%) NCSC
11 1 (0.10%) NIST 800
System Software
1 373 (38.22%) Docker
2 13 (1.33%) VMware Infrastructure
3 10 (1.02%) Virtual Machines
4 9 (0.92%) Active Directory
5 7 (0.72%) Hyper-V
6 5 (0.51%) VMware NSX
7 4 (0.41%) HDFS
7 4 (0.41%) VMware ESXi
8 2 (0.20%) KVM
8 2 (0.20%) NFS
8 2 (0.20%) SRDF
8 2 (0.20%) Veritas Cluster Server
8 2 (0.20%) Xen
Systems Management
1 402 (41.19%) Kubernetes
2 154 (15.78%) Terraform
3 53 (5.43%) Ansible
4 27 (2.77%) Istio
5 25 (2.56%) Prometheus
6 24 (2.46%) Grafana
7 12 (1.23%) Single Sign-On
8 11 (1.13%) AWS Copilot
9 10 (1.02%) Progress Chef
10 9 (0.92%) Argo
11 5 (0.51%) CA Endevor
11 5 (0.51%) Nagios
11 5 (0.51%) Puppet
12 4 (0.41%) Failover Clustering
13 3 (0.31%) CASB
13 3 (0.31%) linkerd
14 2 (0.20%) Red Hat Satellite
15 1 (0.10%) Consul
15 1 (0.10%) FortiGate
15 1 (0.10%) Microsoft Intune
Vendors
1 213 (21.82%) Google
2 157 (16.09%) Solace
3 72 (7.38%) Microsoft
4 33 (3.38%) Oracle
5 28 (2.87%) Databricks
6 22 (2.25%) VMware
7 16 (1.64%) SAP
8 11 (1.13%) IBM
8 11 (1.13%) Teradata
9 10 (1.02%) Splunk
10 7 (0.72%) Confluent
10 7 (0.72%) F5
10 7 (0.72%) New Relic
11 6 (0.61%) EMC
12 5 (0.51%) Adobe
12 5 (0.51%) Cisco
12 5 (0.51%) Dynatrace
12 5 (0.51%) Informatica
12 5 (0.51%) Salesforce
13 4 (0.41%) Palo Alto