Azure Engineer Jobs

Microsoft Azure Engineer
UK

The median Microsoft Azure Engineer salary in the UK is £70,000 per year, according to job vacancies posted during the 6 months leading to 29 May 2025.

The table below provides salary benchmarking and summary statistics, comparing them to the same period in the previous two years.

6 months to
29 May 2025
Same period 2024 Same period 2023
Rank 400 348 323
Rank change year-on-year -52 -25 +87
Permanent jobs requiring an Azure Engineer 344 829 1,035
As % of all permanent jobs advertised in the UK 0.63% 0.81% 1.06%
As % of the Job Titles category 0.69% 0.85% 1.16%
Number of salaries quoted 266 601 880
10th Percentile £44,500 £42,250 £45,000
25th Percentile £56,250 £52,000 £53,750
Median annual salary (50th Percentile) £70,000 £65,000 £70,000
Median % change year-on-year +7.69% -7.14% +7.69%
75th Percentile £87,500 £77,500 £86,250
90th Percentile £100,000 £95,000 £97,500
UK excluding London median annual salary £62,500 £59,500 £65,000
% change year-on-year +5.04% -8.46% +8.33%

All Permanent IT Job Vacancies
UK

For comparison with the information above, the following table provides summary statistics for all permanent IT job vacancies. Most job vacancies include a discernible job title that can be normalized. As such, the figures in the second row provide an indication of the number of permanent jobs in our overall sample.

Permanent vacancies in the UK with a recognized job title 49,581 97,268 88,998
% of permanent jobs with a recognized job title 90.39% 94.79% 91.42%
Number of salaries quoted 25,819 69,389 56,377
10th Percentile £28,750 £28,500 £32,500
25th Percentile £40,875 £38,500 £45,000
Median annual salary (50th Percentile) £55,000 £52,500 £60,000
Median % change year-on-year +4.76% -12.50% -
75th Percentile £73,750 £70,000 £80,000
90th Percentile £95,000 £90,000 £100,000
UK excluding London median annual salary £51,000 £50,000 £53,500
% change year-on-year +2.00% -6.54% +6.63%

Azure Engineer
Job Vacancy Trend

Job postings that featured Azure Engineer in the job title as a proportion of all IT jobs advertised.
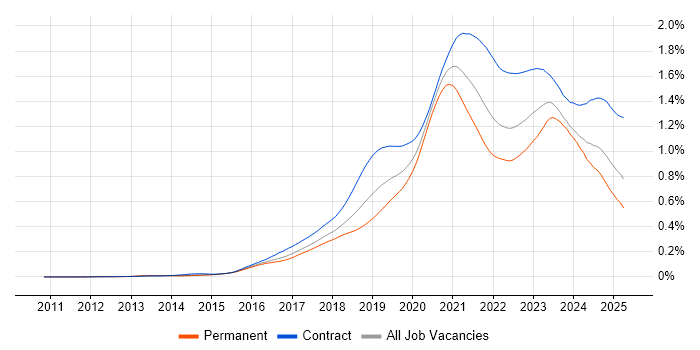
Job vacancy trend for Azure Engineer in the UK

Azure Engineer
Salary Trend

3-month moving average salary quoted in jobs citing Azure Engineer.

Salary trend for Azure Engineer in the UK

Azure Engineer
Salary Histogram

Salary distribution for jobs citing Azure Engineer over the 6 months to 29 May 2025.

Salary histogram for Azure Engineer in the UK

Azure Engineer
Top 18 Job Locations

The table below looks at the demand and provides a guide to the median salaries quoted in IT jobs citing Azure Engineer within the UK over the 6 months to 29 May 2025. The 'Rank Change' column provides an indication of the change in demand within each location based on the same 6 month period last year.

Location Rank Change
on Same Period
Last Year
Matching
Permanent
IT Job Ads
Median Salary
Past 6 Months
Median Salary
% Change
on Same Period
Last Year
Live
Jobs
England -35 335 £70,000 +7.69% 158
London +30 181 £82,500 +15.38% 73
UK excluding London -72 147 £62,500 +5.04% 92
Work from Home -42 103 £65,000 - 104
South East +53 47 £70,000 +16.67% 12
North of England -69 38 £62,500 +4.60% 42
North West -80 29 £60,500 +12.56% 31
East of England +47 26 £64,000 +4.49% 7
Midlands -56 22 £46,000 -16.36% 16
West Midlands +18 14 £60,000 +4.35% 3
Yorkshire +38 12 £55,000 -21.43% 7
South West +98 9 £60,000 - 11
East Midlands -46 8 £40,000 -27.27% 13
Scotland +92 2 £55,000 -15.38% 6
Northern Ireland +43 1 £47,500 - 1
Wales +35 1 £60,000 +18.38%
North East +35 1 £75,500 +0.67% 4
Isle of Man - 1 - -

Azure Engineer Skill Set
Top 30 Co-occurring Skills and Capabilities

For the 6 months to 29 May 2025, Azure Engineer job roles required the following skills and capabilities in order of popularity. The figures indicate the absolute number co-occurrences and as a proportion of all permanent job ads featuring Azure Engineer in the job title.

1 344 (100.00%) Azure
2 175 (50.87%) DevOps
3 140 (40.70%) Microsoft
3 140 (40.70%) CI/CD
4 135 (39.24%) Terraform
5 118 (34.30%) Azure DevOps
6 106 (30.81%) Python
7 98 (28.49%) Windows
8 96 (27.91%) PowerShell
8 96 (27.91%) Kubernetes
9 94 (27.33%) Infrastructure Engineering
9 94 (27.33%) Infrastructure as Code
10 88 (25.58%) Social Skills
10 88 (25.58%) SQL
11 84 (24.42%) Finance
12 81 (23.55%) Agile
13 68 (19.77%) Problem-Solving
14 65 (18.90%) Windows Server
15 59 (17.15%) Azure Certification
16 56 (16.28%) Databricks
17 53 (15.41%) Hybrid Cloud
17 53 (15.41%) Linux
18 52 (15.12%) Firewall
19 50 (14.53%) PaaS
20 49 (14.24%) SQL Server
20 49 (14.24%) Active Directory
21 48 (13.95%) Docker
21 48 (13.95%) Mentoring
22 47 (13.66%) Ansible
22 47 (13.66%) Containerisation

Azure Engineer Skill Set
Co-occurring Skills and Capabilities by Category

The follow tables expand on the table above by listing co-occurrences grouped by category. The same employment type, locality and period is covered with up to 20 co-occurrences shown in each of the following categories:

Application Platforms
1 26 (7.56%) Microsoft Exchange
2 14 (4.07%) SharePoint
3 6 (1.74%) Apache Spark
4 4 (1.16%) Apache
4 4 (1.16%) Apache Airflow
4 4 (1.16%) IIS
5 2 (0.58%) Confluence
5 2 (0.58%) WordPress
6 1 (0.29%) BizTalk Server
6 1 (0.29%) JBoss
6 1 (0.29%) Tomcat
6 1 (0.29%) WebSphere
Applications
1 6 (1.74%) Microsoft Office
Business Applications
1 1 (0.29%) Dynamics CRM
Cloud Services
1 344 (100.00%) Azure
2 118 (34.30%) Azure DevOps
3 50 (14.53%) PaaS
4 44 (12.79%) Azure Data Factory
5 42 (12.21%) Microsoft 365
6 38 (11.05%) AWS
6 38 (11.05%) IaaS
7 37 (10.76%) Entra ID
8 35 (10.17%) GitHub
9 32 (9.30%) SaaS
10 31 (9.01%) Power Platform
11 26 (7.56%) Azure AKS
12 23 (6.69%) Azure Synapse Analytics
13 19 (5.52%) GitHub Actions
14 18 (5.23%) Serverless
15 17 (4.94%) Azure Logic Apps
15 17 (4.94%) Azure Monitor
15 17 (4.94%) GCP
16 14 (4.07%) Azure Functions
16 14 (4.07%) Microsoft Purview
Communications & Networking
1 52 (15.12%) Firewall
2 23 (6.69%) VPN
3 20 (5.81%) DNS
4 19 (5.52%) WAN
5 17 (4.94%) SD-WAN
6 11 (3.20%) DHCP
6 11 (3.20%) LAN
7 7 (2.03%) Network Security
8 5 (1.45%) BGP
8 5 (1.45%) OSPF
8 5 (1.45%) VLAN
9 4 (1.16%) Cisco IOS
9 4 (1.16%) HTTPS
9 4 (1.16%) SAN
9 4 (1.16%) Wireless
10 3 (0.87%) BIG-IP
10 3 (0.87%) Internet
10 3 (0.87%) TACACS
10 3 (0.87%) Wi-Fi
10 3 (0.87%) WLAN
Database & Business Intelligence
1 49 (14.24%) SQL Server
2 30 (8.72%) Data Warehouse
3 29 (8.43%) Data Lake
4 17 (4.94%) Power BI
5 15 (4.36%) PostgreSQL
6 13 (3.78%) MongoDB
6 13 (3.78%) NoSQL
7 11 (3.20%) Azure SQL Data Warehouse
7 11 (3.20%) DB2
8 9 (2.62%) Azure SQL Database
9 5 (1.45%) Big Data
9 5 (1.45%) MySQL
9 5 (1.45%) Relational Database
10 4 (1.16%) HDInsight
11 3 (0.87%) Metadata
12 2 (0.58%) BigQuery
12 2 (0.58%) Delta Lake
13 1 (0.29%) Apache Cassandra
13 1 (0.29%) Elasticsearch
13 1 (0.29%) Tableau
Development Applications
1 27 (7.85%) Git
2 26 (7.56%) Jenkins
3 8 (2.33%) JIRA
4 6 (1.74%) GitLab
4 6 (1.74%) Octopus Deploy
5 5 (1.45%) Selenium
6 4 (1.16%) Sonatype Nexus
6 4 (1.16%) Team Foundation Server
7 3 (0.87%) TeamCity
8 2 (0.58%) Artifactory
8 2 (0.58%) CircleCI
8 2 (0.58%) Postman
8 2 (0.58%) SonarQube
9 1 (0.29%) Atlassian Bamboo
9 1 (0.29%) IBM UrbanCode
9 1 (0.29%) kappa
9 1 (0.29%) Locust
9 1 (0.29%) Robot Framework
9 1 (0.29%) Travis CI
9 1 (0.29%) Visual Studio Code
General
1 88 (25.58%) Social Skills
2 84 (24.42%) Finance
3 45 (13.08%) Inclusion and Diversity
4 22 (6.40%) Public Sector
5 12 (3.49%) Banking
6 9 (2.62%) Law
7 7 (2.03%) Analytical Skills
8 6 (1.74%) Investment Banking
9 4 (1.16%) Advertising
9 4 (1.16%) Legal
10 3 (0.87%) Front Office
10 3 (0.87%) Health Technology
10 3 (0.87%) Manufacturing
11 2 (0.58%) Marketing
11 2 (0.58%) Organisational Skills
11 2 (0.58%) Retail
12 1 (0.29%) Electronics
12 1 (0.29%) Games
12 1 (0.29%) Military
12 1 (0.29%) Retail Banking
Libraries, Frameworks & Software Standards
1 25 (7.27%) ARM Templates
2 22 (6.40%) .NET
3 20 (5.81%) PySpark
3 20 (5.81%) React
4 14 (4.07%) YAML
5 13 (3.78%) AngularJS
6 12 (3.49%) Bootstrap
7 11 (3.20%) Backbone.js
7 11 (3.20%) Ember.js
7 11 (3.20%) jQuery
8 7 (2.03%) Kafka
8 7 (2.03%) SAML
9 6 (1.74%) 802.1X
10 5 (1.45%) REST
10 5 (1.45%) SailPoint
11 4 (1.16%) Node.js
12 3 (0.87%) .NET Core
12 3 (0.87%) .NET Framework
12 3 (0.87%) Middleware
12 3 (0.87%) pytest
Miscellaneous
1 53 (15.41%) Hybrid Cloud
2 32 (9.30%) e-Learning
3 13 (3.78%) Clustering
4 11 (3.20%) Algorithms
4 11 (3.20%) Data Structures
4 11 (3.20%) Enterprise Cloud
5 10 (2.91%) Product Ownership
6 9 (2.62%) Cloud Native
6 9 (2.62%) Hedge funds
7 8 (2.33%) Management Information System
8 7 (2.03%) Distributed Systems
9 6 (1.74%) Virtual Team
10 5 (1.45%) Data Centre
10 5 (1.45%) Driving Licence
10 5 (1.45%) Security Posture
11 4 (1.16%) Linux Command Line
11 4 (1.16%) Onboarding
11 4 (1.16%) Public Cloud
12 3 (0.87%) Cyber Threat
12 3 (0.87%) iPad
Operating Systems
1 98 (28.49%) Windows
2 65 (18.90%) Windows Server
3 53 (15.41%) Linux
4 16 (4.65%) Android
4 16 (4.65%) Apple iOS
5 13 (3.78%) Red Hat Enterprise Linux
6 9 (2.62%) Windows Server 2016
7 6 (1.74%) VMS
8 5 (1.45%) Unix
8 5 (1.45%) Windows Server 2019
9 3 (0.87%) Mac OS
10 1 (0.29%) Ubuntu
10 1 (0.29%) Windows 10
10 1 (0.29%) Windows 8
Processes & Methodologies
1 175 (50.87%) DevOps
2 140 (40.70%) CI/CD
3 94 (27.33%) Infrastructure as Code
3 94 (27.33%) Infrastructure Engineering
4 81 (23.55%) Agile
5 68 (19.77%) Problem-Solving
6 48 (13.95%) Mentoring
7 47 (13.66%) Containerisation
8 46 (13.37%) Artificial Intelligence
9 43 (12.50%) Cloud Security
10 41 (11.92%) Data Engineering
11 39 (11.34%) Platform Engineering
12 38 (11.05%) Analytics
13 35 (10.17%) Coaching
13 35 (10.17%) Test Automation
14 30 (8.72%) Data Pipeline
14 30 (8.72%) Infrastructure Automation
15 29 (8.43%) High Availability
16 23 (6.69%) Continuous Improvement
16 23 (6.69%) Migration
Programming Languages
1 106 (30.81%) Python
2 96 (27.91%) PowerShell
3 88 (25.58%) SQL
4 27 (7.85%) Bash
5 26 (7.56%) C#
6 21 (6.10%) Bicep
7 16 (4.65%) Java
7 16 (4.65%) Scala
8 12 (3.49%) TypeScript
9 9 (2.62%) R
10 4 (1.16%) Kusto Query Language
11 3 (0.87%) JavaScript
11 3 (0.87%) T-SQL
12 2 (0.58%) Data Analysis Expressions
12 2 (0.58%) Go
12 2 (0.58%) Perl
12 2 (0.58%) Ruby
13 1 (0.29%) Groovy
13 1 (0.29%) PHP
Qualifications
1 59 (17.15%) Azure Certification
2 28 (8.14%) Security Cleared
3 25 (7.27%) Degree
3 25 (7.27%) SC Cleared
4 19 (5.52%) Microsoft Certification
5 10 (2.91%) Cisco Certification
6 8 (2.33%) AWS Certification
7 7 (2.03%) CISSP
8 6 (1.74%) Computer Science Degree
9 5 (1.45%) CCNP
10 4 (1.16%) (ISC)2 CCSP
10 4 (1.16%) CompTIA Security+
11 3 (0.87%) CCIE
11 3 (0.87%) CCNA
11 3 (0.87%) CCSP
12 2 (0.58%) CEH
13 1 (0.29%) ITIL Certification
13 1 (0.29%) Network+ Certification
13 1 (0.29%) SANS
13 1 (0.29%) VMware Certified Professional (VCP)
Quality Assurance & Compliance
1 23 (6.69%) GDPR
2 11 (3.20%) Data Quality
3 8 (2.33%) HIPAA
3 8 (2.33%) ISO/IEC 27001
4 6 (1.74%) NIST
5 5 (1.45%) PCI DSS
5 5 (1.45%) Sarbanes-Oxley
5 5 (1.45%) SOC 2
6 3 (0.87%) QA
7 2 (0.58%) PMO
7 2 (0.58%) SLA
8 1 (0.29%) Cyber Essentials
8 1 (0.29%) Cyber Essentials PLUS
System Software
1 49 (14.24%) Active Directory
2 48 (13.95%) Docker
3 33 (9.59%) VMware Infrastructure
4 15 (4.36%) Virtual Desktop
4 15 (4.36%) Virtual Machines
5 13 (3.78%) VMware ESXi
6 10 (2.91%) Hyper-V
7 5 (1.45%) vSphere
8 1 (0.29%) KVM
8 1 (0.29%) Xen
Systems Management
1 135 (39.24%) Terraform
2 96 (27.91%) Kubernetes
3 47 (13.66%) Ansible
4 36 (10.47%) Microsoft Intune
5 21 (6.10%) SCCM
6 9 (2.62%) Progress Chef
7 8 (2.33%) Active Directory Federation Services
7 8 (2.33%) Puppet
8 5 (1.45%) Failover Clustering
9 4 (1.16%) Backup Exec
9 4 (1.16%) Grafana
9 4 (1.16%) Prometheus
10 2 (0.58%) CASB
10 2 (0.58%) Consul
10 2 (0.58%) Istio
10 2 (0.58%) linkerd
11 1 (0.29%) Podman
11 1 (0.29%) Rancher
11 1 (0.29%) Single Sign-On
11 1 (0.29%) vCenter Server
Vendors
1 140 (40.70%) Microsoft
2 56 (16.28%) Databricks
3 43 (12.50%) VMware
4 40 (11.63%) Red Hat
5 38 (11.05%) IBM
6 23 (6.69%) Palo Alto
7 18 (5.23%) Cisco
8 16 (4.65%) Citrix
9 12 (3.49%) Google
10 9 (2.62%) Meraki
11 6 (1.74%) Veeam
12 5 (1.45%) CyberArk
12 5 (1.45%) F5
12 5 (1.45%) Fortinet
12 5 (1.45%) NetApp
13 4 (1.16%) HP
14 3 (0.87%) Apple
14 3 (0.87%) LogicMonitor
14 3 (0.87%) SAP
14 3 (0.87%) Zscaler