Object-Oriented Programming (OOP)
UK

The table below provides summary statistics for permanent job vacancies requiring OOP skills. It includes a benchmarking guide to the annual salaries offered in vacancies that cited OOP over the 6 months leading up to 30 May 2025, comparing them to the same period in the previous two years.

6 months to
30 May 2025
Same period 2024 Same period 2023
Rank 205 272 191
Rank change year-on-year +67 -81 -38
Permanent jobs citing OOP 887 1,080 1,912
As % of all permanent jobs advertised in the UK 1.60% 1.05% 1.97%
As % of the Processes & Methodologies category 1.71% 1.24% 2.06%
Number of salaries quoted 359 665 1,102
10th Percentile £31,250 £32,500 £41,250
25th Percentile £41,000 £42,000 £50,000
Median annual salary (50th Percentile) £55,000 £52,500 £60,000
Median % change year-on-year +4.76% -12.50% +9.09%
75th Percentile £70,000 £72,500 £85,000
90th Percentile £80,250 £92,000 £105,000
UK excluding London median annual salary £55,000 £50,000 £57,500
% change year-on-year +10.00% -13.04% +15.00%

All Process and Methodology Skills
UK

OOP falls under the Processes and Methodologies category. For comparison with the information above, the following table provides summary statistics for all permanent job vacancies requiring process or methodology skills.

Permanent vacancies with a requirement for process or methodology skills 51,902 86,889 92,846
As % of all permanent jobs advertised in the UK 93.67% 84.13% 95.56%
Number of salaries quoted 25,611 60,763 54,796
10th Percentile £28,822 £29,250 £34,000
25th Percentile £41,250 £40,000 £45,000
Median annual salary (50th Percentile) £57,443 £55,000 £60,899
Median % change year-on-year +4.44% -9.69% +1.50%
75th Percentile £75,000 £72,500 £81,250
90th Percentile £97,500 £92,500 £100,000
UK excluding London median annual salary £51,574 £50,000 £55,000
% change year-on-year +3.15% -9.09% +4.76%

OOP
Job Vacancy Trend

Job postings citing OOP as a proportion of all IT jobs advertised.
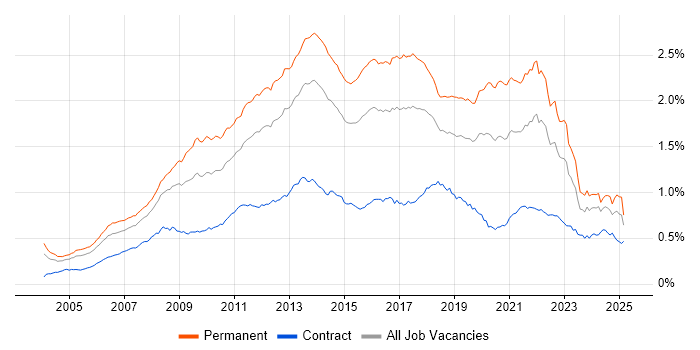
Job vacancy trend for OOP in the UK

OOP
Salary Trend

3-month moving average salary quoted in jobs citing OOP.

Salary trend for OOP in the UK

OOP
Salary Histogram

Salary distribution for jobs citing OOP over the 6 months to 30 May 2025.

Salary histogram for OOP in the UK

OOP
Top 17 Job Locations

The table below looks at the demand and provides a guide to the median salaries quoted in IT jobs citing OOP within the UK over the 6 months to 30 May 2025. The 'Rank Change' column provides an indication of the change in demand within each location based on the same 6 month period last year.

Location Rank Change
on Same Period
Last Year
Matching
Permanent
IT Job Ads
Median Salary
Past 6 Months
Median Salary
% Change
on Same Period
Last Year
Live
Jobs
England +51 835 £57,500 +4.55% 1,174
UK excluding London +71 723 £55,000 +10.00% 1,126
North of England +139 502 £47,500 -9.52% 278
North West +90 459 £41,000 -21.90% 145
Work from Home -17 247 £52,500 - 775
London +23 131 £64,500 -16.77% 194
South East -17 94 £62,500 +8.70% 343
East of England +18 34 £34,750 -44.40% 152
Yorkshire +55 29 £70,000 +55.56% 97
Midlands -37 28 £40,000 -20.00% 185
South West +34 27 £60,000 +33.33% 134
Scotland +96 24 £60,000 +34.08% 38
West Midlands +27 17 £55,000 +10.00% 102
North East +50 14 £55,000 -23.08% 39
East Midlands -49 11 £40,000 -21.95% 71
Northern Ireland +36 9 £55,000 +57.14% 16
Wales +41 5 £42,500 -29.17% 30

OOP
Co-occurring Skills and Capabilities by Category

The follow tables expand on the table above by listing co-occurrences grouped by category. The same employment type, locality and period is covered with up to 20 co-occurrences shown in each of the following categories:

Application Platforms
1 14 (1.58%) Apache
2 11 (1.24%) WordPress
3 10 (1.13%) CMS
3 10 (1.13%) Drupal
3 10 (1.13%) nginx
4 9 (1.01%) Tomcat
5 5 (0.56%) Apache Spark
5 5 (0.56%) Cloud Foundry
5 5 (0.56%) Confluence
6 4 (0.45%) GemFire
7 3 (0.34%) IIS
8 2 (0.23%) SharePoint
9 1 (0.11%) Camunda
Applications
1 10 (1.13%) Microsoft Office
2 4 (0.45%) Microsoft Excel
3 2 (0.23%) MS Visio
3 2 (0.23%) Simulink
Business Applications
1 12 (1.35%) Oracle EBS
2 11 (1.24%) JDE OneWorld
2 11 (1.24%) NetSuite
3 1 (0.11%) Dynamics CRM
3 1 (0.11%) iTrent
3 1 (0.11%) Magento
3 1 (0.11%) SAP S/4HANA
Cloud Services
1 160 (18.04%) Azure
2 159 (17.93%) AWS
3 51 (5.75%) AWS CloudFormation
4 49 (5.52%) Amazon EKS
5 47 (5.30%) GCP
6 37 (4.17%) Azure DevOps
7 20 (2.25%) GitHub
8 15 (1.69%) SaaS
9 11 (1.24%) Boomi
9 11 (1.24%) Serverless
10 10 (1.13%) Amazon SQS
11 9 (1.01%) AWS Lambda
12 8 (0.90%) Amazon ElastiCache
12 8 (0.90%) Amazon OpenSearch
13 6 (0.68%) Azure Monitor
14 5 (0.56%) Azure Logic Apps
14 5 (0.56%) Cloud Computing
15 4 (0.45%) Amazon Cognito
15 4 (0.45%) Azure Pipelines
15 4 (0.45%) CloudFront
Communications & Networking
1 397 (44.76%) DNS
1 397 (44.76%) VPN
2 23 (2.59%) Wireshark
3 12 (1.35%) HTTP
4 10 (1.13%) Multicast
5 2 (0.23%) Ethernet
5 2 (0.23%) Modbus
5 2 (0.23%) Profibus
5 2 (0.23%) RTP
5 2 (0.23%) Wi-Fi
6 1 (0.11%) Network Security
Database & Business Intelligence
1 115 (12.97%) MySQL
2 108 (12.18%) SQL Server
3 60 (6.76%) Elasticsearch
4 35 (3.95%) NoSQL
5 31 (3.49%) PostgreSQL
5 31 (3.49%) Relational Database
6 30 (3.38%) MongoDB
7 14 (1.58%) Big Data
8 11 (1.24%) Data Warehouse
9 10 (1.13%) Amazon RDS
9 10 (1.13%) RDBMS
10 8 (0.90%) Amazon Aurora
10 8 (0.90%) Data Lake
11 6 (0.68%) Redis
12 4 (0.45%) Apache Hive
12 4 (0.45%) Apache Ignite
12 4 (0.45%) DynamoDB
12 4 (0.45%) Hadoop
12 4 (0.45%) InterSystems Cache
13 2 (0.23%) Apache Iceberg
Development Applications
1 133 (14.99%) Git
2 26 (2.93%) JIRA
2 26 (2.93%) JUnit
3 24 (2.71%) Jenkins
4 17 (1.92%) Postman
4 17 (1.92%) Selenium
4 17 (1.92%) Visual Studio
5 16 (1.80%) NUnit
6 13 (1.47%) Maven
7 12 (1.35%) TestNG
8 10 (1.13%) SonarQube
9 9 (1.01%) Bitbucket
9 9 (1.01%) GitLab
9 9 (1.01%) Mockito
10 8 (0.90%) Cucumber
10 8 (0.90%) PHPUnit
10 8 (0.90%) TeamCity
11 6 (0.68%) Cypress.io
11 6 (0.68%) SpecFlow
12 5 (0.56%) Fiddler
General
1 559 (63.02%) Finance
2 480 (54.11%) Analytical Skills
3 479 (54.00%) Inclusion and Diversity
4 95 (10.71%) Social Skills
5 47 (5.30%) Games
6 33 (3.72%) Retail
7 31 (3.49%) Law
8 29 (3.27%) Banking
9 23 (2.59%) Front Office
10 17 (1.92%) Public Sector
11 14 (1.58%) Marketing
12 13 (1.47%) Manufacturing
13 6 (0.68%) Back Office
14 5 (0.56%) iGaming
15 3 (0.34%) Electronics
15 3 (0.34%) Investment Banking
15 3 (0.34%) Presentation Skills
16 2 (0.23%) Advertising
16 2 (0.23%) Financial Institution
16 2 (0.23%) Telecoms
Job Titles
1 720 (81.17%) Developer
2 486 (54.79%) Software Developer
3 114 (12.85%) Senior
4 70 (7.89%) Senior Developer
5 59 (6.65%) PHP Developer
6 54 (6.09%) Software Engineer
7 45 (5.07%) .NET Developer
8 41 (4.62%) Lead
9 32 (3.61%) Graduate
9 32 (3.61%) Graduate Developer
10 28 (3.16%) C# Developer
11 26 (2.93%) IT Graduate
12 25 (2.82%) Principal Engineer
12 25 (2.82%) Systems Engineer
13 23 (2.59%) Principal Systems Engineer
14 22 (2.48%) Python Engineer
14 22 (2.48%) Senior PHP Developer
14 22 (2.48%) Senior Software Engineer
15 20 (2.25%) Python Developer
16 19 (2.14%) Lead Developer
Libraries, Frameworks & Software Standards
1 193 (21.76%) CSS
2 172 (19.39%) .NET
3 163 (18.38%) HTML
4 86 (9.70%) React
5 70 (7.89%) Node.js
6 67 (7.55%) REST
7 60 (6.76%) jQuery
7 60 (6.76%) LAMP
8 55 (6.20%) Laravel
9 52 (5.86%) ASP.NET
10 51 (5.75%) Pandas
11 50 (5.64%) RESTful
12 44 (4.96%) Web Services
13 39 (4.40%) .NET Core
14 35 (3.95%) AngularJS
15 34 (3.83%) Kafka
16 32 (3.61%) Spring
17 31 (3.49%) .NET Framework
18 29 (3.27%) CSS3
19 27 (3.04%) JSON
Miscellaneous
1 446 (50.28%) Cyberattack
2 55 (6.20%) Mobile App
3 50 (5.64%) Management Information System
4 46 (5.19%) Algorithms
5 36 (4.06%) Data Structures
6 29 (3.27%) Equities
7 23 (2.59%) Product Ownership
8 21 (2.37%) Derivative
9 20 (2.25%) Hedge funds
10 18 (2.03%) Fixed Income
11 14 (1.58%) Cloud Native
12 13 (1.47%) Greenfield Project
12 13 (1.47%) Virtual Team
13 11 (1.24%) Distributed Systems
14 8 (0.90%) Life Science
14 8 (0.90%) Robotics
15 7 (0.79%) Legacy Systems
16 6 (0.68%) Credit Derivative
16 6 (0.68%) Foreign Exchange (FX)
16 6 (0.68%) Public Cloud
Operating Systems
1 517 (58.29%) Linux
2 452 (50.96%) Android
3 35 (3.95%) Windows
4 9 (1.01%) Apple iOS
5 5 (0.56%) Robot Operating System
6 4 (0.45%) Unix
7 1 (0.11%) Solaris
7 1 (0.11%) Windows Server
Processes & Methodologies
1 748 (84.33%) OO
2 638 (71.93%) Agile
3 542 (61.10%) Design Patterns
4 473 (53.33%) Mathematics
5 450 (50.73%) Android Development
6 447 (50.39%) Line Management
7 178 (20.07%) Software Engineering
8 151 (17.02%) Problem-Solving
9 146 (16.46%) CI/CD
10 103 (11.61%) MVC
11 96 (10.82%) Containerisation
12 82 (9.24%) Computer Science
13 77 (8.68%) Test Automation
14 70 (7.89%) DevOps
14 70 (7.89%) E-Commerce
15 69 (7.78%) Web Development
16 67 (7.55%) Collaborative Working
16 67 (7.55%) Kanban
17 59 (6.65%) Continuous Improvement
18 57 (6.43%) Secure Coding
Programming Languages
1 574 (64.71%) Java
2 537 (60.54%) Python
3 509 (57.38%) C++
4 453 (51.07%) Go
5 231 (26.04%) JavaScript
6 143 (16.12%) C#
7 117 (13.19%) PHP
8 106 (11.95%) SQL
9 49 (5.52%) Rust
10 40 (4.51%) TypeScript
11 11 (1.24%) Scala
12 5 (0.56%) Swift
13 3 (0.34%) Objective-C
13 3 (0.34%) Ruby
13 3 (0.34%) T-SQL
14 2 (0.23%) Apex Code
14 2 (0.23%) Groovy
14 2 (0.23%) Kotlin
14 2 (0.23%) MATLAB
14 2 (0.23%) PowerShell
Qualifications
1 462 (52.09%) Security Cleared
2 449 (50.62%) DV Cleared
3 154 (17.36%) Degree
4 51 (5.75%) Computer Science Degree
5 23 (2.59%) BPSS Clearance
5 23 (2.59%) Chartered Engineer
6 17 (1.92%) Master's Degree
7 14 (1.58%) SC Cleared
8 10 (1.13%) Numerate Degree
9 5 (0.56%) PhD
10 4 (0.45%) AWS Certification
10 4 (0.45%) ISTQB
11 2 (0.23%) AWS Certified Developer
11 2 (0.23%) AWS Certified Solutions Architect
11 2 (0.23%) DBS Check
12 1 (0.11%) MCSE
12 1 (0.11%) Microsoft Certification
12 1 (0.11%) TOGAF Certification
12 1 (0.11%) VCAP
12 1 (0.11%) VMware Certified Professional (VCP)
Quality Assurance & Compliance
1 26 (2.93%) QA
2 22 (2.48%) Accessibility
3 2 (0.23%) IEC 61131
3 2 (0.23%) ISO/IEC 27001
3 2 (0.23%) NCSC
4 1 (0.11%) WCAG
System Software
1 490 (55.24%) Docker
2 1 (0.11%) Active Directory
2 1 (0.11%) Virtual Desktop
2 1 (0.11%) VMware Infrastructure
2 1 (0.11%) vSphere
Systems Management
1 457 (51.52%) Ansible
2 86 (9.70%) Kubernetes
3 66 (7.44%) Terraform
4 8 (0.90%) Kustomize
4 8 (0.90%) Packer
5 3 (0.34%) Grafana
5 3 (0.34%) Prometheus
6 1 (0.11%) Puppet
6 1 (0.11%) vRealize
Vendors
1 48 (5.41%) Oracle
2 45 (5.07%) Microsoft
3 16 (1.80%) Twitter
4 13 (1.47%) Salesforce
5 11 (1.24%) Dell
6 9 (1.01%) Red Hat
7 8 (0.90%) Okta
8 7 (0.79%) Splunk
9 5 (0.56%) Solace
9 5 (0.56%) Sybase
10 4 (0.45%) Bloomberg
10 4 (0.45%) TIBCO
11 3 (0.34%) SAP
12 2 (0.23%) Adobe
12 2 (0.23%) Apple
12 2 (0.23%) Google
12 2 (0.23%) Xamarin
13 1 (0.11%) Alteryx
13 1 (0.11%) Facebook
13 1 (0.11%) New Relic