Clean Code Jobs

Clean Code
UK

The table below provides summary statistics for permanent job vacancies requiring Clean Code skills. It includes a benchmarking guide to the annual salaries offered in vacancies that cited Clean Code over the 6 months leading up to 29 May 2025, comparing them to the same period in the previous two years.

6 months to
29 May 2025
Same period 2024 Same period 2023
Rank 211 334 226
Rank change year-on-year +123 -108 -58
Permanent jobs citing Clean Code 836 859 1,557
As % of all permanent jobs advertised in the UK 1.52% 0.84% 1.60%
As % of the Processes & Methodologies category 1.63% 0.99% 1.67%
Number of salaries quoted 292 679 813
10th Percentile £32,750 £36,250 £45,850
25th Percentile £49,750 £42,500 £55,000
Median annual salary (50th Percentile) £60,000 £60,000 £70,000
Median % change year-on-year - -14.29% +12.00%
75th Percentile £72,500 £73,750 £92,500
90th Percentile £87,500 £93,350 £105,000
UK excluding London median annual salary £55,000 £50,000 £57,500
% change year-on-year +10.00% -13.04% +15.00%

All Process and Methodology Skills
UK

Clean Code falls under the Processes and Methodologies category. For comparison with the information above, the following table provides summary statistics for all permanent job vacancies requiring process or methodology skills.

Permanent vacancies with a requirement for process or methodology skills 51,417 86,448 93,028
As % of all permanent jobs advertised in the UK 93.74% 84.24% 95.56%
Number of salaries quoted 25,323 60,550 54,986
10th Percentile £29,000 £29,250 £34,000
25th Percentile £41,250 £40,000 £45,000
Median annual salary (50th Percentile) £57,500 £55,000 £61,000
Median % change year-on-year +4.55% -9.84% +1.67%
75th Percentile £75,000 £72,500 £81,250
90th Percentile £97,500 £92,500 £100,000
UK excluding London median annual salary £51,564 £50,000 £55,000
% change year-on-year +3.13% -9.09% +4.76%

Clean Code
Job Vacancy Trend

Job postings citing Clean Code as a proportion of all IT jobs advertised.
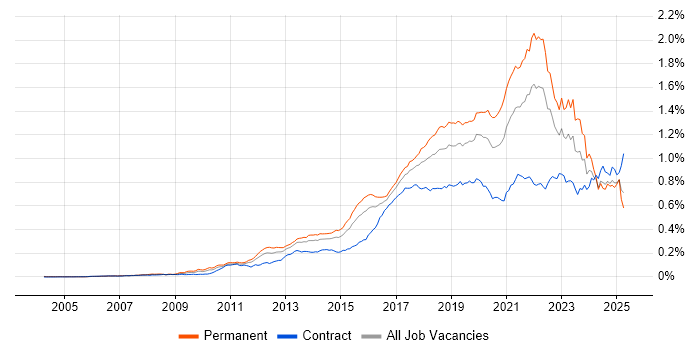
Job vacancy trend for Clean Code in the UK

Clean Code
Salary Trend

3-month moving average salary quoted in jobs citing Clean Code.

Salary trend for Clean Code in the UK

Clean Code
Salary Histogram

Salary distribution for jobs citing Clean Code over the 6 months to 29 May 2025.

Salary histogram for Clean Code in the UK

Clean Code
Top 17 Job Locations

The table below looks at the demand and provides a guide to the median salaries quoted in IT jobs citing Clean Code within the UK over the 6 months to 29 May 2025. The 'Rank Change' column provides an indication of the change in demand within each location based on the same 6 month period last year.

Location Rank Change
on Same Period
Last Year
Matching
Permanent
IT Job Ads
Median Salary
Past 6 Months
Median Salary
% Change
on Same Period
Last Year
Live
Jobs
England +106 749 £60,000 - 648
Work from Home +136 650 £57,500 -4.17% 504
UK excluding London +110 490 £55,000 +10.00% 429
London +56 219 £70,000 -12.50% 270
North of England +5 128 £55,000 +10.00% 124
North West -27 99 £50,000 - 86
South East +117 96 £57,500 - 84
Midlands +39 90 £55,000 +10.00% 79
Scotland +163 71 £55,000 -8.33% 25
East of England +72 66 £52,500 +16.67% 47
West Midlands +26 46 £60,000 +20.00% 52
East Midlands +40 44 £55,000 +10.00% 27
South West +83 36 £55,000 -4.35% 39
Yorkshire +44 18 £83,876 +86.39% 28
North East +49 11 £56,250 +2.27% 10
Wales +13 3 £67,626 +50.28% 15
Northern Ireland +39 1 £45,000 -18.18% 24

Clean Code
Co-occurring Skills and Capabilities by Category

The follow tables expand on the table above by listing co-occurrences grouped by category. The same employment type, locality and period is covered with up to 20 co-occurrences shown in each of the following categories:

Application Platforms
1 160 (19.14%) Confluence
2 21 (2.51%) CMS
3 18 (2.15%) Umbraco
4 10 (1.20%) IIS
5 9 (1.08%) Microsoft Exchange
6 4 (0.48%) Apache
7 3 (0.36%) WordPress
8 2 (0.24%) Apache Airflow
8 2 (0.24%) Cloud Foundry
8 2 (0.24%) OpenStack
9 1 (0.12%) ColdFusion
9 1 (0.12%) Drupal
9 1 (0.12%) JBoss
9 1 (0.12%) NServiceBus
Applications
1 7 (0.84%) Revit
2 2 (0.24%) Chatbot
2 2 (0.24%) Microsoft Excel
2 2 (0.24%) Trello
3 1 (0.12%) Adobe XD
3 1 (0.12%) AutoCAD
3 1 (0.12%) Elementor
3 1 (0.12%) Microsoft Office
3 1 (0.12%) Microsoft PowerPoint
3 1 (0.12%) Zeplin
Business Applications
1 8 (0.96%) Oracle EBS
2 3 (0.36%) SAP Business One
2 3 (0.36%) Shopify
3 2 (0.24%) Dynamics CRM
4 1 (0.12%) Salesforce CRM
4 1 (0.12%) SAP Hybris
Cloud Services
1 590 (70.57%) AWS
2 468 (55.98%) Azure
3 409 (48.92%) GCP
4 333 (39.83%) Serverless
5 330 (39.47%) AWS Lambda
6 77 (9.21%) Amazon S3
7 73 (8.73%) AWS Step Functions
8 45 (5.38%) GitHub
9 25 (2.99%) SaaS
10 22 (2.63%) Azure DevOps
11 13 (1.56%) Amazon ECS
11 13 (1.56%) Cloud Computing
11 13 (1.56%) dbt
12 12 (1.44%) Amazon ElastiCache
13 11 (1.32%) Amazon ECR
13 11 (1.32%) Amazon OpenSearch
13 11 (1.32%) AWS CloudFormation
13 11 (1.32%) AWS CodeBuild
13 11 (1.32%) Pulumi
14 10 (1.20%) GitHub Actions
Communications & Networking
1 288 (34.45%) Broadband
2 17 (2.03%) Intranet
3 15 (1.79%) TCP/IP
4 11 (1.32%) HTTP
5 5 (0.60%) Wireless
5 5 (0.60%) ZigBee
6 4 (0.48%) 3GPP
6 4 (0.48%) 5G
6 4 (0.48%) HTTPS
6 4 (0.48%) Internet
7 2 (0.24%) Wireshark
8 1 (0.12%) Ethernet
8 1 (0.12%) MQTT
8 1 (0.12%) Multicast
8 1 (0.12%) RTP
8 1 (0.12%) RTSP
8 1 (0.12%) Wi-Fi
Database & Business Intelligence
1 239 (28.59%) SQL Server
2 112 (13.40%) DynamoDB
3 86 (10.29%) Elasticsearch
4 48 (5.74%) PostgreSQL
5 38 (4.55%) MySQL
6 28 (3.35%) NoSQL
7 26 (3.11%) MongoDB
8 15 (1.79%) Amazon RDS
8 15 (1.79%) Relational Database
9 14 (1.67%) Redis
10 9 (1.08%) Data Hub
10 9 (1.08%) SQL CLR
11 8 (0.96%) OLTP
12 6 (0.72%) Data Warehouse
13 5 (0.60%) SQL Server Integration Services
13 5 (0.60%) SQL Server Reporting Services
14 4 (0.48%) Big Data
14 4 (0.48%) Biml
14 4 (0.48%) Power BI
14 4 (0.48%) SQL Server Analysis Services
Development Applications
1 179 (21.41%) JIRA
2 168 (20.10%) GitLab
3 165 (19.74%) Maven
4 162 (19.38%) Selenium
5 157 (18.78%) Bitbucket
5 157 (18.78%) Cucumber
5 157 (18.78%) SonarQube
5 157 (18.78%) Sonatype Nexus
6 86 (10.29%) Git
7 15 (1.79%) Visual Studio
8 12 (1.44%) webpack
9 10 (1.20%) JUnit
9 10 (1.20%) NUnit
10 9 (1.08%) Gradle
11 8 (0.96%) Cypress.io
11 8 (0.96%) Moq
11 8 (0.96%) Vite
12 7 (0.84%) SpecFlow
13 6 (0.72%) Babel
14 5 (0.60%) WiX
General
1 238 (28.47%) Finance
2 237 (28.35%) Analytical Skills
3 201 (24.04%) Inclusion and Diversity
4 177 (21.17%) Banking
5 148 (17.70%) Social Skills
6 25 (2.99%) Games
7 18 (2.15%) Law
8 17 (2.03%) Marketing
9 14 (1.67%) Retail
9 14 (1.67%) Telecoms
10 13 (1.56%) Public Sector
11 10 (1.20%) Back Office
12 7 (0.84%) Front Office
13 6 (0.72%) Investment Banking
13 6 (0.72%) Manufacturing
14 5 (0.60%) iGaming
14 5 (0.60%) Wearables
15 4 (0.48%) Health Technology
15 4 (0.48%) Local Government
15 4 (0.48%) Organisational Skills
Job Titles
1 434 (51.91%) Senior
2 319 (38.16%) Developer
3 219 (26.20%) Software Engineer
4 215 (25.72%) Machine Learning Engineer
5 167 (19.98%) Senior Developer
6 76 (9.09%) AWS Developer
7 47 (5.62%) Software Developer
8 39 (4.67%) Full-Stack Developer
9 36 (4.31%) C# Developer
10 31 (3.71%) Senior Software Engineer
11 30 (3.59%) .NET Developer
12 23 (2.75%) Senior Software Developer
13 21 (2.51%) Java Developer
14 18 (2.15%) Lead
14 18 (2.15%) React Developer
15 17 (2.03%) Front-End Developer (Client-Side Developer)
15 17 (2.03%) Umbraco Developer
16 16 (1.91%) Junior
16 16 (1.91%) Senior Full-Stack Developer
17 15 (1.79%) C# .NET Developer
Libraries, Frameworks & Software Standards
1 350 (41.87%) React
2 238 (28.47%) HTML
3 237 (28.35%) CSS
4 196 (23.44%) Spring
5 184 (22.01%) Kafka
6 182 (21.77%) Spring Boot
7 169 (20.22%) Redux
8 166 (19.86%) Hibernate
9 160 (19.14%) JPA
10 121 (14.47%) GraphQL
11 98 (11.72%) .NET
12 78 (9.33%) RESTful
13 72 (8.61%) Serverless Framework
14 66 (7.89%) Node.js
15 50 (5.98%) .NET Core
15 50 (5.98%) .NET Framework
16 41 (4.90%) HTML5
17 37 (4.43%) AngularJS
18 31 (3.71%) Entity Framework
18 31 (3.71%) REST
Miscellaneous
1 235 (28.11%) Self-Motivation
2 166 (19.86%) Enterprise Software
3 161 (19.26%) Product Ownership
4 32 (3.83%) Mobile App
5 29 (3.47%) Cloud Native
6 18 (2.15%) NHS
7 13 (1.56%) Distributed Systems
8 10 (1.20%) Team-Oriented Environment
9 9 (1.08%) Mobile Games
9 9 (1.08%) Private Cloud
10 8 (0.96%) e-Learning
10 8 (0.96%) Legacy Systems
11 7 (0.84%) Greenfield Project
11 7 (0.84%) Smartphone
12 6 (0.72%) Algorithms
12 6 (0.72%) Virtual Team
13 5 (0.60%) Hackathon
13 5 (0.60%) IoT
13 5 (0.60%) Smart Energy
14 4 (0.48%) Data Structures
Operating Systems
1 23 (2.75%) Apple iOS
2 22 (2.63%) Linux
3 15 (1.79%) Android
3 15 (1.79%) Windows
4 13 (1.56%) Unix
5 9 (1.08%) Windows Server
6 4 (0.48%) Mac OS
6 4 (0.48%) Windows 10
7 1 (0.12%) Red Hat Enterprise Linux
7 1 (0.12%) Rocky
Processes & Methodologies
1 612 (73.21%) Agile
2 573 (68.54%) CI/CD
3 355 (42.46%) Problem-Solving
4 337 (40.31%) Mentoring
5 288 (34.45%) Software Engineering
6 258 (30.86%) Microservices
7 241 (28.83%) Test Automation
8 240 (28.71%) DevOps
9 234 (27.99%) Full-Stack Development
10 231 (27.63%) Machine Learning
11 218 (26.08%) Data Science
12 216 (25.84%) Creative Thinking
13 215 (25.72%) Performance Metrics
13 215 (25.72%) Personalization
13 215 (25.72%) TDD
14 203 (24.28%) Front End Development
15 199 (23.80%) Continuous Improvement
16 194 (23.21%) Containerisation
17 182 (21.77%) SDLC
18 175 (20.93%) Performance Optimisation
Programming Languages
1 389 (46.53%) TypeScript
2 353 (42.22%) JavaScript
3 343 (41.03%) Python
4 276 (33.01%) SQL
5 234 (27.99%) Java
6 140 (16.75%) C#
7 33 (3.95%) PHP
8 18 (2.15%) Go
9 14 (1.67%) C++
10 11 (1.32%) C
11 10 (1.20%) Swift
11 10 (1.20%) VB.NET
12 9 (1.08%) T-SQL
13 8 (0.96%) PL/SQL
13 8 (0.96%) Ruby
14 6 (0.72%) Bash
14 6 (0.72%) Dart
14 6 (0.72%) Kotlin
15 5 (0.60%) PowerShell
15 5 (0.60%) Rust
Qualifications
1 286 (34.21%) Degree
2 215 (25.72%) PhD
3 79 (9.45%) AWS Certification
4 35 (4.19%) Computer Science Degree
5 26 (3.11%) SC Cleared
5 26 (3.11%) Security Cleared
6 7 (0.84%) AWS Certified Solutions Architect
6 7 (0.84%) Master's Degree
7 4 (0.48%) Azure Certification
8 2 (0.24%) AWS Certified Developer
8 2 (0.24%) Numerate Degree
9 1 (0.12%) DV Cleared
Quality Assurance & Compliance
1 182 (21.77%) QA
2 31 (3.71%) Accessibility
3 19 (2.27%) WCAG
4 17 (2.03%) GDPR
5 4 (0.48%) NCSC
6 2 (0.24%) CDISC
6 2 (0.24%) ISO 9001
7 1 (0.12%) Data Quality
7 1 (0.12%) ISO 13485
7 1 (0.12%) ISO/IEC 27001
System Software
1 228 (27.27%) Docker
2 9 (1.08%) VMware Infrastructure
3 6 (0.72%) Firmware
4 4 (0.48%) Active Directory
5 3 (0.36%) LXC
6 1 (0.12%) Embedded Firmware
6 1 (0.12%) zsh
Systems Management
1 208 (24.88%) Kubernetes
2 31 (3.71%) Terraform
3 13 (1.56%) Prometheus
4 12 (1.44%) Grafana
5 11 (1.32%) AWS Copilot
6 5 (0.60%) Argo
7 4 (0.48%) Microsoft Intune
8 3 (0.36%) Kibana
9 1 (0.12%) Ansible
9 1 (0.12%) Single Sign-On
Vendors
1 157 (18.78%) Solace
2 28 (3.35%) Google
3 26 (3.11%) Microsoft
4 21 (2.51%) Oracle
5 17 (2.03%) HP
6 10 (1.20%) SAP
7 9 (1.08%) VMware
8 8 (0.96%) Okta
9 6 (0.72%) New Relic
10 4 (0.48%) Databricks
11 3 (0.36%) DevExpress
11 3 (0.36%) IBM
11 3 (0.36%) Sage
12 2 (0.24%) Salesforce
12 2 (0.24%) Splunk
12 2 (0.24%) Sybase
13 1 (0.12%) Adobe
13 1 (0.12%) CA Agile Central
13 1 (0.12%) Telerik
13 1 (0.12%) WooCommerce