Product Roadmap Jobs

Product Roadmaps
UK

The table below provides summary statistics for permanent job vacancies requiring Product Roadmap skills. It includes a benchmarking guide to the annual salaries offered in vacancies that cited Product Roadmap over the 6 months leading up to 13 May 2025, comparing them to the same period in the previous two years.

6 months to
13 May 2025
Same period 2024 Same period 2023
Rank 330 341 251
Rank change year-on-year +11 -90 -88
Permanent jobs citing Product Roadmap 471 836 1,479
As % of all permanent jobs advertised in the UK 0.85% 0.84% 1.46%
As % of the Processes & Methodologies category 0.91% 0.98% 1.53%
Number of salaries quoted 289 632 955
10th Percentile £47,900 £45,000 £47,569
25th Percentile £55,000 £53,750 £52,500
Median annual salary (50th Percentile) £70,000 £70,000 £62,500
Median % change year-on-year - +12.00% -10.71%
75th Percentile £90,000 £83,759 £84,056
90th Percentile £111,250 £92,500 £101,974
UK excluding London median annual salary £62,779 £65,000 £55,000
% change year-on-year -3.42% +18.18% -15.38%

All Process and Methodology Skills
UK

Product Roadmap falls under the Processes and Methodologies category. For comparison with the information above, the following table provides summary statistics for all permanent job vacancies requiring process or methodology skills.

Permanent vacancies with a requirement for process or methodology skills 51,972 84,955 96,877
As % of all permanent jobs advertised in the UK 93.89% 85.58% 95.60%
Number of salaries quoted 26,632 59,894 57,116
10th Percentile £30,000 £29,002 £34,000
25th Percentile £42,000 £40,000 £45,000
Median annual salary (50th Percentile) £57,500 £55,000 £61,000
Median % change year-on-year +4.55% -9.84% +1.67%
75th Percentile £75,000 £72,500 £81,250
90th Percentile £97,500 £92,500 £100,000
UK excluding London median annual salary £52,365 £50,000 £55,000
% change year-on-year +4.73% -9.09% +4.76%

Product Roadmap
Job Vacancy Trend

Job postings citing Product Roadmap as a proportion of all IT jobs advertised.
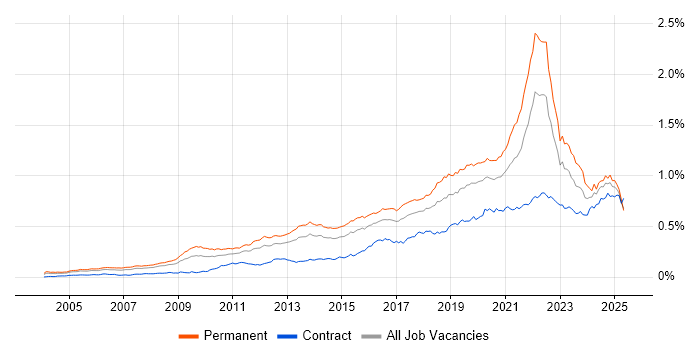
Job vacancy trend for Product Roadmap in the UK

Product Roadmap
Salary Trend

3-month moving average salary quoted in jobs citing Product Roadmap.

Salary trend for Product Roadmap in the UK

Product Roadmap
Salary Histogram

Salary distribution for jobs citing Product Roadmap over the 6 months to 13 May 2025.

Salary histogram for Product Roadmap in the UK

Product Roadmap
Top 16 Job Locations

The table below looks at the demand and provides a guide to the median salaries quoted in IT jobs citing Product Roadmap within the UK over the 6 months to 13 May 2025. The 'Rank Change' column provides an indication of the change in demand within each location based on the same 6 month period last year.

Location Rank Change
on Same Period
Last Year
Matching
Permanent
IT Job Ads
Median Salary
Past 6 Months
Median Salary
% Change
on Same Period
Last Year
Live
Jobs
England -23 431 £72,250 +3.21% 955
London +85 244 £75,000 -6.25% 662
UK excluding London -62 202 £62,779 -3.42% 419
Work from Home -68 135 £65,000 - 424
North of England -84 64 £62,779 -12.69% 118
Midlands +24 43 £62,779 -10.32% 51
North West -44 37 £73,805 - 77
West Midlands +9 36 £62,779 -13.41% 36
South West +80 29 £62,373 +7.35% 35
South East +20 27 £81,250 +35.42% 144
Yorkshire +9 20 £62,779 -6.99% 31
Scotland +111 18 £71,250 +16.80% 31
East of England +17 17 £65,000 -0.94% 32
East Midlands +26 7 £60,000 +41.18% 9
North East +9 7 £52,500 -28.87% 10
Wales +38 4 £59,857 +13.50% 4

Product Roadmap
Co-occurring Skills and Capabilities by Category

The follow tables expand on the table above by listing co-occurrences grouped by category. The same employment type, locality and period is covered with up to 20 co-occurrences shown in each of the following categories:

Application Platforms
1 12 (2.55%) Confluence
2 7 (1.49%) Microsoft Exchange
3 5 (1.06%) SharePoint
4 4 (0.85%) SAS
5 2 (0.42%) CICS
5 2 (0.42%) Mendix
5 2 (0.42%) nginx
6 1 (0.21%) Apache
6 1 (0.21%) Apache Airflow
6 1 (0.21%) WebSphere
Applications
1 11 (2.34%) Microsoft Excel
2 8 (1.70%) Microsoft PowerPoint
3 7 (1.49%) Microsoft Office
3 7 (1.49%) Trello
4 6 (1.27%) MS Visio
5 4 (0.85%) SPSS
6 1 (0.21%) Chatbot
6 1 (0.21%) Microsoft Project
Business Applications
1 12 (2.55%) NetSuite
2 5 (1.06%) Dynamics CRM
3 3 (0.64%) Oracle ERP
4 2 (0.42%) Distributed Ledger
4 2 (0.42%) Dynamics NAV
5 1 (0.21%) Dynamics GP
5 1 (0.21%) Payment Gateway
5 1 (0.21%) Salesforce CRM
5 1 (0.21%) SAP S/4HANA
Cloud Services
1 86 (18.26%) AWS
2 69 (14.65%) SaaS
3 46 (9.77%) Azure
4 12 (2.55%) Power Platform
5 11 (2.34%) Azure AI
5 11 (2.34%) Microsoft 365
5 11 (2.34%) Microsoft Copilot
6 10 (2.12%) Figma
6 10 (2.12%) GCP
7 9 (1.91%) Dynamics 365
8 5 (1.06%) Snowflake
9 4 (0.85%) Google Workspace
9 4 (0.85%) Miro
9 4 (0.85%) Slack
10 3 (0.64%) Azure DevOps
10 3 (0.64%) Datadog
10 3 (0.64%) Serverless
11 2 (0.42%) AWS Lambda
11 2 (0.42%) Azure Service Bus
11 2 (0.42%) OpenShift
Communications & Networking
1 7 (1.49%) Network Security
2 6 (1.27%) Internet
3 5 (1.06%) Wireless
4 3 (0.64%) Bluetooth
4 3 (0.64%) Firewall
4 3 (0.64%) TCP/IP
4 3 (0.64%) Wi-Fi
5 2 (0.42%) 3G
5 2 (0.42%) BGP
5 2 (0.42%) DNS
5 2 (0.42%) F5 BIG-IP LTM
5 2 (0.42%) GPRS
5 2 (0.42%) Intranet
5 2 (0.42%) LTE
5 2 (0.42%) Modbus
5 2 (0.42%) Unified Communications
5 2 (0.42%) VPN
6 1 (0.21%) LoRaWAN
6 1 (0.21%) SSL
6 1 (0.21%) VoIP
Database & Business Intelligence
1 26 (5.52%) MySQL
2 21 (4.46%) PostgreSQL
3 20 (4.25%) Data Lake
4 11 (2.34%) Power BI
5 6 (1.27%) Tableau
6 5 (1.06%) SQL Server
7 4 (0.85%) Apache Hive
7 4 (0.85%) Hadoop
8 3 (0.64%) Big Data
9 2 (0.42%) GIS
9 2 (0.42%) MongoDB
9 2 (0.42%) Spatial Data
10 1 (0.21%) Crystal Reports
10 1 (0.21%) DB2
10 1 (0.21%) Looker
10 1 (0.21%) Metadata
10 1 (0.21%) RDBMS
10 1 (0.21%) Relational Database
Development Applications
1 40 (8.49%) JIRA
2 5 (1.06%) GitLab
3 4 (0.85%) Balsamiq
3 4 (0.85%) Git
4 1 (0.21%) Bitbucket
4 1 (0.21%) Cypress.io
4 1 (0.21%) Selenium
4 1 (0.21%) Visual Studio
General
1 190 (40.34%) Social Skills
2 107 (22.72%) Finance
3 83 (17.62%) Analytical Skills
4 77 (16.35%) Marketing
5 58 (12.31%) Law
6 31 (6.58%) Retail
7 30 (6.37%) Inclusion and Diversity
8 24 (5.10%) Influencing Skills
9 23 (4.88%) Legal
10 21 (4.46%) Presentation Skills
10 21 (4.46%) Public Sector
11 19 (4.03%) Banking
12 15 (3.18%) Organisational Skills
13 13 (2.76%) Financial Institution
13 13 (2.76%) Telecoms
14 11 (2.34%) Advertising
15 9 (1.91%) Electronics
15 9 (1.91%) Health Technology
16 7 (1.49%) Manufacturing
17 6 (1.27%) Games
Job Titles
1 132 (28.03%) Product Manager
2 102 (21.66%) Senior
3 62 (13.16%) Product Owner
4 56 (11.89%) Architect
5 49 (10.40%) Lead
6 46 (9.77%) Senior Manager
7 41 (8.70%) Solutions Architect
8 38 (8.07%) Senior Product Manager
9 30 (6.37%) Senior Architect
9 30 (6.37%) Senior Solutions Architect
10 25 (5.31%) Analyst
11 22 (4.67%) ServiceNow Architect
12 20 (4.25%) Full-Stack Engineer
13 17 (3.61%) Digital Product Manager
14 16 (3.40%) Business Analyst
15 13 (2.76%) Business Manager
15 13 (2.76%) Developer
15 13 (2.76%) Systems Analyst
16 12 (2.55%) CRM Business Analyst
16 12 (2.55%) Financial Business Analyst
Libraries, Frameworks & Software Standards
1 61 (12.95%) React
2 24 (5.10%) REST
3 20 (4.25%) Django
3 20 (4.25%) jQuery
3 20 (4.25%) Ruby on Rails
4 12 (2.55%) .NET
5 7 (1.49%) Laravel
6 6 (1.27%) Kafka
6 6 (1.27%) Node.js
7 5 (1.06%) CodeIgniter
7 5 (1.06%) RESTful
8 3 (0.64%) FHIR
8 3 (0.64%) GraphQL
8 3 (0.64%) HTML
8 3 (0.64%) JSON
8 3 (0.64%) Web Services
8 3 (0.64%) XML
9 2 (0.42%) Alpine.js
9 2 (0.42%) MassTransit
9 2 (0.42%) Tailwind CSS
Miscellaneous
1 113 (23.99%) Product Ownership
2 22 (4.67%) NHS
3 18 (3.82%) Public Cloud
4 15 (3.18%) Enterprise Software
5 14 (2.97%) Legacy Systems
5 14 (2.97%) Mobile App
5 14 (2.97%) Onboarding
6 12 (2.55%) Algorithms
6 12 (2.55%) Taxonomies
7 11 (2.34%) Data Centre
8 10 (2.12%) Analytical Mindset
8 10 (2.12%) Private Cloud
9 8 (1.70%) Cloud Native
9 8 (1.70%) Distributed Architecture
10 7 (1.49%) IoT
11 6 (1.27%) Greenfield Project
12 4 (0.85%) e-Learning
12 4 (0.85%) Life Science
12 4 (0.85%) Virtual Team
13 3 (0.64%) Robotics
Operating Systems
1 11 (2.34%) Windows
2 10 (2.12%) Android
3 9 (1.91%) Linux
4 7 (1.49%) Apple iOS
5 5 (1.06%) Windows Server
6 3 (0.64%) FreeRTOS
7 2 (0.42%) Windows Vista
8 1 (0.21%) Unix
Processes & Methodologies
1 470 (99.79%) Roadmaps
2 222 (47.13%) Agile
3 132 (28.03%) Product Strategy
4 117 (24.84%) User Experience
5 111 (23.57%) Product Management
6 107 (22.72%) Problem-Solving
7 93 (19.75%) Analytics
8 91 (19.32%) Artificial Intelligence
9 89 (18.90%) Continuous Improvement
10 76 (16.14%) Stakeholder Management
11 75 (15.92%) Product Vision
12 70 (14.86%) Project Management
13 69 (14.65%) Decision-Making
14 66 (14.01%) Software Engineering
15 59 (12.53%) User Stories
16 55 (11.68%) Business Strategy
16 55 (11.68%) Thought Leadership
17 54 (11.46%) Backlog Management
17 54 (11.46%) Computer Science
18 49 (10.40%) Scrum
Programming Languages
1 76 (16.14%) Python
2 40 (8.49%) TypeScript
3 20 (4.25%) Ruby
4 17 (3.61%) SQL
5 14 (2.97%) PHP
6 13 (2.76%) JavaScript
7 11 (2.34%) Java
8 10 (2.12%) C#
9 5 (1.06%) R
10 4 (0.85%) MATLAB
10 4 (0.85%) Perl
11 3 (0.64%) C
11 3 (0.64%) C++
11 3 (0.64%) Embedded C
11 3 (0.64%) Embedded C++
12 2 (0.42%) Go
12 2 (0.42%) Kotlin
12 2 (0.42%) PL/SQL
12 2 (0.42%) PowerShell
13 1 (0.21%) JCL
Qualifications
1 108 (22.93%) Degree
2 41 (8.70%) Computer Science Degree
3 13 (2.76%) Security Cleared
4 12 (2.55%) Master's Degree
5 11 (2.34%) Azure Certification
6 9 (1.91%) CSPO
6 9 (1.91%) SC Cleared
7 7 (1.49%) CCNP
7 7 (1.49%) Cisco Certification
8 6 (1.27%) BPSS Clearance
9 4 (0.85%) AWS Certification
9 4 (0.85%) AWS Certified Solutions Architect
9 4 (0.85%) TOGAF Certification
10 3 (0.64%) APMG
10 3 (0.64%) CCIE
10 3 (0.64%) CCSE
10 3 (0.64%) CISM
10 3 (0.64%) CISSP
10 3 (0.64%) MBA
11 2 (0.42%) PhD
Quality Assurance & Compliance
1 32 (6.79%) QA
2 16 (3.40%) GDPR
3 11 (2.34%) Accessibility
3 11 (2.34%) California Consumer Privacy Act
4 8 (1.70%) Data Quality
5 5 (1.06%) IEC 62304
5 5 (1.06%) ISO/IEC 27001
6 3 (0.64%) 21 CFR Part 11
6 3 (0.64%) Good Clinical Practice
6 3 (0.64%) MISRA
6 3 (0.64%) PMBOK
6 3 (0.64%) PMO
7 2 (0.42%) ISO 13485
8 1 (0.21%) PSD2
System Software
1 2 (0.42%) Docker
2 1 (0.21%) Active Directory
2 1 (0.21%) Firmware
2 1 (0.21%) Hyper-V
2 1 (0.21%) RACF
2 1 (0.21%) VMware Infrastructure
Systems Management
1 8 (1.70%) Kubernetes
2 4 (0.85%) Grafana
2 4 (0.85%) Terraform
3 3 (0.64%) Prometheus
4 2 (0.42%) Ansible
4 2 (0.42%) FortiGate
5 1 (0.21%) Puppet
Vendors
1 42 (8.92%) Microsoft
2 38 (8.07%) ServiceNow
3 28 (5.94%) Salesforce
4 24 (5.10%) Google
5 16 (3.40%) OpenAI
6 15 (3.18%) SAP
7 11 (2.34%) Workday
8 10 (2.12%) Oracle
9 7 (1.49%) YouTube
10 6 (1.27%) Databricks
11 5 (1.06%) F5
11 5 (1.06%) Fortinet
12 4 (0.85%) Arista
12 4 (0.85%) Cisco
12 4 (0.85%) Duck Creek
12 4 (0.85%) Facebook
12 4 (0.85%) Vertica
13 3 (0.64%) Bloomberg
13 3 (0.64%) CheckPoint
13 3 (0.64%) Palo Alto