High Availability Jobs with Work from Home Options

High Availability
UK > Work from Home

The table below provides summary statistics for permanent job vacancies with an option to work from home (WFH) and a requirement for High Availability skills. Included is a benchmarking guide to the salaries offered in vacancies that have cited High Availability over the 6 months to 25 May 2024 with a comparison to the same period in the previous 2 years.

6 months to
25 May 2024
Same period 2023 Same period 2022
Rank 306 281 338
Rank change year-on-year -25 +57 -70
Permanent jobs citing High Availability 328 475 749
As % of all permanent jobs with a WFH option 0.96% 1.19% 1.04%
As % of the Processes & Methodologies category 1.06% 1.24% 1.07%
Number of salaries quoted 271 362 420
10th Percentile £45,000 £40,000 £41,125
25th Percentile £51,250 £49,813 £47,875
Median annual salary (50th Percentile) £57,500 £67,500 £62,500
Median % change year-on-year -14.81% +8.00% +8.70%
75th Percentile £80,000 £87,500 £75,000
90th Percentile £98,750 £103,750 £87,750
UK median annual salary £57,500 £65,000 £59,500
% change year-on-year -11.54% +9.24% +3.48%

All Process and Methodology Skills
Work from Home

High Availability is in the Processes and Methodologies category. The following table is for comparison with the above and provides summary statistics for all permanent job vacancies with a WFH option and a requirement for process or methodology skills.

Permanent vacancies with a requirement for process or methodology skills 30,950 38,268 69,952
As % of all permanent jobs with a WFH option 90.73% 96.05% 97.09%
Number of salaries quoted 23,425 26,570 41,531
10th Percentile £33,750 £37,500 £36,250
25th Percentile £42,500 £47,500 £46,000
Median annual salary (50th Percentile) £57,500 £62,500 £60,000
Median % change year-on-year -8.00% +4.17% +9.09%
75th Percentile £75,000 £82,500 £80,000
90th Percentile £95,000 £100,000 £95,000
UK median annual salary £55,000 £61,000 £60,000
% change year-on-year -9.84% +1.67% +9.09%

High Availability
Trend for Jobs with a WFH Option

Job vacancies with a work from home option citing High Availability as a proportion of all IT jobs advertised.
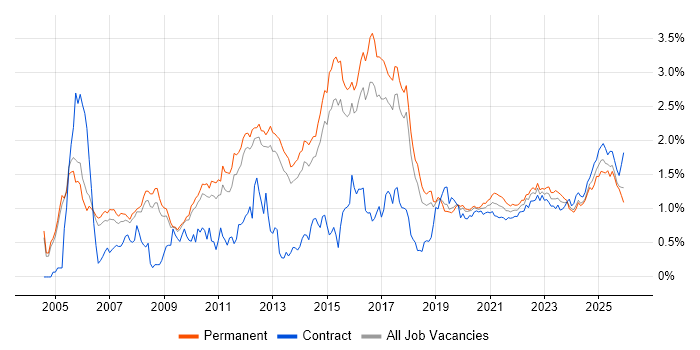
High Availability trend for jobs with a WFH option

High Availability
Salary Trend for Jobs with a WFH Option

3-month moving average salary quoted in job vacancies with a work from home option citing High Availability.

High Availability salary trend for jobs with a WFH option

High Availability
Salary Histogram for Jobs with a WFH Option

Salary distribution for jobs with a work from home option citing High Availability over the 6 months to 25 May 2024.

High Availability salary histogram for jobs with a WFH option

High Availability
Co-occurring Skills and Capabilities with WFH Options by Category

The follow tables expand on the table above by listing co-occurrences grouped by category. The same employment type, locality and period is covered with up to 20 co-occurrences shown in each of the following categories:

Application Platforms
1 28 (8.54%) Apache Spark
2 17 (5.18%) IIS
3 8 (2.44%) Tomcat
4 6 (1.83%) Apache
5 5 (1.52%) CMS
6 4 (1.22%) JBoss
6 4 (1.22%) Microsoft Exchange
6 4 (1.22%) SharePoint
6 4 (1.22%) Umbraco
7 3 (0.91%) Apache Airflow
7 3 (0.91%) GlassFish
8 1 (0.30%) Drupal
8 1 (0.30%) nginx
8 1 (0.30%) OpenStack
8 1 (0.30%) WordPress
Applications
1 5 (1.52%) Microsoft Excel
1 5 (1.52%) Microsoft Office
2 1 (0.30%) MS Visio
Business Applications
1 2 (0.61%) Remedy ITSM
2 1 (0.30%) SAP Business One
Cloud Services
1 194 (59.15%) Azure
2 81 (24.70%) Power Platform
3 79 (24.09%) AWS
4 69 (21.04%) GCP
5 41 (12.50%) SaaS
6 40 (12.20%) Amazon S3
7 32 (9.76%) GitHub
8 19 (5.79%) Amazon SQS
8 19 (5.79%) Google Docs
8 19 (5.79%) Lucidchart
8 19 (5.79%) Miro
8 19 (5.79%) Slack
9 13 (3.96%) Microsoft 365
9 13 (3.96%) Serverless
10 12 (3.66%) Amazon EC2
10 12 (3.66%) AWS Lambda
11 9 (2.74%) Azure DevOps
12 8 (2.44%) Azure Monitor
12 8 (2.44%) OCI
13 7 (2.13%) Azure Functions
Communications & Networking
1 78 (23.78%) Broadband
2 33 (10.06%) Firewall
3 25 (7.62%) DNS
4 15 (4.57%) VPN
5 14 (4.27%) SAN
5 14 (4.27%) TCP/IP
6 10 (3.05%) Internet
7 9 (2.74%) SNMP
7 9 (2.74%) tcpdump
8 7 (2.13%) LAN
9 5 (1.52%) SSL
9 5 (1.52%) WAN
10 4 (1.22%) BGP
10 4 (1.22%) OSPF
10 4 (1.22%) WLAN
11 3 (0.91%) Cisco ASA
11 3 (0.91%) MPLS
11 3 (0.91%) Reverse Proxy
11 3 (0.91%) SD-WAN
12 2 (0.61%) Cisco Firepower
Database & Business Intelligence
1 142 (43.29%) SQL Server
2 81 (24.70%) Power BI
3 74 (22.56%) Azure SQL Database
4 32 (9.76%) Big Data
5 30 (9.15%) Elasticsearch
6 29 (8.84%) Hadoop
7 28 (8.54%) Relational Database
8 23 (7.01%) MySQL
9 19 (5.79%) MongoDB
9 19 (5.79%) Redis
9 19 (5.79%) Scylla
10 17 (5.18%) Data Warehouse
10 17 (5.18%) NoSQL
11 15 (4.57%) BigQuery
12 10 (3.05%) Amazon RDS
12 10 (3.05%) Data Lake
13 8 (2.44%) SQL Server Integration Services
14 7 (2.13%) PostgreSQL
14 7 (2.13%) SQL Server Analysis Services
14 7 (2.13%) SQL Server Reporting Services
Development Applications
1 42 (12.80%) Git
2 31 (9.45%) Jenkins
3 16 (4.88%) TeamCity
4 10 (3.05%) GitLab
5 9 (2.74%) Octopus Deploy
6 4 (1.22%) Oracle Forms
7 3 (0.91%) Maven
7 3 (0.91%) Selenium
8 2 (0.61%) Bitbucket
8 2 (0.61%) Subversion
9 1 (0.30%) CircleCI
9 1 (0.30%) Cucumber
9 1 (0.30%) IntelliJ
9 1 (0.30%) JMeter
9 1 (0.30%) JUnit
General
1 162 (49.39%) Social Skills
2 54 (16.46%) Finance
3 37 (11.28%) Analytical Skills
4 26 (7.93%) Music Industry
5 25 (7.62%) Inclusion and Diversity
6 11 (3.35%) Legal
6 11 (3.35%) Telecoms
7 9 (2.74%) Banking
8 5 (1.52%) Public Sector
9 4 (1.22%) Games
9 4 (1.22%) Influencing Skills
9 4 (1.22%) Police
10 2 (0.61%) Documentation Skills
11 1 (0.30%) Aerospace
11 1 (0.30%) Automotive
11 1 (0.30%) Aviation
11 1 (0.30%) Investment Banking
11 1 (0.30%) Law
11 1 (0.30%) Retail
Job Titles
1 95 (28.96%) DBA
2 87 (26.52%) SQL DBA
3 46 (14.02%) Developer
4 37 (11.28%) Senior
5 32 (9.76%) DevOps Engineer
6 26 (7.93%) .NET Developer
6 26 (7.93%) C# .NET Developer
6 26 (7.93%) C# Developer
7 24 (7.32%) Software Engineer
8 21 (6.40%) Infrastructure Engineer
9 19 (5.79%) Principal Engineer
9 19 (5.79%) Principal Software Engineer
10 16 (4.88%) Azure Engineer
11 14 (4.27%) Architect
11 14 (4.27%) Senior DevOps
11 14 (4.27%) Senior DevOps Engineer
12 13 (3.96%) Linux Engineer
12 13 (3.96%) SQL Server DBA
13 12 (3.66%) Lead
13 12 (3.66%) PHP Developer
Libraries, Frameworks & Software Standards
1 43 (13.11%) HTML
2 38 (11.59%) HTML5
3 33 (10.06%) .NET
4 32 (9.76%) RESTful
5 31 (9.45%) Kafka
6 26 (7.93%) .NET Core
6 26 (7.93%) AngularJS
6 26 (7.93%) ASP.NET
6 26 (7.93%) ASP.NET MVC
6 26 (7.93%) ASP.NET Web API
6 26 (7.93%) LINQ
7 23 (7.01%) GraphQL
8 16 (4.88%) CSS
9 12 (3.66%) CSS3
9 12 (3.66%) jQuery
9 12 (3.66%) Laravel
9 12 (3.66%) Symfony
10 11 (3.35%) Elastic Stack
11 9 (2.74%) YAML
12 8 (2.44%) Node.js
Miscellaneous
1 44 (13.41%) Clustering
2 36 (10.98%) Algorithms
3 35 (10.67%) Data Structures
4 32 (9.76%) Replication
5 26 (7.93%) Cloud Native
5 26 (7.93%) Data Centre
6 23 (7.01%) Legacy Systems
7 14 (4.27%) Management Information System
7 14 (4.27%) Self-Motivation
8 11 (3.35%) PMI
9 10 (3.05%) AS400
9 10 (3.05%) iSeries
10 9 (2.74%) Product Ownership
11 7 (2.13%) Hybrid Cloud
11 7 (2.13%) Public Cloud
12 6 (1.83%) Onboarding
12 6 (1.83%) PKI
13 4 (1.22%) Driving Licence
13 4 (1.22%) Enterprise Cloud
13 4 (1.22%) Team-Oriented Environment
Operating Systems
1 84 (25.61%) VMS
2 51 (15.55%) Windows
3 37 (11.28%) Linux
4 23 (7.01%) Windows Server
5 15 (4.57%) Red Hat Enterprise Linux
6 13 (3.96%) Solaris
7 10 (3.05%) Oracle Linux
8 5 (1.52%) Unix
9 4 (1.22%) AIX
9 4 (1.22%) Windows Server 2012
10 2 (0.61%) Windows 10
10 2 (0.61%) Windows Server 2016
10 2 (0.61%) Windows Server 2019
Processes & Methodologies
1 144 (43.90%) Disaster Recovery
2 121 (36.89%) Performance Tuning
3 96 (29.27%) Problem-Solving
4 87 (26.52%) Collaborative Working
5 82 (25.00%) Business Intelligence
6 71 (21.65%) Agile
7 67 (20.43%) DevOps
8 62 (18.90%) CI/CD
9 49 (14.94%) Continuous Improvement
10 47 (14.33%) Infrastructure as Code
11 43 (13.11%) Software Engineering
12 39 (11.89%) Computer Science
13 38 (11.59%) Cybersecurity
13 38 (11.59%) Microservices
14 33 (10.06%) Containerisation
15 32 (9.76%) Code Quality
15 32 (9.76%) Mentoring
15 32 (9.76%) Migration
16 31 (9.45%) Infrastructure Engineering
17 28 (8.54%) User Experience
Programming Languages
1 108 (32.93%) SQL
2 87 (26.52%) T-SQL
3 72 (21.95%) Python
4 54 (16.46%) PowerShell
5 46 (14.02%) Bash
6 45 (13.72%) Java
7 40 (12.20%) C#
8 39 (11.89%) JavaScript
9 37 (11.28%) Go
10 26 (7.93%) Scala
11 14 (4.27%) PHP
12 9 (2.74%) Perl
13 4 (1.22%) TypeScript
14 3 (0.91%) VBScript
15 2 (0.61%) VB
16 1 (0.30%) C
Qualifications
1 79 (24.09%) Microsoft Certification
2 51 (15.55%) Degree
3 24 (7.32%) Computer Science Degree
4 11 (3.35%) PMI Certification
4 11 (3.35%) SC Cleared
4 11 (3.35%) Security Cleared
5 9 (2.74%) Master's Degree
6 6 (1.83%) Numerate Degree
7 5 (1.52%) CCNA
7 5 (1.52%) Cisco Certification
8 4 (1.22%) Azure Certification
8 4 (1.22%) MCSE
9 3 (0.91%) AWS Certification
10 2 (0.61%) AWS Certified DevOps Engineer
10 2 (0.61%) AWS Certified Solutions Architect
11 1 (0.30%) A+ Certification
11 1 (0.30%) CCNP
11 1 (0.30%) MCP
11 1 (0.30%) MCSA
11 1 (0.30%) RHCE
Quality Assurance & Compliance
1 31 (9.45%) QA
2 5 (1.52%) SLA
3 3 (0.91%) GDPR
4 2 (0.61%) PCI DSS
5 1 (0.30%) California Consumer Privacy Act
5 1 (0.30%) ISO 9001
5 1 (0.30%) ISO/IEC 27001
System Software
1 84 (25.61%) Virtual Machines
2 52 (15.85%) Docker
3 35 (10.67%) Active Directory
4 19 (5.79%) VMware ESXi
5 12 (3.66%) VMware Infrastructure
6 8 (2.44%) Hyper-V
7 4 (1.22%) Virtual Desktop
8 2 (0.61%) NFS
8 2 (0.61%) Virtual Servers
8 2 (0.61%) vSphere
9 1 (0.30%) Ceph
9 1 (0.30%) Microsoft App-V
9 1 (0.30%) PowerDNS
Systems Management
1 73 (22.26%) Kubernetes
2 53 (16.16%) Terraform
3 43 (13.11%) Ansible
4 20 (6.10%) Grafana
5 16 (4.88%) Nagios
6 11 (3.35%) HAProxy
6 11 (3.35%) Microsoft Clustering
6 11 (3.35%) Puppet
6 11 (3.35%) vCenter Server
7 9 (2.74%) Graphite
8 8 (2.44%) Prometheus
8 8 (2.44%) WSUS
9 7 (2.13%) Foglight
10 5 (1.52%) Pingdom
11 4 (1.22%) Istio
11 4 (1.22%) Single Sign-On
12 3 (0.91%) Failover Clustering
12 3 (0.91%) Kibana
12 3 (0.91%) Oracle Statspack
13 2 (0.61%) Nessus
Vendors
1 146 (44.51%) Microsoft
2 33 (10.06%) Google
3 27 (8.23%) Oracle
4 22 (6.71%) Dell
4 22 (6.71%) IBM
5 16 (4.88%) VMware
6 14 (4.27%) Cisco
7 10 (3.05%) Red Hat
7 10 (3.05%) Serena
7 10 (3.05%) SolarWinds
8 7 (2.13%) ArcSight
8 7 (2.13%) HP
9 6 (1.83%) Teradata
10 4 (1.22%) Aruba
10 4 (1.22%) Extreme Networks
10 4 (1.22%) Fortinet
10 4 (1.22%) ServiceNow
11 3 (0.91%) New Relic
11 3 (0.91%) NGA Human Resources
11 3 (0.91%) SnapLogic