Machine Learning Jobs with Hybrid/Remote/WFH Options

Machine Learning (ML)
UK > Work from Home

The table below provides summary statistics for permanent remote or hybrid work requiring Machine Learning skills. It includes a benchmarking guide to the annual salaries offered in vacancies that cited Machine Learning over the 6 months leading up to 3 August 2025, comparing them to the same period in the previous two years.

6 months to
3 Aug 2025
Same period 2024 Same period 2023
Rank 32 115 105
Rank change year-on-year +83 -10 -37
Permanent jobs citing Machine Learning 1,488 696 966
As % of all permanent jobs with a WFH option 6.89% 2.65% 3.02%
As % of the Processes & Methodologies category 7.42% 3.00% 3.15%
Number of salaries quoted 255 511 658
10th Percentile £46,350 £40,000 £43,750
25th Percentile £56,250 £55,000 £51,833
Median annual salary (50th Percentile) £80,000 £70,000 £67,500
Median % change year-on-year +14.29% +3.70% -10.00%
75th Percentile £100,000 £92,500 £85,000
90th Percentile £137,250 £105,000 £105,000
UK median annual salary £80,000 £75,000 £72,500
% change year-on-year +6.67% +3.45% -3.33%

All Process and Methodology Skills
Work from Home

Machine Learning falls under the Processes and Methodologies category. For comparison with the information above, the following table provides summary statistics for all permanent job vacancies with remote or hybrid options requiring process or methodology skills.

Permanent vacancies with a requirement for process or methodology skills 20,042 23,177 30,705
As % of all permanent jobs with a WFH option 92.77% 88.26% 95.92%
Number of salaries quoted 10,444 16,004 22,790
10th Percentile £25,313 £35,000 £37,500
25th Percentile £38,500 £43,329 £47,500
Median annual salary (50th Percentile) £56,888 £58,700 £62,500
Median % change year-on-year -3.09% -6.08% +4.17%
75th Percentile £76,250 £77,500 £81,250
90th Percentile £99,800 £97,500 £100,000
UK median annual salary £55,000 £55,000 £60,000
% change year-on-year - -8.33% -

Machine Learning
Trend for Jobs with a WFH Option

Job vacancies with remote working options citing Machine Learning as a proportion of all IT jobs advertised.
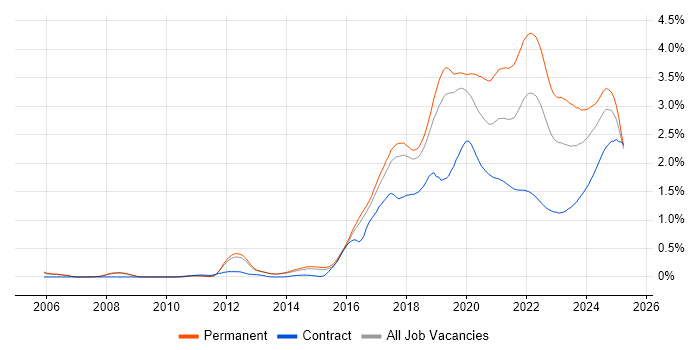
Machine Learning trend for jobs with Hybrid/Remote/WFH options

Machine Learning
Salary Trend for Jobs with a WFH Option

3-month moving average salary quoted in job vacancies with remote working options citing Machine Learning.

Machine Learning salary trend for jobs with a WFH option

Machine Learning
Salary Histogram for Jobs with a WFH Option

Salary distribution for jobs with remote working options citing Machine Learning over the 6 months to 3 August 2025.

Machine Learning salary histogram for jobs with a WFH option

Machine Learning
Co-occurring Skills and Capabilities with WFH Options by Category

The follow tables expand on the table above by listing co-occurrences grouped by category. The same employment type, locality and period is covered with up to 20 co-occurrences shown in each of the following categories:

Application Platforms
1 27 (1.81%) Apache Spark
2 23 (1.55%) Jupyter
3 19 (1.28%) Apache Airflow
4 9 (0.60%) Apache
5 5 (0.34%) Confluence
6 3 (0.20%) SAS
7 2 (0.13%) ArcGIS
7 2 (0.13%) CMS
7 2 (0.13%) Microsoft Exchange
7 2 (0.13%) SharePoint
7 2 (0.13%) Skype for Business
Applications
1 11 (0.74%) Chatbot
2 10 (0.67%) Microsoft Excel
3 2 (0.13%) Adobe XD
3 2 (0.13%) Microsoft Office
3 2 (0.13%) Simulink
3 2 (0.13%) Sketch
3 2 (0.13%) Trello
4 1 (0.067%) 3ds Max
4 1 (0.067%) Blender
4 1 (0.067%) Spreadsheet
Business Applications
1 6 (0.40%) Adaptiv
2 5 (0.34%) Dynamics CRM
3 3 (0.20%) SAP S/4HANA
4 2 (0.13%) SAP LE
5 1 (0.067%) SAP APO
5 1 (0.067%) SAP EWM
5 1 (0.067%) SAP IBP
5 1 (0.067%) SAP MM
5 1 (0.067%) SAP PP
5 1 (0.067%) SAP QM
5 1 (0.067%) SAP SCM
5 1 (0.067%) SAP SD
Cloud Services
1 487 (32.73%) Azure
2 482 (32.39%) AWS
3 429 (28.83%) GCP
4 224 (15.05%) Serverless
5 221 (14.85%) AWS Lambda
6 37 (2.49%) Power Platform
7 22 (1.48%) Azure Machine Learning
8 15 (1.01%) Amazon SageMaker
8 15 (1.01%) Azure Data Factory
8 15 (1.01%) GitHub
9 14 (0.94%) SaaS
10 13 (0.87%) Azure DevOps
11 9 (0.60%) dbt
12 8 (0.54%) Microsoft 365
13 7 (0.47%) Amazon S3
13 7 (0.47%) GitHub Actions
13 7 (0.47%) Snowflake
14 6 (0.40%) Google Data Studio
14 6 (0.40%) PaaS
15 5 (0.34%) Fivetran
Communications & Networking
1 324 (21.77%) Broadband
2 7 (0.47%) HTTP
3 4 (0.27%) DHCP
3 4 (0.27%) DNS
3 4 (0.27%) TCP/IP
4 3 (0.20%) Internet
4 3 (0.20%) SAN
5 2 (0.13%) Firewall
5 2 (0.13%) MQTT
5 2 (0.13%) Skype
5 2 (0.13%) WAN
6 1 (0.067%) Network Security
6 1 (0.067%) VoIP
6 1 (0.067%) VPN
Database & Business Intelligence
1 131 (8.80%) Tableau
2 110 (7.39%) Metadata
3 56 (3.76%) Big Data
4 36 (2.42%) Power BI
5 22 (1.48%) PostgreSQL
5 22 (1.48%) SQL Server
6 15 (1.01%) NoSQL
7 14 (0.94%) Data Warehouse
8 12 (0.81%) Redis
9 11 (0.74%) Relational Database
10 10 (0.67%) MongoDB
11 9 (0.60%) Elasticsearch
12 8 (0.54%) MySQL
13 5 (0.34%) BigQuery
13 5 (0.34%) Data Lake
13 5 (0.34%) Looker
14 4 (0.27%) Amazon Redshift
14 4 (0.27%) Azure SQL Database
15 3 (0.20%) GIS
15 3 (0.20%) Power Query
Development Applications
1 34 (2.28%) Git
2 19 (1.28%) GitLab
3 16 (1.08%) SonarQube
4 15 (1.01%) Sonatype Nexus
5 7 (0.47%) Jenkins
5 7 (0.47%) JIRA
6 3 (0.20%) ER Studio
6 3 (0.20%) MLflow
6 3 (0.20%) RStudio
7 2 (0.13%) Artifactory
7 2 (0.13%) Bitbucket
7 2 (0.13%) Visual Studio
8 1 (0.067%) Cypress.io
8 1 (0.067%) PHPUnit
8 1 (0.067%) Vite
General
1 567 (38.10%) Retail
2 559 (37.57%) Manufacturing
3 317 (21.30%) Analytical Skills
4 240 (16.13%) Inclusion and Diversity
5 238 (15.99%) Social Skills
6 196 (13.17%) Dutch Language
6 196 (13.17%) Finnish Language
7 131 (8.80%) Finance
8 128 (8.60%) Games
9 49 (3.29%) Catalan Language
10 27 (1.81%) Banking
11 23 (1.55%) Marketing
12 22 (1.48%) Law
13 12 (0.81%) Publishing
14 11 (0.74%) Advertising
14 11 (0.74%) Legal
15 10 (0.67%) Pharmaceutical
15 10 (0.67%) Public Sector
16 7 (0.47%) Telecoms
17 6 (0.40%) Presentation Skills
Job Titles
1 548 (36.83%) Trainer
2 477 (32.06%) Senior
3 223 (14.99%) Machine Learning Engineer
4 208 (13.98%) Software Engineer
5 192 (12.90%) Senior Software Engineer
6 109 (7.33%) Incident Manager
7 92 (6.18%) Data Scientist
8 46 (3.09%) Senior Data Scientist
9 42 (2.82%) Lead
10 29 (1.95%) Analyst
11 26 (1.75%) Developer
12 24 (1.61%) Python Engineer
13 22 (1.48%) Architect
14 18 (1.21%) Data Engineer
15 17 (1.14%) DevOps Engineer
15 17 (1.14%) Head of AI
16 13 (0.87%) Artificial Intelligence Engineer
17 12 (0.81%) AWS Engineer
17 12 (0.81%) Kubernetes Engineer
18 11 (0.74%) AWS DevOps
Libraries, Frameworks & Software Standards
1 195 (13.10%) .NET
2 192 (12.90%) Node.js
3 64 (4.30%) HTML
4 43 (2.89%) scikit-learn
5 42 (2.82%) TensorFlow
6 32 (2.15%) PyTorch
7 26 (1.75%) Pandas
7 26 (1.75%) REST
8 21 (1.41%) Kafka
9 19 (1.28%) NumPy
10 16 (1.08%) RESTful
11 15 (1.01%) PySpark
12 14 (0.94%) Hugging Face
13 13 (0.87%) Keras
14 10 (0.67%) .NET Framework
15 9 (0.60%) CSS
15 9 (0.60%) gRPC
15 9 (0.60%) RabbitMQ
15 9 (0.60%) React
16 8 (0.54%) Elastic Stack
Miscellaneous
1 564 (37.90%) Robotics
2 396 (26.61%) Self-Motivation
3 224 (15.05%) Cyberattack
4 180 (12.10%) Linux Command Line
5 109 (7.33%) Over-the-Top Content
6 86 (5.78%) Algorithms
7 18 (1.21%) Credit Risk
8 11 (0.74%) Distributed Systems
9 10 (0.67%) Product Ownership
10 9 (0.60%) Market Risk
11 8 (0.54%) Distributed Computing
11 8 (0.54%) Greenfield Project
11 8 (0.54%) Management Information System
11 8 (0.54%) Reinsurance
12 7 (0.47%) AI Agents
12 7 (0.47%) IoT
12 7 (0.47%) Virtual Team
13 6 (0.40%) Driving Licence
14 5 (0.34%) Cloud Native
14 5 (0.34%) Onboarding
Operating Systems
1 189 (12.70%) Linux
2 10 (0.67%) Windows
3 4 (0.27%) Windows Server
4 3 (0.20%) Android
5 2 (0.13%) Apple iOS
5 2 (0.13%) Red Hat Enterprise Linux
5 2 (0.13%) VMS
5 2 (0.13%) Windows Server 2003
5 2 (0.13%) Windows Server 2019
6 1 (0.067%) Debian
6 1 (0.067%) Ubuntu
Processes & Methodologies
1 977 (65.66%) Problem-Solving
2 968 (65.05%) Artificial Intelligence
3 622 (41.80%) LLM
4 594 (39.92%) Data Privacy
5 586 (39.38%) Generative AI
6 539 (36.22%) Red Team
7 453 (30.44%) Agile
8 442 (29.70%) Mentoring
9 369 (24.80%) Data Science
10 265 (17.81%) CI/CD
11 261 (17.54%) Software Engineering
12 232 (15.59%) Personalization
13 222 (14.92%) Microservices
13 222 (14.92%) Performance Metrics
14 219 (14.72%) Data Engineering
15 216 (14.52%) Clean Code
16 215 (14.45%) Creative Thinking
17 204 (13.71%) User Experience
18 191 (12.84%) Scrum
19 187 (12.57%) Cloud Security
Programming Languages
1 679 (45.63%) Python
2 274 (18.41%) Java
3 269 (18.08%) TypeScript
4 266 (17.88%) JavaScript
5 250 (16.80%) C++
6 231 (15.52%) Rust
7 183 (12.30%) Go
8 159 (10.69%) SQL
9 70 (4.70%) R
10 65 (4.37%) MATLAB
11 63 (4.23%) C#
12 52 (3.49%) PHP
13 49 (3.29%) C
13 49 (3.29%) Dart
13 49 (3.29%) Ruby
14 12 (0.81%) Scala
15 8 (0.54%) T-SQL
16 7 (0.47%) Bash
16 7 (0.47%) PowerShell
17 4 (0.27%) Data Analysis Expressions
Qualifications
1 941 (63.24%) Degree
2 252 (16.94%) PhD
3 238 (15.99%) Security Cleared
4 229 (15.39%) DV Cleared
5 180 (12.10%) AWS Certification
6 178 (11.96%) AWS Certified Developer
6 178 (11.96%) AWS Certified Solutions Architect
7 84 (5.65%) Computer Science Degree
8 31 (2.08%) Master's Degree
9 29 (1.95%) Numerate Degree
10 14 (0.94%) DBS Check
11 13 (0.87%) PMP
12 12 (0.81%) CFA
12 12 (0.81%) PMI Certification
13 8 (0.54%) Postgraduate
14 7 (0.47%) SC Cleared
15 6 (0.40%) ITIL Certification
16 4 (0.27%) Azure Certification
16 4 (0.27%) Microsoft Certification
17 3 (0.20%) BPSS Clearance
Quality Assurance & Compliance
1 17 (1.14%) Accessibility
1 17 (1.14%) Data Quality
2 12 (0.81%) GDPR
3 5 (0.34%) ISO/IEC 27001
3 5 (0.34%) QA
4 4 (0.27%) Sarbanes-Oxley
5 2 (0.13%) Actionable Recommendations
5 2 (0.13%) SLA
6 1 (0.067%) California Consumer Privacy Act
6 1 (0.067%) Cyber Essentials
6 1 (0.067%) Cyber Essentials PLUS
6 1 (0.067%) HL7
6 1 (0.067%) PMO
System Software
1 69 (4.64%) Docker
2 5 (0.34%) Active Directory
3 2 (0.13%) Hyper-V
3 2 (0.13%) Virtual Machines
3 2 (0.13%) VMware Infrastructure
4 1 (0.067%) Firmware
Systems Management
1 75 (5.04%) Kubernetes
2 30 (2.02%) Terraform
3 18 (1.21%) Ansible
4 4 (0.27%) SCOM
5 2 (0.13%) Kubeflow
5 2 (0.13%) Packer
5 2 (0.13%) Progress Chef
5 2 (0.13%) Puppet
5 2 (0.13%) SCCM
5 2 (0.13%) SCOrch
5 2 (0.13%) SCSM
6 1 (0.067%) Kibana
6 1 (0.067%) logstash
Vendors
1 579 (38.91%) Databricks
2 568 (38.17%) Google
3 541 (36.36%) Adobe
4 113 (7.59%) ServiceNow
5 29 (1.95%) Microsoft
6 12 (0.81%) Murex
7 11 (0.74%) OpenAI
8 7 (0.47%) Apple
9 6 (0.40%) FIS
9 6 (0.40%) Salesforce
9 6 (0.40%) SAP
10 5 (0.34%) Alteryx
11 4 (0.27%) HubSpot
11 4 (0.27%) Talend
11 4 (0.27%) Zoho
12 3 (0.20%) PayPal
12 3 (0.20%) Red Hat
12 3 (0.20%) Splunk
13 2 (0.13%) Genesys
13 2 (0.13%) Oracle