User Experience Jobs with Hybrid/Remote/WFH Options

UX
UK > Work from Home

The table below provides summary statistics for permanent remote or hybrid work requiring User Experience skills. It includes a benchmarking guide to the annual salaries offered in vacancies that cited User Experience over the 6 months leading up to 4 May 2025, comparing them to the same period in the previous two years.

6 months to
4 May 2025
Same period 2024 Same period 2023
Rank 58 81 65
Rank change year-on-year +23 -16 -32
Permanent jobs citing User Experience 750 1,258 2,044
As % of all permanent jobs with a WFH option 4.89% 3.72% 4.81%
As % of the Processes & Methodologies category 5.25% 4.06% 5.00%
Number of salaries quoted 442 976 1,335
10th Percentile £39,025 £32,500 £41,250
25th Percentile £47,503 £40,750 £50,000
Median annual salary (50th Percentile) £62,779 £51,000 £65,000
Median % change year-on-year +23.10% -21.54% +8.33%
75th Percentile £80,000 £68,750 £85,000
90th Percentile £117,500 £82,500 £105,000
UK median annual salary £57,500 £51,000 £62,500
% change year-on-year +12.75% -18.40% +4.17%

All Process and Methodology Skills
Work from Home

User Experience falls under the Processes and Methodologies category. For comparison with the information above, the following table provides summary statistics for all permanent job vacancies with remote or hybrid options requiring process or methodology skills.

Permanent vacancies with a requirement for process or methodology skills 14,284 31,001 40,855
As % of all permanent jobs with a WFH option 93.23% 91.62% 96.10%
Number of salaries quoted 9,786 23,546 28,388
10th Percentile £30,000 £33,759 £37,500
25th Percentile £45,000 £42,500 £47,500
Median annual salary (50th Percentile) £60,000 £57,500 £62,500
Median % change year-on-year +4.35% -8.00% +4.17%
75th Percentile £77,500 £75,000 £82,500
90th Percentile £102,500 £95,000 £100,000
UK median annual salary £57,500 £55,000 £61,500
% change year-on-year +4.55% -10.57% +2.50%

User Experience
Trend for Jobs with a WFH Option

Job vacancies with remote working options citing User Experience as a proportion of all IT jobs advertised.
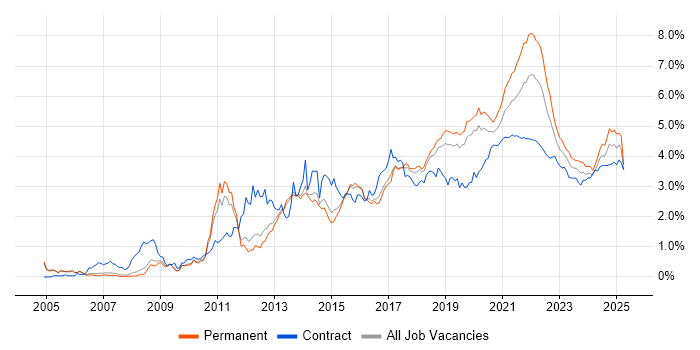
User Experience trend for jobs with Hybrid/Remote/WFH options

User Experience
Salary Trend for Jobs with a WFH Option

3-month moving average salary quoted in job vacancies with remote working options citing User Experience.

User Experience salary trend for jobs with a WFH option

User Experience
Salary Histogram for Jobs with a WFH Option

Salary distribution for jobs with remote working options citing User Experience over the 6 months to 4 May 2025.

User Experience salary histogram for jobs with a WFH option

User Experience
Co-occurring Skills and Capabilities with WFH Options by Category

The follow tables expand on the table above by listing co-occurrences grouped by category. The same employment type, locality and period is covered with up to 20 co-occurrences shown in each of the following categories:

Application Platforms
1 48 (6.40%) CMS
2 29 (3.87%) WordPress
3 18 (2.40%) Skype for Business
4 17 (2.27%) SharePoint
5 12 (1.60%) Confluence
5 12 (1.60%) Drupal
6 11 (1.47%) Microsoft Exchange
7 7 (0.93%) Apache Airflow
8 6 (0.80%) Apache
9 4 (0.53%) Umbraco
10 3 (0.40%) Apache Solr
11 2 (0.27%) Adobe Experience Manager
11 2 (0.27%) Apache Spark
11 2 (0.27%) Headless CMS
11 2 (0.27%) OpenEdge
12 1 (0.13%) ColdFusion
12 1 (0.13%) IIS
12 1 (0.13%) Jupyter
12 1 (0.13%) nginx
12 1 (0.13%) Oracle Workflow
Applications
1 22 (2.93%) Adobe XD
2 19 (2.53%) Sketch
3 16 (2.13%) Microsoft Office
4 10 (1.33%) Adobe Creative Suite
4 10 (1.33%) Microsoft Excel
4 10 (1.33%) Photoshop
4 10 (1.33%) Trello
5 7 (0.93%) Adobe Premiere
6 6 (0.80%) Adobe Illustrator
7 5 (0.67%) Microsoft PowerPoint
8 4 (0.53%) InDesign
9 3 (0.40%) InVision
9 3 (0.40%) MS Visio
10 2 (0.27%) Adobe After Effects
10 2 (0.27%) Adobe Captivate
10 2 (0.27%) Final Cut Pro
10 2 (0.27%) Microsoft Project
10 2 (0.27%) Moqups
11 1 (0.13%) Blender
11 1 (0.13%) CINEMA 4D
Business Applications
1 23 (3.07%) NetSuite
2 11 (1.47%) JDE OneWorld
3 10 (1.33%) Dynamics CRM
4 6 (0.80%) Shopify
5 3 (0.40%) Elite 3E
6 2 (0.27%) Workday HCM
7 1 (0.13%) Dynamics GP
7 1 (0.13%) Magento
7 1 (0.13%) Oracle EBS
7 1 (0.13%) Oracle EBS R12
7 1 (0.13%) Oracle Procure-to-Pay
7 1 (0.13%) Payment Gateway
7 1 (0.13%) Salesforce CRM
7 1 (0.13%) SAP ERP
Cloud Services
1 201 (26.80%) AWS
2 130 (17.33%) Azure
3 76 (10.13%) GCP
4 55 (7.33%) Figma
5 53 (7.07%) SaaS
6 40 (5.33%) Microsoft 365
7 33 (4.40%) Power Platform
8 25 (3.33%) GitHub
8 25 (3.33%) Google Analytics
9 23 (3.07%) Boomi
10 19 (2.53%) Azure DevOps
11 18 (2.40%) PowerApps
12 17 (2.27%) Serverless
13 14 (1.87%) Entra ID
14 12 (1.60%) Power Automate
15 11 (1.47%) Dynamics 365
16 9 (1.20%) Amazon SageMaker
16 9 (1.20%) AWS Lambda
16 9 (1.20%) Stripe
17 8 (1.07%) Adobe Analytics
Communications & Networking
1 18 (2.40%) Skype
1 18 (2.40%) Unified Communications
1 18 (2.40%) Wireless
2 8 (1.07%) Internet
3 4 (0.53%) Firewall
4 3 (0.40%) Broadband
4 3 (0.40%) DNS
5 2 (0.27%) DHCP
5 2 (0.27%) HTTP
5 2 (0.27%) Network Security
5 2 (0.27%) OpenVPN
5 2 (0.27%) SD-WAN
5 2 (0.27%) SMS
5 2 (0.27%) WAN
6 1 (0.13%) NetScaler
6 1 (0.13%) PSTN
6 1 (0.13%) Remote Desktop
6 1 (0.13%) SSL
6 1 (0.13%) TCP/IP
6 1 (0.13%) VPN
Database & Business Intelligence
1 54 (7.20%) PostgreSQL
2 41 (5.47%) SQL Server
3 24 (3.20%) MySQL
4 21 (2.80%) Relational Database
4 21 (2.80%) Tableau
5 18 (2.40%) Power BI
6 10 (1.33%) NoSQL
7 9 (1.20%) Data Lake
8 6 (0.80%) MongoDB
9 5 (0.67%) Elasticsearch
10 4 (0.53%) Amazon RDS
10 4 (0.53%) Apache Ignite
11 3 (0.40%) Azure SQL Database
11 3 (0.40%) Redis
12 2 (0.27%) Couchbase
12 2 (0.27%) RDBMS
12 2 (0.27%) SQL Server Integration Services
12 2 (0.27%) SQL Server Reporting Services
13 1 (0.13%) Data Warehouse
13 1 (0.13%) FileMaker
Development Applications
1 67 (8.93%) Git
1 67 (8.93%) JIRA
2 30 (4.00%) Maven
3 26 (3.47%) Cucumber
4 25 (3.33%) GitLab
5 24 (3.20%) Bitbucket
6 22 (2.93%) Selenium
7 21 (2.80%) SonarQube
7 21 (2.80%) Sonatype Nexus
7 21 (2.80%) webpack
8 15 (2.00%) Jenkins
9 11 (1.47%) Cypress.io
10 10 (1.33%) Vite
11 8 (1.07%) Axure RP
11 8 (1.07%) Babel
12 6 (0.80%) Balsamiq
13 5 (0.67%) Appium
13 5 (0.67%) rollup.js
13 5 (0.67%) Visual Studio
14 4 (0.53%) Ant
General
1 213 (28.40%) Finance
2 182 (24.27%) Social Skills
3 110 (14.67%) Banking
4 108 (14.40%) Inclusion and Diversity
5 90 (12.00%) Marketing
6 75 (10.00%) Analytical Skills
7 41 (5.47%) Front Office
7 41 (5.47%) Law
8 39 (5.20%) Retail
9 31 (4.13%) Games
10 24 (3.20%) Public Sector
11 23 (3.07%) Organisational Skills
12 21 (2.80%) Corporate Banking
12 21 (2.80%) Investment Banking
12 21 (2.80%) Publishing
13 19 (2.53%) Legal
14 18 (2.40%) Presentation Skills
15 12 (1.60%) Manufacturing
15 12 (1.60%) Pharmaceutical
16 10 (1.33%) Electronics
Job Titles
1 239 (31.87%) Developer
2 190 (25.33%) Senior
3 116 (15.47%) Software Engineer
4 67 (8.93%) Designer
5 65 (8.67%) Lead
6 59 (7.87%) Senior Developer
7 50 (6.67%) UX Designer
8 48 (6.40%) Front-End Developer (Client-Side Developer)
9 47 (6.27%) React Developer
10 46 (6.13%) Analyst
11 40 (5.33%) Senior Software Engineer
12 38 (5.07%) Developer/Software Engineer
13 29 (3.87%) Front-End Engineer (Client-Side Engineer)
14 27 (3.60%) UI Engineer
15 26 (3.47%) Senior Designer
15 26 (3.47%) Senior UX Designer
16 22 (2.93%) Full-Stack Developer
16 22 (2.93%) NetSuite Developer
16 22 (2.93%) Project Manager
17 21 (2.80%) UX Developer
Libraries, Frameworks & Software Standards
1 166 (22.13%) React
2 140 (18.67%) CSS
3 138 (18.40%) HTML
4 116 (15.47%) Node.js
5 80 (10.67%) .NET
6 75 (10.00%) RESTful
7 72 (9.60%) Redux
8 54 (7.20%) REST
9 46 (6.13%) CSS3
10 41 (5.47%) Jest
11 40 (5.33%) HTML5
12 38 (5.07%) Next.js
13 30 (4.00%) AngularJS
14 28 (3.73%) Web Services
15 26 (3.47%) Kafka
15 26 (3.47%) Spring
16 25 (3.33%) Sass
16 25 (3.33%) Vue
17 24 (3.20%) Spring Boot
18 23 (3.07%) JSON
Miscellaneous
1 84 (11.20%) Product Ownership
2 43 (5.73%) Mobile App
3 38 (5.07%) Fixed Income
3 38 (5.07%) Self-Motivation
4 32 (4.27%) Algorithms
5 31 (4.13%) Cyberattack
5 31 (4.13%) Linux Command Line
6 23 (3.07%) Enterprise Software
7 22 (2.93%) Virtual Team
8 21 (2.80%) Data Structures
8 21 (2.80%) Social Media
9 19 (2.53%) Educational Technology
10 18 (2.40%) Digital Signage
10 18 (2.40%) Video Conferencing
11 15 (2.00%) Greenfield Project
12 11 (1.47%) Learning Management System
13 10 (1.33%) Distributed Architecture
13 10 (1.33%) Mobile Games
14 9 (1.20%) Management Information System
14 9 (1.20%) Onboarding
Operating Systems
1 54 (7.20%) Linux
2 40 (5.33%) Apple iOS
3 37 (4.93%) Android
4 35 (4.67%) Windows
5 11 (1.47%) Windows Server
6 9 (1.20%) Windows 10
7 3 (0.40%) Mac OS
7 3 (0.40%) Windows 7
7 3 (0.40%) Windows 8
7 3 (0.40%) Windows Server 2012
7 3 (0.40%) Windows Server 2016
7 3 (0.40%) Windows Server 2019
8 2 (0.27%) VMS
9 1 (0.13%) CentOS
9 1 (0.13%) Debian
Processes & Methodologies
1 308 (41.07%) Agile
2 217 (28.93%) UX Design
3 167 (22.27%) Software Engineering
4 158 (21.07%) Problem-Solving
5 116 (15.47%) Mentoring
6 114 (15.20%) Front End Development
7 106 (14.13%) Project Management
8 95 (12.67%) Full-Stack Development
9 92 (12.27%) DevOps
10 90 (12.00%) User-Centered Design (UCD)
11 89 (11.87%) Analytics
11 89 (11.87%) Microservices
12 87 (11.60%) CI/CD
12 87 (11.60%) Roadmaps
13 79 (10.53%) Artificial Intelligence
14 78 (10.40%) Prototyping
15 72 (9.60%) User Research
16 69 (9.20%) Stakeholder Management
16 69 (9.20%) UX Research
16 69 (9.20%) Wireframes
Programming Languages
1 280 (37.33%) JavaScript
2 168 (22.40%) TypeScript
3 138 (18.40%) Python
4 100 (13.33%) SQL
5 91 (12.13%) Java
6 59 (7.87%) C#
7 49 (6.53%) Go
8 40 (5.33%) C++
9 33 (4.40%) Rust
10 30 (4.00%) Kotlin
11 28 (3.73%) PHP
12 19 (2.53%) PowerShell
13 18 (2.40%) Swift
14 12 (1.60%) Objective-C
15 5 (0.67%) Ruby
16 4 (0.53%) Dart
16 4 (0.53%) T-SQL
17 3 (0.40%) Perl
17 3 (0.40%) VB
17 3 (0.40%) VBA
Qualifications
1 102 (13.60%) Degree
2 48 (6.40%) Security Cleared
3 37 (4.93%) DV Cleared
4 31 (4.13%) AWS Certification
4 31 (4.13%) AWS Certified Developer
4 31 (4.13%) AWS Certified Solutions Architect
5 17 (2.27%) Computer Science Degree
5 17 (2.27%) Microsoft Certification
6 16 (2.13%) Master's Degree
7 13 (1.73%) DBS Check
8 10 (1.33%) SC Cleared
9 9 (1.20%) PhD
10 8 (1.07%) BPSS Clearance
11 5 (0.67%) CSPO
12 3 (0.40%) MCP
12 3 (0.40%) MCSE
13 2 (0.27%) ACCA
13 2 (0.27%) ISTQB
13 2 (0.27%) ISTQB Foundation Certification
13 2 (0.27%) Postgraduate
Quality Assurance & Compliance
1 165 (22.00%) Accessibility
2 89 (11.87%) QA
3 22 (2.93%) WCAG
4 6 (0.80%) GDPR
5 4 (0.53%) ISO/IEC 27001
6 3 (0.40%) 21 CFR Part 11
6 3 (0.40%) Good Clinical Practice
6 3 (0.40%) SLA
7 2 (0.27%) IEC 62304
7 2 (0.27%) ISO 13485
7 2 (0.27%) ISO 9001
8 1 (0.13%) COBIT
8 1 (0.13%) HIPAA
System Software
1 46 (6.13%) Docker
2 20 (2.67%) Active Directory
3 3 (0.40%) VMware Infrastructure
4 2 (0.27%) Firmware
4 2 (0.27%) Virtual Desktop
4 2 (0.27%) vSphere
Systems Management
1 62 (8.27%) Kubernetes
2 13 (1.73%) Terraform
3 12 (1.60%) SCCM
3 12 (1.60%) Single Sign-On
4 11 (1.47%) Microsoft Intune
5 3 (0.40%) WMI
6 2 (0.27%) Jamf Pro
7 1 (0.13%) Argo
7 1 (0.13%) Autotask
7 1 (0.13%) cPanel
7 1 (0.13%) Grafana
7 1 (0.13%) Prometheus
Vendors
1 86 (11.47%) Microsoft
2 46 (6.13%) Adobe
3 43 (5.73%) Google
4 31 (4.13%) Salesforce
5 24 (3.20%) Cisco
6 21 (2.80%) Solace
7 18 (2.40%) Mitel
7 18 (2.40%) Polycom
7 18 (2.40%) ShoreTel
8 11 (1.47%) Dell
9 10 (1.33%) MuleSoft
10 7 (0.93%) Omniture
10 7 (0.93%) SAP
11 6 (0.80%) ServiceNow
12 5 (0.67%) Citrix
13 4 (0.53%) Hotjar
13 4 (0.53%) Meraki
13 4 (0.53%) Mercator
14 3 (0.40%) OneLogin
14 3 (0.40%) Workday