Data Integration Jobs

Data Integration
UK

The table below provides summary statistics for permanent job vacancies requiring Data Integration skills. It includes a benchmarking guide to the annual salaries offered in vacancies that cited Data Integration over the 6 months leading up to 20 May 2025, comparing them to the same period in the previous two years.

6 months to
20 May 2025
Same period 2024 Same period 2023
Rank 331 341 368
Rank change year-on-year +10 +27 +46
Permanent jobs citing Data Integration 482 832 888
As % of all permanent jobs advertised in the UK 0.86% 0.83% 0.89%
As % of the Processes & Methodologies category 0.91% 0.98% 0.93%
Number of salaries quoted 236 524 571
10th Percentile £43,750 £40,500 £47,500
25th Percentile £53,000 £50,625 £56,250
Median annual salary (50th Percentile) £65,000 £67,122 £70,000
Median % change year-on-year -3.16% -4.11% -
75th Percentile £97,500 £87,000 £86,250
90th Percentile £115,000 £100,000 £105,000
UK excluding London median annual salary £62,500 £58,700 £62,500
% change year-on-year +6.47% -6.08% +12.87%

All Process and Methodology Skills
UK

Data Integration falls under the Processes and Methodologies category. For comparison with the information above, the following table provides summary statistics for all permanent job vacancies requiring process or methodology skills.

Permanent vacancies with a requirement for process or methodology skills 52,745 85,153 95,115
As % of all permanent jobs advertised in the UK 93.88% 85.20% 95.58%
Number of salaries quoted 26,622 59,851 56,203
10th Percentile £29,750 £29,079 £34,000
25th Percentile £41,250 £40,000 £45,000
Median annual salary (50th Percentile) £57,500 £55,000 £61,180
Median % change year-on-year +4.55% -10.10% +1.97%
75th Percentile £75,000 £72,500 £81,250
90th Percentile £97,500 £92,500 £100,000
UK excluding London median annual salary £51,645 £50,000 £55,000
% change year-on-year +3.29% -9.09% +4.76%

Data Integration
Job Vacancy Trend

Job postings citing Data Integration as a proportion of all IT jobs advertised.
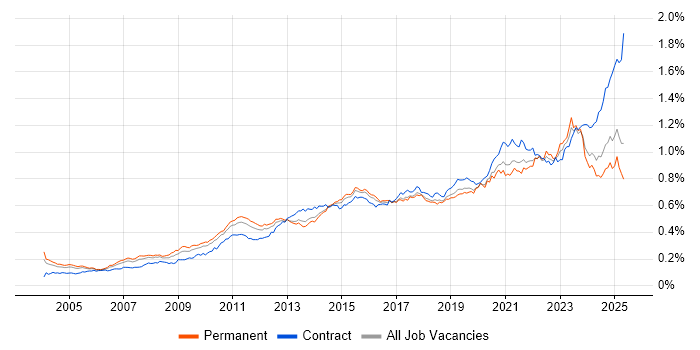
Job vacancy trend for Data Integration in the UK

Data Integration
Salary Trend

3-month moving average salary quoted in jobs citing Data Integration.

Salary trend for Data Integration in the UK

Data Integration
Salary Histogram

Salary distribution for jobs citing Data Integration over the 6 months to 20 May 2025.

Salary histogram for Data Integration in the UK

Data Integration
Top 14 Job Locations

The table below looks at the demand and provides a guide to the median salaries quoted in IT jobs citing Data Integration within the UK over the 6 months to 20 May 2025. The 'Rank Change' column provides an indication of the change in demand within each location based on the same 6 month period last year.

Location Rank Change
on Same Period
Last Year
Matching
Permanent
IT Job Ads
Median Salary
Past 6 Months
Median Salary
% Change
on Same Period
Last Year
Live
Jobs
England -24 426 £70,000 +3.70% 542
UK excluding London +28 260 £62,500 +6.47% 336
Work from Home +55 239 £70,000 +7.69% 275
London -8 182 £80,000 +6.67% 320
South East +83 94 £67,000 +48.89% 138
South West +110 52 £48,507 -11.81% 27
Midlands +13 43 £63,750 +1.35% 47
North of England -72 39 £90,000 +40.63% 60
West Midlands +18 30 £62,500 -3.85% 32
Scotland +132 23 £57,500 -11.54% 26
North West -73 23 £78,750 +31.25% 26
Yorkshire +47 16 £90,000 +80.00% 23
East Midlands +22 13 £65,000 +44.44% 14
East of England +33 9 £62,500 -43.18% 23

Data Integration
Co-occurring Skills and Capabilities by Category

The follow tables expand on the table above by listing co-occurrences grouped by category. The same employment type, locality and period is covered with up to 20 co-occurrences shown in each of the following categories:

Application Platforms
1 75 (15.56%) Oracle Application Server
2 37 (7.68%) SharePoint
3 22 (4.56%) Apache Spark
4 11 (2.28%) Apache
4 11 (2.28%) Apache Airflow
5 6 (1.24%) SAS
6 4 (0.83%) Confluence
7 3 (0.62%) Appian
8 2 (0.41%) IBM Domino
8 2 (0.41%) Oracle SOA Suite
8 2 (0.41%) Oracle Workflow
9 1 (0.21%) CMS
9 1 (0.21%) Luigi
9 1 (0.21%) NetWeaver
9 1 (0.21%) WordPress
Applications
1 16 (3.32%) Microsoft Excel
2 9 (1.87%) Microsoft PowerPoint
3 6 (1.24%) Microsoft Project
4 4 (0.83%) Maya
5 3 (0.62%) Microsoft Office
5 3 (0.62%) MS Visio
6 1 (0.21%) Acrobat
6 1 (0.21%) Blender
Business Applications
1 39 (8.09%) Dynamics CRM
2 5 (1.04%) Elite 3E
3 3 (0.62%) NetSuite
3 3 (0.62%) SAP S/4HANA
4 2 (0.41%) Carpe Diem
4 2 (0.41%) Dynamics AX
4 2 (0.41%) Dynamics NAV
4 2 (0.41%) SAP MDG
5 1 (0.21%) Adobe Campaign
5 1 (0.21%) Lorenzo
5 1 (0.21%) Oracle Applications
5 1 (0.21%) Oracle EBS
5 1 (0.21%) Oracle ERP
5 1 (0.21%) Sage 1000
5 1 (0.21%) Salesforce CRM
5 1 (0.21%) SAP ERP
5 1 (0.21%) SystmOne
Cloud Services
1 221 (45.85%) Azure
2 159 (32.99%) Power Platform
3 87 (18.05%) AWS
4 73 (15.15%) Power Automate
5 59 (12.24%) PowerApps
6 51 (10.58%) Dynamics 365
7 45 (9.34%) Azure DevOps
8 42 (8.71%) GCP
9 40 (8.30%) Azure Data Factory
10 39 (8.09%) Snowflake
11 34 (7.05%) SaaS
12 29 (6.02%) Azure Service Bus
13 24 (4.98%) Azure Logic Apps
13 24 (4.98%) Azure Synapse Analytics
14 23 (4.77%) Azure AI
15 20 (4.15%) Serverless
16 17 (3.53%) Azure Monitor
16 17 (3.53%) Entra ID
16 17 (3.53%) PaaS
17 16 (3.32%) IaaS
Communications & Networking
1 17 (3.53%) Firewall
2 16 (3.32%) DNS
2 16 (3.32%) SD-WAN
2 16 (3.32%) VPN
2 16 (3.32%) WAN
3 6 (1.24%) LoRaWAN
4 1 (0.21%) SAN
4 1 (0.21%) VoIP
Database & Business Intelligence
1 157 (32.57%) Data Warehouse
2 137 (28.42%) Power BI
3 85 (17.63%) Data Lake
4 83 (17.22%) Oracle Reports
5 80 (16.60%) Enterprise Data Warehouse
6 65 (13.49%) SQL Server
7 59 (12.24%) Tableau
8 45 (9.34%) SQL Server Integration Services
9 44 (9.13%) Big Data
10 35 (7.26%) Metadata
11 31 (6.43%) SQL Server Reporting Services
12 23 (4.77%) MySQL
12 23 (4.77%) NoSQL
13 20 (4.15%) Amazon Redshift
14 18 (3.73%) Hadoop
15 16 (3.32%) Relational Database
16 14 (2.90%) Azure SQL Database
17 11 (2.28%) BigQuery
18 9 (1.87%) IBM InfoSphere
18 9 (1.87%) SQL Server Analysis Services
Development Applications
1 31 (6.43%) Git
2 14 (2.90%) JIRA
2 14 (2.90%) Visual Studio
3 3 (0.62%) Oracle Forms
3 3 (0.62%) Robot Framework
3 3 (0.62%) Selenium
3 3 (0.62%) Snyk
3 3 (0.62%) SQL Server Management Studio (SSMS)
4 2 (0.41%) ERwin
4 2 (0.41%) Team Foundation Server
4 2 (0.41%) Visual Studio Code
5 1 (0.21%) Atlassian Bamboo
5 1 (0.21%) Bitbucket
5 1 (0.21%) Jenkins
5 1 (0.21%) LSMW
5 1 (0.21%) MLflow
General
1 220 (45.64%) Social Skills
2 183 (37.97%) Finance
3 176 (36.51%) Analytical Skills
4 83 (17.22%) Law
5 76 (15.77%) Organisational Skills
6 75 (15.56%) Military
7 52 (10.79%) Marketing
8 32 (6.64%) Legal
9 30 (6.22%) Inclusion and Diversity
10 21 (4.36%) Retail
11 19 (3.94%) Public Sector
12 16 (3.32%) Presentation Skills
13 15 (3.11%) Banking
14 12 (2.49%) Back Office
15 6 (1.24%) Games
16 5 (1.04%) Front Office
16 5 (1.04%) Influencing Skills
16 5 (1.04%) Manufacturing
17 4 (0.83%) Advertising
17 4 (0.83%) Financial Institution
Job Titles
1 94 (19.50%) Architect
2 92 (19.09%) Lead
3 73 (15.15%) Senior
4 54 (11.20%) Developer
5 53 (11.00%) Data Engineer
6 28 (5.81%) Senior Manager
7 26 (5.39%) Solutions Architect
8 25 (5.19%) Database Engineer
9 24 (4.98%) Data Architect
9 24 (4.98%) Lead Architect
10 22 (4.56%) Data Manager
11 20 (4.15%) Analyst
11 20 (4.15%) Cloud Architect
12 12 (2.49%) Consultant
12 12 (2.49%) Senior Data Warehouse Specialist
13 11 (2.28%) Development Manager
14 10 (2.07%) Applications Manager
14 10 (2.07%) Integration Developer
15 9 (1.87%) Applications Development Manager
15 9 (1.87%) Business Intelligence Developer
Libraries, Frameworks & Software Standards
1 39 (8.09%) .NET
2 28 (5.81%) XML
3 23 (4.77%) JSON
4 22 (4.56%) .NET Framework
4 22 (4.56%) HTML
5 19 (3.94%) CSS
6 15 (3.11%) Web Services
7 14 (2.90%) REST
8 13 (2.70%) ASP.NET Web API
8 13 (2.70%) Kafka
8 13 (2.70%) SOAP
9 10 (2.07%) PySpark
10 8 (1.66%) WCF
11 7 (1.45%) RESTful
12 5 (1.04%) Oracle Fusion
13 4 (0.83%) Middleware
14 3 (0.62%) Apache NiFi
14 3 (0.62%) EDI
14 3 (0.62%) Gherkin
14 3 (0.62%) YAML
Miscellaneous
1 38 (7.88%) Management Information System
2 22 (4.56%) Cloud Native
3 19 (3.94%) Legacy Systems
4 17 (3.53%) NHS
5 16 (3.32%) Data Centre
5 16 (3.32%) Taxonomies
6 15 (3.11%) Data Structures
7 14 (2.90%) Product Ownership
8 10 (2.07%) Data Protection Act
8 10 (2.07%) Enterprise Software
8 10 (2.07%) IoT
8 10 (2.07%) Self-Motivation
9 9 (1.87%) Replication
10 8 (1.66%) Distributed Systems
11 7 (1.45%) Credit Risk
12 6 (1.24%) Driving Licence
12 6 (1.24%) NB-IoT
12 6 (1.24%) Smart City
12 6 (1.24%) Smart Meter
13 5 (1.04%) Market Risk
Operating Systems
1 5 (1.04%) Linux
2 3 (0.62%) Unix
2 3 (0.62%) Windows
3 2 (0.41%) Android
3 2 (0.41%) Apple iOS
4 1 (0.21%) Mac OS
4 1 (0.21%) Windows Server
Processes & Methodologies
1 253 (52.49%) Analytics
2 212 (43.98%) Agile
3 207 (42.95%) Data Management
4 180 (37.34%) Data Modelling
5 161 (33.40%) DevOps
6 151 (31.33%) Business Intelligence
7 128 (26.56%) ETL
8 127 (26.35%) Problem-Solving
9 123 (25.52%) Data Governance
9 123 (25.52%) Service Management
10 106 (21.99%) Migration
11 100 (20.75%) ITIL
12 92 (19.09%) Data Engineering
13 87 (18.05%) Business Analysis
14 86 (17.84%) Customer Experience
15 80 (16.60%) CI/CD
15 80 (16.60%) Project Management
16 79 (16.39%) Data Science
17 77 (15.98%) Artificial Intelligence
18 69 (14.32%) Continuous Improvement
Programming Languages
1 168 (34.85%) SQL
2 71 (14.73%) Python
3 42 (8.71%) C#
4 32 (6.64%) PowerShell
5 28 (5.81%) JavaScript
6 23 (4.77%) T-SQL
7 20 (4.15%) Java
8 16 (3.32%) Bicep
9 11 (2.28%) R
9 11 (2.28%) Scala
9 11 (2.28%) TypeScript
10 5 (1.04%) PL/SQL
11 4 (0.83%) Data Analysis Expressions
12 3 (0.62%) SPARQL
13 1 (0.21%) Apex Code
13 1 (0.21%) Bash
13 1 (0.21%) C
13 1 (0.21%) C++
13 1 (0.21%) COBOL
13 1 (0.21%) VB.NET
Qualifications
1 98 (20.33%) Degree
2 94 (19.50%) DBS Check
3 33 (6.85%) Computer Science Degree
4 31 (6.43%) Azure Certification
5 20 (4.15%) Security Cleared
6 17 (3.53%) Master's Degree
7 13 (2.70%) SC Cleared
8 11 (2.28%) Microsoft Certification
9 8 (1.66%) TOGAF Certification
10 7 (1.45%) PMI Certification
10 7 (1.45%) PMP
11 6 (1.24%) AWS Certification
12 4 (0.83%) SAP Certification
13 2 (0.41%) AWS Certified Solutions Architect
13 2 (0.41%) BPSS Clearance
13 2 (0.41%) CITP
13 2 (0.41%) DV Cleared
13 2 (0.41%) PRINCE2 Practitioner
14 1 (0.21%) Numerate Degree
14 1 (0.21%) Tableau Certification
Quality Assurance & Compliance
1 119 (24.69%) Data Quality
2 31 (6.43%) GDPR
3 23 (4.77%) Accessibility
4 8 (1.66%) QA
5 6 (1.24%) PCI DSS
5 6 (1.24%) SLA
6 5 (1.04%) Basel II
6 5 (1.04%) Basel III
6 5 (1.04%) Dodd-Frank
6 5 (1.04%) IFRS
6 5 (1.04%) IFRS 9
7 3 (0.62%) HIPAA
8 2 (0.41%) California Consumer Privacy Act
8 2 (0.41%) ISO/IEC 27001
9 1 (0.21%) Actionable Recommendations
9 1 (0.21%) DICOM
9 1 (0.21%) HL7
9 1 (0.21%) Sarbanes-Oxley
9 1 (0.21%) SNOMED CT
System Software
1 17 (3.53%) Virtual Machines
2 6 (1.24%) Docker
3 5 (1.04%) HDFS
4 2 (0.41%) VMware Infrastructure
5 1 (0.21%) Active Directory
Systems Management
1 16 (3.32%) Single Sign-On
2 8 (1.66%) Terraform
3 5 (1.04%) Kubernetes
4 4 (0.83%) Matomo
5 3 (0.62%) Ansible
6 2 (0.41%) Systems Management Server (SMS)
7 1 (0.21%) Argo
7 1 (0.21%) Oracle RMAN
Vendors
1 142 (29.46%) Microsoft
2 115 (23.86%) Oracle
3 57 (11.83%) Databricks
4 36 (7.47%) ServiceNow
5 35 (7.26%) Google
6 27 (5.60%) Informatica
7 24 (4.98%) SAP
8 16 (3.32%) Meraki
9 12 (2.49%) IBM
10 11 (2.28%) Siebel
11 10 (2.07%) Teradata
12 9 (1.87%) Salesforce
13 7 (1.45%) Adobe
14 6 (1.24%) Workday
15 5 (1.04%) Intapp
16 4 (0.83%) Foundry
16 4 (0.83%) Palantir
16 4 (0.83%) Talend
16 4 (0.83%) TikTok
16 4 (0.83%) VMware