Disclosure and Barring Service (DBS) Checks
UK

The following table provides summary statistics for permanent job vacancies with a requirement for DBS Check qualifications. Included is a benchmarking guide to the salaries offered over the 6 months to 8 May 2024 with a comparison to the same period in the previous 2 years.

6 months to
8 May 2024
Same period 2023 Same period 2022
Rank 161 374 537
Rank change year-on-year +213 +163 +46
Permanent jobs citing DBS Check 1,795 901 994
As % of all permanent jobs advertised in the UK 1.81% 0.89% 0.63%
As % of the Qualifications category 6.53% 2.72% 2.35%
Number of salaries quoted 1,097 245 402
10th Percentile £24,196 £24,636 £25,733
25th Percentile £27,965 £30,265 £29,750
Median annual salary (50th Percentile) £35,000 £41,500 £40,500
Median % change year-on-year -15.66% +2.47% +1.25%
75th Percentile £48,317 £55,000 £53,438
90th Percentile £61,250 £69,649 £72,375
UK excluding London median annual salary £35,000 £42,500 £40,455
% change year-on-year -17.65% +5.05% +15.59%

All Academic and Professional Certifications
UK

DBS Check is in the Academic Qualifications and Professional Certifications category. The following table is for comparison with the above and provides summary statistics for all permanent job vacancies with a requirement for academic qualifications or professional certifications.

Permanent vacancies requiring academic qualifications or professional certifications 27,491 33,185 42,304
As % of all permanent jobs advertised in the UK 27.72% 32.68% 26.87%
Number of salaries quoted 17,282 14,890 18,866
10th Percentile £28,254 £31,250 £31,000
25th Percentile £38,500 £41,750 £41,250
Median annual salary (50th Percentile) £54,000 £59,500 £55,000
Median % change year-on-year -9.24% +8.18% -
75th Percentile £71,000 £77,500 £73,750
90th Percentile £87,500 £95,000 £92,500
UK excluding London median annual salary £50,000 £51,350 £50,000
% change year-on-year -2.63% +2.70% +1.01%

DBS Check
Job Vacancy Trend

Job postings citing DBS Check as a proportion of all IT jobs advertised.
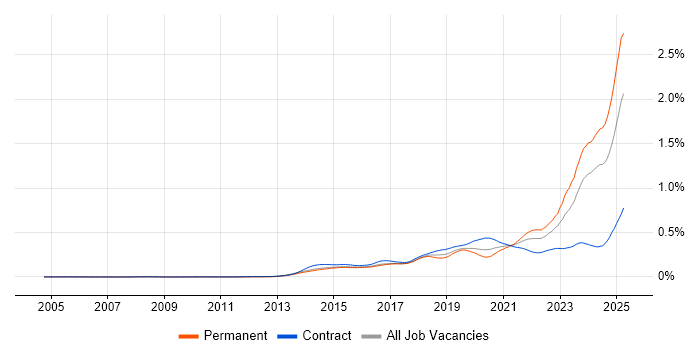
Job vacancy trend for DBS Check in the UK

DBS Check
Salary Trend

3-month moving average salary quoted in jobs citing DBS Check.

Salary trend for DBS Check in the UK

DBS Check
Salary Histogram

Salary distribution for jobs citing DBS Check over the 6 months to 8 May 2024.

Salary histogram for DBS Check in the UK

DBS Check
Top 17 Job Locations

The table below looks at the demand and provides a guide to the median salaries quoted in IT jobs citing DBS Check within the UK over the 6 months to 8 May 2024. The 'Rank Change' column provides an indication of the change in demand within each location based on the same 6 month period last year.

Location Rank Change
on Same Period
Last Year
Matching
Permanent
IT Job Ads
Median Salary
Past 6 Months
Median Salary
% Change
on Same Period
Last Year
Live
Jobs
England +226 1,706 £35,000 -12.50% 1,478
UK excluding London +105 1,070 £35,000 -17.65% 1,214
London +352 666 £37,934 +20.42% 334
Work from Home +148 623 £45,000 +1.12% 319
South East +98 424 £39,870 +15.87% 251
North of England +50 214 £32,500 -29.35% 317
Midlands +79 202 £32,882 -27.30% 249
East Midlands +62 112 £34,917 +7.44% 108
South West +66 105 £30,000 -20.00% 165
North West +39 100 £31,000 -32.61% 160
Yorkshire +64 95 £32,500 -26.71% 121
West Midlands +24 90 £30,150 -40.30% 141
East of England +13 81 £37,528 +44.34% 172
Scotland -48 37 £39,500 -41.05% 21
North East -2 19 £39,000 -18.19% 39
Wales -2 9 £35,000 -39.13% 46
Northern Ireland - 2 - - 1

DBS Check
Co-occurring Skills and Capabilities by Category

The follow tables expand on the table above by listing co-occurrences grouped by category. The same employment type, locality and period is covered with up to 20 co-occurrences shown in each of the following categories:

Application Platforms
1 39 (2.17%) SharePoint
2 23 (1.28%) Microsoft Exchange
3 10 (0.56%) Confluence
4 6 (0.33%) Apache Spark
4 6 (0.33%) WordPress
5 3 (0.17%) Apache
5 3 (0.17%) CMS
5 3 (0.17%) IIS
6 1 (0.056%) Drupal
6 1 (0.056%) Moodle
6 1 (0.056%) nginx
6 1 (0.056%) SAS
Applications
1 325 (18.11%) Microsoft Excel
2 215 (11.98%) Microsoft PowerPoint
3 211 (11.75%) Microsoft Office
4 98 (5.46%) Spreadsheet
5 12 (0.67%) Microsoft Project
6 7 (0.39%) MS Visio
7 4 (0.22%) AutoCAD
8 3 (0.17%) Photoshop
9 2 (0.11%) Adobe Creative Suite
9 2 (0.11%) Adobe Illustrator
9 2 (0.11%) LaTeX
Business Applications
1 10 (0.56%) NEC Housing
2 9 (0.50%) Primavera
3 6 (0.33%) Salesforce CRM
3 6 (0.33%) SAP PLM
3 6 (0.33%) Teamcenter
4 4 (0.22%) Raiser’s Edge
4 4 (0.22%) Visualfiles
5 3 (0.17%) iTrent
5 3 (0.17%) Unit4 Business World
6 2 (0.11%) Dynamics CRM
6 2 (0.11%) Elite 3E
6 2 (0.11%) NetSuite
6 2 (0.11%) Shopify
6 2 (0.11%) SystmOne
7 1 (0.056%) ContrOCC
7 1 (0.056%) Dynamics AX
7 1 (0.056%) Oracle ERP
7 1 (0.056%) SAP S/4HANA
Cloud Services
1 236 (13.15%) Azure
2 183 (10.19%) Microsoft 365
3 170 (9.47%) Power Platform
4 167 (9.30%) AWS
5 39 (2.17%) Serverless
6 36 (2.01%) Azure Data Factory
7 34 (1.89%) AWS Lambda
8 32 (1.78%) Google Workspace
9 29 (1.62%) Azure Synapse Analytics
10 24 (1.34%) Azure DevOps
11 20 (1.11%) GCP
12 17 (0.95%) Entra ID
13 16 (0.89%) Dynamics 365
14 12 (0.67%) Cloud Computing
15 11 (0.61%) Google Analytics
15 11 (0.61%) SaaS
16 10 (0.56%) IaaS
17 9 (0.50%) Asana
17 9 (0.50%) Google Tag Manager
17 9 (0.50%) PaaS
Communications & Networking
1 61 (3.40%) Wireless
2 48 (2.67%) DNS
2 48 (2.67%) TCP/IP
3 44 (2.45%) DHCP
3 44 (2.45%) LAN
4 40 (2.23%) WAN
5 38 (2.12%) Firewall
6 34 (1.89%) Network Security
7 27 (1.50%) VoIP
8 26 (1.45%) Wi-Fi
9 23 (1.28%) Internet
10 16 (0.89%) Broadband
11 11 (0.61%) Structured Cabling
11 11 (0.61%) VLAN
11 11 (0.61%) VPN
12 8 (0.45%) Intranet
13 7 (0.39%) SMS
14 6 (0.33%) SAN
15 4 (0.22%) F5 BIG-IP LTM
15 4 (0.22%) Fibre Channel
Database & Business Intelligence
1 162 (9.03%) Tableau
2 159 (8.86%) Power BI
3 57 (3.18%) SQL Server Integration Services
4 50 (2.79%) Data Warehouse
5 43 (2.40%) SQL Server
6 39 (2.17%) SQL Server Reporting Services
7 31 (1.73%) SQL Server Analysis Services
8 29 (1.62%) Amazon RDS
9 26 (1.45%) DynamoDB
10 18 (1.00%) Enterprise Data Warehouse
11 12 (0.67%) Azure SQL Data Warehouse
12 11 (0.61%) Big Data
12 11 (0.61%) Data Lake
13 10 (0.56%) Power Query
14 9 (0.50%) Oracle Reports
15 7 (0.39%) BigQuery
15 7 (0.39%) Looker
15 7 (0.39%) MySQL
16 6 (0.33%) Azure SQL Database
17 5 (0.28%) Amazon Aurora
Development Applications
1 176 (9.81%) Git
2 29 (1.62%) GitLab
3 14 (0.78%) JIRA
4 4 (0.22%) Katalon Studio
4 4 (0.22%) Postman
4 4 (0.22%) Rational DOORS
5 3 (0.17%) Hudson
5 3 (0.17%) Visual Studio
6 2 (0.11%) Apache Continuum
6 2 (0.11%) gulp
6 2 (0.11%) JMeter
6 2 (0.11%) Oracle Forms
6 2 (0.11%) Rational Rhapsody
7 1 (0.056%) Bugzilla
7 1 (0.056%) fastlane
7 1 (0.056%) Gradle
7 1 (0.056%) Jenkins
7 1 (0.056%) Selenium
7 1 (0.056%) SQL Server Management Studio (SSMS)
7 1 (0.056%) Visual Studio Code
General
1 1,017 (56.66%) Social Skills
2 473 (26.35%) Analytical Skills
3 470 (26.18%) Retail
4 268 (14.93%) Finance
5 245 (13.65%) German Language
6 182 (10.14%) Inclusion and Diversity
7 151 (8.41%) Organisational Skills
8 147 (8.19%) Marketing
9 137 (7.63%) Presentation Skills
10 131 (7.30%) Public Sector
11 59 (3.29%) Advertising
12 52 (2.90%) Legal
13 47 (2.62%) Local Government
14 42 (2.34%) Games
15 34 (1.89%) Telecoms
16 31 (1.73%) Aerospace
17 30 (1.67%) Police
18 22 (1.23%) Pharmaceutical
19 19 (1.06%) Billing
19 19 (1.06%) Fire and Rescue
Job Titles
1 239 (13.31%) Graduate
2 219 (12.20%) Senior
3 183 (10.19%) Analyst
4 120 (6.69%) Data Analyst
5 115 (6.41%) Lead
6 85 (4.74%) IT Support
7 82 (4.57%) Senior Analyst
8 80 (4.46%) Developer
9 75 (4.18%) Senior Data Analyst
10 73 (4.07%) Support Engineer
11 69 (3.84%) IT Engineer
12 65 (3.62%) IT Technician
13 51 (2.84%) Administrator
14 48 (2.67%) Coordinator
15 47 (2.62%) IT Support Engineer
16 45 (2.51%) Consultant
17 44 (2.45%) Field Engineer
18 43 (2.40%) IT Manager
19 41 (2.28%) Data Scientist
20 40 (2.23%) Senior Data Scientist
Libraries, Frameworks & Software Standards
1 42 (2.34%) .NET
1 42 (2.34%) PySpark
2 40 (2.23%) Pandas
2 40 (2.23%) scikit-learn
2 40 (2.23%) TensorFlow
3 33 (1.84%) EDI
4 31 (1.73%) GraphQL
5 29 (1.62%) Django
6 26 (1.45%) RESTful
7 21 (1.17%) CSS
8 16 (0.89%) .NET Core
8 16 (0.89%) React
9 15 (0.84%) Web Services
10 12 (0.67%) HTML
11 6 (0.33%) .NET Framework
11 6 (0.33%) AngularJS
11 6 (0.33%) REST
11 6 (0.33%) XML
12 5 (0.28%) Entity Framework
12 5 (0.28%) Laravel
Miscellaneous
1 326 (18.16%) Self-Motivation
2 293 (16.32%) Driving Licence
3 108 (6.02%) Management Information System
4 85 (4.74%) Social Media
5 63 (3.51%) Analytical Mindset
6 61 (3.40%) NHS
7 60 (3.34%) Photography
8 51 (2.84%) Onboarding
9 47 (2.62%) Algorithms
10 27 (1.50%) CCTV
11 26 (1.45%) Data Centre
12 20 (1.11%) e-Learning
13 15 (0.84%) Educational Technology
14 14 (0.78%) Renewable Energy
15 12 (0.67%) Learning Management System
16 10 (0.56%) Data Structures
17 9 (0.50%) PKI
18 8 (0.45%) Video\Live Streaming
19 7 (0.39%) Hybrid Cloud
19 7 (0.39%) VLE
Operating Systems
1 248 (13.82%) Windows
2 96 (5.35%) Windows Server
3 68 (3.79%) Windows 10
4 46 (2.56%) Windows Server 2019
5 44 (2.45%) Mac OS
6 43 (2.40%) Windows Server 2016
7 29 (1.62%) Windows Server 2012
8 19 (1.06%) Windows 7
9 17 (0.95%) Android
9 17 (0.95%) Apple iOS
10 12 (0.67%) Linux
11 9 (0.50%) Windows 8
12 6 (0.33%) Windows Vista
13 2 (0.11%) Unix
14 1 (0.056%) Red Hat Enterprise Linux
14 1 (0.056%) Windows Server 2003
Processes & Methodologies
1 450 (25.07%) Problem-Solving
2 318 (17.72%) Customer Service
3 192 (10.70%) Visualisation
4 191 (10.64%) Mathematics
5 187 (10.42%) Customer Insight
6 176 (9.81%) Actionable Insight
7 169 (9.42%) Analytics
8 165 (9.19%) Storytelling
9 161 (8.97%) Business Intelligence
10 155 (8.64%) Data Analysis
10 155 (8.64%) Root Cause Analysis
11 152 (8.47%) Agile
12 148 (8.25%) Statistics
13 145 (8.08%) Data Pipeline
14 142 (7.91%) Line Management
15 140 (7.80%) Project Management
16 128 (7.13%) Stakeholder Engagement
17 120 (6.69%) Business Strategy
17 120 (6.69%) Stakeholder Management
18 112 (6.24%) Decision-Making
Programming Languages
1 332 (18.50%) SQL
2 203 (11.31%) Python
3 59 (3.29%) C#
4 35 (1.95%) Data Analysis Expressions
5 30 (1.67%) PowerShell
6 22 (1.23%) JavaScript
7 19 (1.06%) Java
8 16 (0.89%) TypeScript
9 14 (0.78%) T-SQL
10 12 (0.67%) VBA
11 6 (0.33%) PHP
12 5 (0.28%) VB
13 4 (0.22%) C++
13 4 (0.22%) Groovy
14 3 (0.17%) MATLAB
15 2 (0.11%) C
15 2 (0.11%) FoxPro (VFP)
15 2 (0.11%) JSX
15 2 (0.11%) R
15 2 (0.11%) Scala
Qualifications
1 639 (35.60%) Degree
2 75 (4.18%) Microsoft Certification
3 72 (4.01%) Security Cleared
4 56 (3.12%) Master's Degree
5 45 (2.51%) MCP
6 44 (2.45%) A+ Certification
7 38 (2.12%) Computer Science Degree
8 35 (1.95%) BPSS Clearance
9 28 (1.56%) SC Cleared
10 25 (1.39%) CIPD
10 25 (1.39%) Cisco Certification
11 15 (0.84%) CCNP
11 15 (0.84%) Network+ Certification
12 12 (0.67%) ITIL Certification
13 10 (0.56%) CISSP
14 9 (0.50%) CCNA
14 9 (0.50%) CEH
15 8 (0.45%) APMG
15 8 (0.45%) PMI Certification
15 8 (0.45%) PMP
Quality Assurance & Compliance
1 143 (7.97%) GDPR
2 58 (3.23%) QA
3 25 (1.39%) SLA
4 21 (1.17%) Cyber Essentials
5 15 (0.84%) Data Quality
6 12 (0.67%) ISO/IEC 27001
7 9 (0.50%) Accessibility
8 8 (0.45%) Disclosure Scotland
8 8 (0.45%) PCI DSS
9 7 (0.39%) Cyber Essentials PLUS
9 7 (0.39%) PMO
10 5 (0.28%) NEBOSH
11 3 (0.17%) NCSC
11 3 (0.17%) NIST
12 1 (0.056%) IEC 61508
System Software
1 159 (8.86%) Active Directory
2 35 (1.95%) VMware Infrastructure
3 21 (1.17%) Hyper-V
4 14 (0.78%) Virtual Servers
5 10 (0.56%) Virtual Machines
5 10 (0.56%) vSphere
6 4 (0.22%) Docker
6 4 (0.22%) Microsoft Virtual Server
6 4 (0.22%) Terminal Services
6 4 (0.22%) VMware Server
7 3 (0.17%) Virtual Desktop
8 2 (0.11%) KVM
8 2 (0.11%) XenApp
8 2 (0.11%) XenDesktop
Systems Management
1 26 (1.45%) SCCM
2 14 (0.78%) Microsoft Intune
3 8 (0.45%) Autotask
4 6 (0.33%) Jamf Pro
5 5 (0.28%) PaperCut
6 4 (0.22%) Active Directory Federation Services
6 4 (0.22%) Microsoft Clustering
6 4 (0.22%) SCOM
6 4 (0.22%) SmoothWall
6 4 (0.22%) WSUS
7 3 (0.17%) Consul
7 3 (0.17%) FortiGate
7 3 (0.17%) Packer
7 3 (0.17%) Terraform
8 2 (0.11%) Ansible
8 2 (0.11%) EMC NetWorker
8 2 (0.11%) Rundeck
9 1 (0.056%) HP Quality Center
9 1 (0.056%) MobiControl
Vendors
1 497 (27.69%) Microsoft
2 162 (9.03%) Databricks
3 70 (3.90%) Google
4 46 (2.56%) Apple
5 37 (2.06%) VMware
6 30 (1.67%) ServiceNow
6 30 (1.67%) Thales
7 26 (1.45%) Sun
8 23 (1.28%) Cisco
9 20 (1.11%) Oracle
10 19 (1.06%) HP
11 12 (0.67%) Salesforce
12 11 (0.61%) Aruba
12 11 (0.61%) Datto
12 11 (0.61%) Meraki
12 11 (0.61%) Veeam
13 10 (0.56%) Adobe
13 10 (0.56%) NEC
14 9 (0.50%) SAP
15 8 (0.45%) Sage