GDPR Jobs with Hybrid/Remote/WFH Options

General Data Protection Regulation EU 2016/679 (GDPR)
UK > Work from Home

The table below provides summary statistics for permanent remote or hybrid work requiring GDPR skills. It includes a benchmarking guide to the annual salaries offered in vacancies that cited GDPR over the 6 months leading up to 28 May 2025, comparing them to the same period in the previous two years.

6 months to
28 May 2025
Same period 2024 Same period 2023
Rank 212 287 256
Rank change year-on-year +75 -31 +22
Permanent jobs citing GDPR 300 366 538
As % of all permanent jobs with a WFH option 1.61% 1.07% 1.34%
As % of the Quality Assurance & Compliance category 9.56% 8.52% 9.24%
Number of salaries quoted 227 312 286
10th Percentile £41,250 £28,250 £37,519
25th Percentile £52,500 £37,500 £46,250
Median annual salary (50th Percentile) £62,500 £50,000 £55,000
Median % change year-on-year +25.00% -9.09% -8.33%
75th Percentile £83,750 £72,813 £71,406
90th Percentile £99,584 £90,000 £95,000
UK median annual salary £63,500 £47,000 £55,000
% change year-on-year +35.11% -14.55% -4.35%

All Quality Assurance and Compliance Skills
Work from Home

GDPR falls under the Quality Assurance and Compliance category. For comparison with the information above, the following table provides summary statistics for all permanent job vacancies with remote or hybrid options requiring quality assurance or compliance skills.

Permanent vacancies with a requirement for quality assurance or compliance skills 3,138 4,294 5,823
As % of all permanent jobs with a WFH option 16.85% 12.56% 14.55%
Number of salaries quoted 1,722 3,233 3,924
10th Percentile £36,275 £34,781 £36,250
25th Percentile £48,750 £42,500 £45,690
Median annual salary (50th Percentile) £65,000 £57,500 £60,000
Median % change year-on-year +13.04% -4.17% +5.26%
75th Percentile £75,000 £73,750 £77,500
90th Percentile £92,500 £95,000 £92,500
UK median annual salary £60,000 £52,500 £57,500
% change year-on-year +14.29% -8.70% +4.55%

GDPR
Trend for Jobs with a WFH Option

Job vacancies with remote working options citing GDPR as a proportion of all IT jobs advertised.
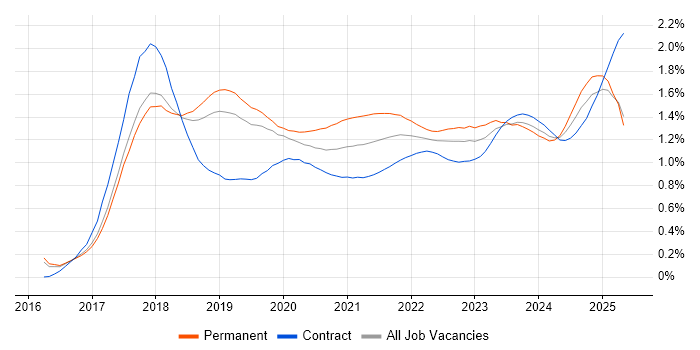
GDPR trend for jobs with Hybrid/Remote/WFH options

GDPR
Salary Trend for Jobs with a WFH Option

3-month moving average salary quoted in job vacancies with remote working options citing GDPR.

GDPR salary trend for jobs with a WFH option

GDPR
Salary Histogram for Jobs with a WFH Option

Salary distribution for jobs with remote working options citing GDPR over the 6 months to 28 May 2025.

GDPR salary histogram for jobs with a WFH option

GDPR
Co-occurring Skills and Capabilities with WFH Options by Category

The follow tables expand on the table above by listing co-occurrences grouped by category. The same employment type, locality and period is covered with up to 20 co-occurrences shown in each of the following categories:

Application Platforms
1 15 (5.00%) SharePoint
2 11 (3.67%) Microsoft Exchange
3 6 (2.00%) Apache Spark
3 6 (2.00%) CMS
3 6 (2.00%) Moodle
4 4 (1.33%) SAS
5 3 (1.00%) WordPress
6 2 (0.67%) Drupal
7 1 (0.33%) Apache
7 1 (0.33%) Apache Airflow
7 1 (0.33%) Confluence
7 1 (0.33%) OpenEdge
7 1 (0.33%) SharePoint Server
7 1 (0.33%) Umbraco
Applications
1 23 (7.67%) Microsoft Office
2 9 (3.00%) Microsoft Excel
3 8 (2.67%) Acrobat
4 3 (1.00%) Microsoft PowerPoint
4 3 (1.00%) Spreadsheet
5 2 (0.67%) MS Visio
5 2 (0.67%) Trello
Business Applications
1 13 (4.33%) SAP HCM
1 13 (4.33%) SAP HR
1 13 (4.33%) SAP Payroll
1 13 (4.33%) SAP S/4HANA
2 4 (1.33%) Raiser’s Edge
2 4 (1.33%) Salesforce CRM
3 3 (1.00%) Dynamics CRM
4 1 (0.33%) CiviCRM
4 1 (0.33%) Dynamics GP
4 1 (0.33%) iTrent
Cloud Services
1 89 (29.67%) Azure
2 53 (17.67%) AWS
3 37 (12.33%) Microsoft 365
4 31 (10.33%) Power Platform
5 26 (8.67%) Azure DevOps
5 26 (8.67%) GCP
6 22 (7.33%) Azure Cosmos DB
6 22 (7.33%) Azure Service Bus
6 22 (7.33%) SonarCloud
7 18 (6.00%) SuccessFactors
8 15 (5.00%) Serverless
9 14 (4.67%) AWS CloudFormation
9 14 (4.67%) AWS Lambda
10 12 (4.00%) AWS KMS
11 9 (3.00%) Azure Sentinel
11 9 (3.00%) Entra ID
11 9 (3.00%) Google Workspace
12 8 (2.67%) Google Analytics
12 8 (2.67%) Power Automate
13 7 (2.33%) Snowflake
Communications & Networking
1 31 (10.33%) Firewall
2 23 (7.67%) Network Security
3 11 (3.67%) VPN
4 8 (2.67%) Intranet
5 6 (2.00%) Intrusion Detection
5 6 (2.00%) NAS
5 6 (2.00%) SAN
6 4 (1.33%) LAN
6 4 (1.33%) WAN
7 3 (1.00%) DNS
7 3 (1.00%) SSL
7 3 (1.00%) VLAN
7 3 (1.00%) Wi-Fi
8 2 (0.67%) Broadband
8 2 (0.67%) DHCP
8 2 (0.67%) S/MIME
8 2 (0.67%) TCP/IP
8 2 (0.67%) X.509
9 1 (0.33%) Internet
9 1 (0.33%) OSPF
Database & Business Intelligence
1 30 (10.00%) Power BI
2 23 (7.67%) Elasticsearch
3 16 (5.33%) Data Warehouse
3 16 (5.33%) NoSQL
3 16 (5.33%) SQL Server
4 8 (2.67%) Metadata
5 7 (2.33%) Tableau
6 6 (2.00%) Big Data
6 6 (2.00%) Relational Database
7 5 (1.67%) MySQL
7 5 (1.67%) SQL Server Integration Services
7 5 (1.67%) SQL Server Reporting Services
8 3 (1.00%) Hadoop
8 3 (1.00%) QlikView
9 2 (0.67%) Amazon Redshift
9 2 (0.67%) Data Lake
9 2 (0.67%) Metadata Repository
9 2 (0.67%) PostgreSQL
10 1 (0.33%) Amazon Athena
10 1 (0.33%) Amazon Aurora
Development Applications
1 25 (8.33%) Git
2 22 (7.33%) MSBuild
2 22 (7.33%) Octopus Deploy
2 22 (7.33%) Team Foundation Server
2 22 (7.33%) Visual Studio
3 8 (2.67%) JIRA
4 1 (0.33%) Jenkins
4 1 (0.33%) Postman
4 1 (0.33%) Rational Rhapsody
General
1 106 (35.33%) Social Skills
2 53 (17.67%) Finance
3 47 (15.67%) Analytical Skills
4 44 (14.67%) Retail
5 32 (10.67%) Legal
6 22 (7.33%) Law
7 21 (7.00%) Marketing
8 18 (6.00%) Inclusion and Diversity
9 13 (4.33%) Organisational Skills
10 10 (3.33%) Games
11 9 (3.00%) Banking
12 5 (1.67%) Influencing Skills
12 5 (1.67%) Public Sector
13 4 (1.33%) Documentation Skills
14 3 (1.00%) Advertising
14 3 (1.00%) Investment Banking
14 3 (1.00%) Local Government
14 3 (1.00%) Manufacturing
14 3 (1.00%) Military
14 3 (1.00%) Police
Job Titles
1 71 (23.67%) Architect
2 40 (13.33%) Analyst
3 32 (10.67%) Lead
3 32 (10.67%) Senior
4 29 (9.67%) Technical Architect
5 24 (8.00%) AWS Architect
6 18 (6.00%) SAP Analyst
7 15 (5.00%) Lead Architect
8 14 (4.67%) IT Manager
8 14 (4.67%) Solutions Architect
8 14 (4.67%) Support Analyst
9 13 (4.33%) Cloud Architect
9 13 (4.33%) Data Manager
9 13 (4.33%) SAP Support
9 13 (4.33%) SAP Support Analyst
10 12 (4.00%) Information Manager
11 11 (3.67%) Security Manager
12 10 (3.33%) Security Engineer
12 10 (3.33%) Senior Architect
13 9 (3.00%) Governance Manager
Libraries, Frameworks & Software Standards
1 31 (10.33%) HTML
2 29 (9.67%) CSS
3 26 (8.67%) REST
4 24 (8.00%) .NET
4 24 (8.00%) ASP.NET
4 24 (8.00%) JSON
5 23 (7.67%) gRPC
5 23 (7.67%) XML
6 22 (7.33%) Bootstrap
7 17 (5.67%) Kafka
8 15 (5.00%) Elastic Stack
9 13 (4.33%) SAP Fiori
10 6 (2.00%) Node.js
11 5 (1.67%) CodeIgniter
11 5 (1.67%) Laravel
12 3 (1.00%) EDI
13 2 (0.67%) EJB
13 2 (0.67%) Middleware
13 2 (0.67%) Pandas
13 2 (0.67%) RESTful
Miscellaneous
1 58 (19.33%) Management Information System
2 22 (7.33%) Cloud Native
3 21 (7.00%) Data Protection Act
4 9 (3.00%) Cyber Threat
4 9 (3.00%) Onboarding
5 8 (2.67%) Clustering
5 8 (2.67%) e-Learning
5 8 (2.67%) Learning Management System
5 8 (2.67%) Social Media
6 7 (2.33%) Analytical Mindset
6 7 (2.33%) Distributed Systems
6 7 (2.33%) Freedom of Information
6 7 (2.33%) Security Posture
6 7 (2.33%) Self-Motivation
7 6 (2.00%) Algorithms
7 6 (2.00%) Product Ownership
8 5 (1.67%) Freedom of Information Act
8 5 (1.67%) NHS
8 5 (1.67%) Operational Technology
9 4 (1.33%) Credit Risk
Operating Systems
1 27 (9.00%) Windows
2 16 (5.33%) Linux
3 7 (2.33%) Windows Server
4 6 (2.00%) Android
4 6 (2.00%) Apple iOS
5 3 (1.00%) CentOS
5 3 (1.00%) Ubuntu
5 3 (1.00%) Windows 10
6 2 (0.67%) Solaris
6 2 (0.67%) VMS
6 2 (0.67%) Windows Server 2016
6 2 (0.67%) Windows Server 2019
7 1 (0.33%) Unix
7 1 (0.33%) Windows Server 2008
Processes & Methodologies
1 88 (29.33%) DevOps
2 71 (23.67%) Problem-Solving
3 67 (22.33%) Data Protection
4 61 (20.33%) Information Security
5 54 (18.00%) CI/CD
6 50 (16.67%) Microservices
7 49 (16.33%) Cybersecurity
7 49 (16.33%) Data Security
8 42 (14.00%) Design Patterns
8 42 (14.00%) Technical Leadership
9 37 (12.33%) CRM
10 36 (12.00%) Event-Driven
10 36 (12.00%) Event-Driven Architecture
11 35 (11.67%) Data Management
11 35 (11.67%) Risk Management
12 34 (11.33%) Containerisation
13 33 (11.00%) Analytics
13 33 (11.00%) Incident Response
14 32 (10.67%) Computer Science
14 32 (10.67%) Continuous Improvement
Programming Languages
1 69 (23.00%) SQL
2 49 (16.33%) Python
3 32 (10.67%) C#
4 28 (9.33%) JavaScript
4 28 (9.33%) PowerShell
5 27 (9.00%) Java
6 24 (8.00%) Bash
7 13 (4.33%) ABAP
8 7 (2.33%) Perl
8 7 (2.33%) T-SQL
9 5 (1.67%) PHP
9 5 (1.67%) R
10 4 (1.33%) Data Analysis Expressions
11 3 (1.00%) Scala
12 1 (0.33%) Apex Code
12 1 (0.33%) OpenEdge ABL
12 1 (0.33%) Progress 4GL
Qualifications
1 58 (19.33%) Degree
2 31 (10.33%) CISSP
3 29 (9.67%) AWS Certification
3 29 (9.67%) Security Cleared
4 25 (8.33%) Computer Science Degree
5 23 (7.67%) AWS Certified Solutions Architect
6 22 (7.33%) CISM
7 19 (6.33%) SC Cleared
8 18 (6.00%) Azure Certification
9 8 (2.67%) CISA
10 6 (2.00%) CEH
10 6 (2.00%) CRISC
11 5 (1.67%) Cisco Certification
11 5 (1.67%) Microsoft Certification
12 4 (1.33%) DBS Check
12 4 (1.33%) ISEB
12 4 (1.33%) ISO 27001 Lead Implementer
12 4 (1.33%) Master's Degree
13 3 (1.00%) CompTIA Security+
13 3 (1.00%) Linux+ Certification
Quality Assurance & Compliance
1 79 (26.33%) ISO/IEC 27001
2 51 (17.00%) NIST
3 44 (14.67%) HIPAA
4 39 (13.00%) PCI DSS
5 33 (11.00%) Cyber Essentials
6 23 (7.67%) Data Quality
7 16 (5.33%) Sarbanes-Oxley
8 12 (4.00%) SOC 2
9 8 (2.67%) Accessibility
9 8 (2.67%) California Consumer Privacy Act
9 8 (2.67%) GRC
9 8 (2.67%) PERC
10 6 (2.00%) Cyber Essentials PLUS
11 5 (1.67%) ISO/IEC 27002 (supersedes ISO/IEC 17799)
12 4 (1.33%) Actionable Recommendations
12 4 (1.33%) Basel III
12 4 (1.33%) Dodd-Frank
12 4 (1.33%) IFRS
12 4 (1.33%) IFRS 9
12 4 (1.33%) SLA
System Software
1 48 (16.00%) Docker
2 20 (6.67%) Active Directory
3 11 (3.67%) VMware Infrastructure
4 4 (1.33%) Hyper-V
5 3 (1.00%) Dovecot
5 3 (1.00%) Postfix
6 2 (0.67%) Virtual Machines
Systems Management
1 31 (10.33%) Kubernetes
2 21 (7.00%) Terraform
3 16 (5.33%) Grafana
4 14 (4.67%) Prometheus
5 11 (3.67%) Ansible
6 7 (2.33%) Microsoft Intune
7 6 (2.00%) Red Hat Satellite
7 6 (2.00%) Single Sign-On
8 4 (1.33%) SCCM
8 4 (1.33%) SCOM
8 4 (1.33%) SCOrch
9 3 (1.00%) CASB
10 2 (0.67%) Computer Emergency Response Teams
10 2 (0.67%) Istio
10 2 (0.67%) linkerd
10 2 (0.67%) Progress Chef
10 2 (0.67%) Puppet
11 1 (0.33%) Kibana
11 1 (0.33%) logstash
11 1 (0.33%) Nessus
Vendors
1 89 (29.67%) Microsoft
2 30 (10.00%) Google
3 19 (6.33%) SAP
4 14 (4.67%) VMware
5 11 (3.67%) Salesforce
6 10 (3.33%) Red Hat
7 9 (3.00%) OneTrust
8 8 (2.67%) Adobe
9 6 (2.00%) Informatica
9 6 (2.00%) Xero
10 5 (1.67%) Databricks
10 5 (1.67%) OpenAI
10 5 (1.67%) Sage
11 4 (1.33%) Cisco
12 3 (1.00%) Okta
12 3 (1.00%) Ping Identity
12 3 (1.00%) Splunk
13 2 (0.67%) HubSpot
13 2 (0.67%) Meraki
13 2 (0.67%) Talend