Linux/Unix Command Line Interface (CLI)
UK

The table below looks at the prevalence of the term Linux Command Line in permanent job vacancies. Included is a benchmarking guide to the salaries offered in vacancies that have cited Linux Command Line over the 6 months to 9 May 2024 with a comparison to the same period over the previous 2 years.

6 months to
9 May 2024
Same period 2023 Same period 2022
Rank 742 640 498
Rank change year-on-year -102 -142 -8
Permanent jobs citing Linux Command Line 160 354 1,084
As % of all permanent jobs advertised in the UK 0.16% 0.35% 0.69%
As % of the Miscellaneous category 0.46% 0.82% 1.45%
Number of salaries quoted 131 211 316
10th Percentile £35,000 £30,500 £32,500
25th Percentile £40,750 £42,375 £45,938
Median annual salary (50th Percentile) £52,500 £60,000 £57,500
Median % change year-on-year -12.50% +4.35% +4.55%
75th Percentile £71,750 £75,000 £80,000
90th Percentile £85,000 £97,328 £95,000
UK excluding London median annual salary £50,000 £52,500 £50,000
% change year-on-year -4.76% +5.00% -4.76%

All Generic Skills
UK

Linux Command Line is in the General and Transferable Skills category. The following table is for comparison with the above and provides summary statistics for all permanent job vacancies with a requirement for generic IT skills.

Permanent vacancies with a requirement for generic IT skills 35,043 43,311 74,759
As % of all permanent jobs advertised in the UK 35.36% 42.74% 47.65%
Number of salaries quoted 23,056 23,480 33,820
10th Percentile £28,000 £35,250 £34,500
25th Percentile £38,000 £46,250 £45,750
Median annual salary (50th Percentile) £55,000 £65,000 £62,500
Median % change year-on-year -15.38% +4.00% +4.17%
75th Percentile £75,000 £86,250 £84,000
90th Percentile £97,500 £107,550 £102,500
UK excluding London median annual salary £50,000 £55,000 £52,500
% change year-on-year -9.09% +4.76% +5.00%

Linux Command Line
Job Vacancy Trend

Job postings citing Linux Command Line as a proportion of all IT jobs advertised.
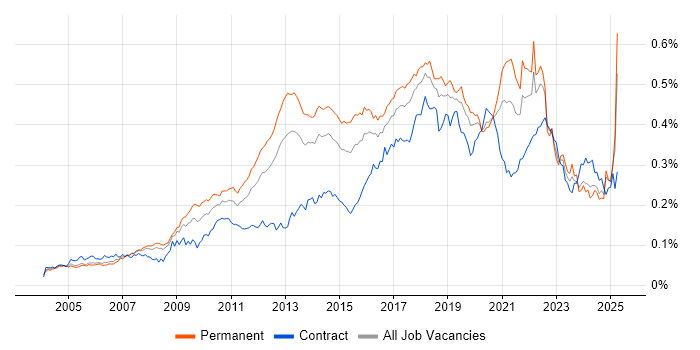
Job vacancy trend for Linux Command Line in the UK

Linux Command Line
Salary Trend

3-month moving average salary quoted in jobs citing Linux Command Line.

Salary trend for Linux Command Line in the UK

Linux Command Line
Salary Histogram

Salary distribution for jobs citing Linux Command Line over the 6 months to 9 May 2024.

Salary histogram for Linux Command Line in the UK

Linux Command Line
Top 15 Job Locations

The table below looks at the demand and provides a guide to the median salaries quoted in IT jobs citing Linux Command Line within the UK over the 6 months to 9 May 2024. The 'Rank Change' column provides an indication of the change in demand within each location based on the same 6 month period last year.

Location Rank Change
on Same Period
Last Year
Matching
Permanent
IT Job Ads
Median Salary
Past 6 Months
Median Salary
% Change
on Same Period
Last Year
Live
Jobs
England -46 155 £52,500 -12.50% 68
UK excluding London -110 102 £50,000 -4.76% 37
Work from Home -26 65 £67,500 +17.39% 42
London +43 53 £70,000 +7.69% 34
South East -3 36 £42,500 - 10
South West -15 28 £52,500 +40.00% 9
North of England -8 17 £50,000 -11.11% 4
Midlands -34 12 £50,000 -9.09% 4
Yorkshire +54 11 £62,500 -10.71% 1
East of England +12 10 £43,500 -39.58% 3
West Midlands +3 10 £50,000 +10.98% 2
North West -4 5 £50,000 -9.09% 3
East Midlands -27 2 £40,000 -23.81% 2
Wales +3 1 £50,000 +11.11% 1
North East -12 1 - -

Linux Command Line
Co-occurring Skills and Capabilities by Category

The follow tables expand on the table above by listing co-occurrences grouped by category. The same employment type, locality and period is covered with up to 20 co-occurrences shown in each of the following categories:

Application Platforms
1 12 (7.50%) SharePoint
2 11 (6.88%) nginx
3 10 (6.25%) WordPress
4 9 (5.63%) IIS
4 9 (5.63%) Microsoft Exchange
5 3 (1.88%) Confluence
6 2 (1.25%) Apache
7 1 (0.63%) Apache Airflow
7 1 (0.63%) Apache Spark
7 1 (0.63%) CMS
7 1 (0.63%) Drupal
7 1 (0.63%) Tomcat
Applications
1 6 (3.75%) Microsoft Office
2 5 (3.13%) GNU Octave
3 4 (2.50%) Microsoft Excel
3 4 (2.50%) MS Visio
Business Applications
1 6 (3.75%) Remedy ITSM
Cloud Services
1 58 (36.25%) AWS
2 44 (27.50%) Azure
3 27 (16.88%) OpenShift
4 16 (10.00%) Microsoft 365
5 14 (8.75%) Azure DevOps
6 13 (8.13%) Azure Monitor
6 13 (8.13%) Cloud Computing
7 12 (7.50%) Serverless
8 11 (6.88%) AWS Lambda
9 10 (6.25%) Amazon EC2
9 10 (6.25%) Amazon S3
10 9 (5.63%) OneDrive
11 8 (5.00%) Azure AKS
11 8 (5.00%) GitHub
12 7 (4.38%) Azure Cosmos DB
12 7 (4.38%) Datadog
12 7 (4.38%) Entra ID
12 7 (4.38%) Pulumi
13 6 (3.75%) Azure Storage
13 6 (3.75%) SaaS
Communications & Networking
1 45 (28.13%) Firewall
2 15 (9.38%) Wireless
3 13 (8.13%) DNS
4 11 (6.88%) Network Security
4 11 (6.88%) TCP/IP
4 11 (6.88%) VPN
5 9 (5.63%) Fibre Channel
5 9 (5.63%) iSCSI
5 9 (5.63%) NAS
5 9 (5.63%) SAN
6 7 (4.38%) LAN
7 6 (3.75%) WAN
8 5 (3.13%) AMQP
8 5 (3.13%) SSH
9 4 (2.50%) Multicast
9 4 (2.50%) OSPF
10 3 (1.88%) HTTP
10 3 (1.88%) Wi-Fi
11 2 (1.25%) DHCP
11 2 (1.25%) Ethernet
Database & Business Intelligence
1 34 (21.25%) MySQL
2 23 (14.38%) PostgreSQL
3 11 (6.88%) SQL Server
4 10 (6.25%) Amazon RDS
4 10 (6.25%) MongoDB
5 8 (5.00%) Azure SQL Database
5 8 (5.00%) MariaDB
6 7 (4.38%) Redis
7 6 (3.75%) Relational Database
8 5 (3.13%) InfluxDB
8 5 (3.13%) Power BI
9 4 (2.50%) Elasticsearch
9 4 (2.50%) NoSQL
10 2 (1.25%) Apache Cassandra
10 2 (1.25%) BusinessObjects
10 2 (1.25%) Neo4j
10 2 (1.25%) Oracle Database
10 2 (1.25%) SQL Server Integration Services
11 1 (0.63%) Big Data
11 1 (0.63%) Hadoop
Development Applications
1 55 (34.38%) Git
2 28 (17.50%) Jenkins
3 21 (13.13%) JIRA
4 12 (7.50%) Subversion
5 11 (6.88%) Robot Framework
6 10 (6.25%) GNU Toolchain
7 9 (5.63%) GitLab
8 7 (4.38%) Team Foundation Server
9 5 (3.13%) DTrace
9 5 (3.13%) GDB
10 4 (2.50%) Bitbucket
10 4 (2.50%) Rational DOORS
11 3 (1.88%) JUnit
12 2 (1.25%) Artifactory
12 2 (1.25%) Atlassian Bamboo
12 2 (1.25%) Cucumber
12 2 (1.25%) Gradle
13 1 (0.63%) CMake
13 1 (0.63%) PHPUnit
13 1 (0.63%) Postman
General
1 27 (16.88%) Social Skills
2 18 (11.25%) Analytical Skills
3 16 (10.00%) Aerospace
4 12 (7.50%) Finance
5 9 (5.63%) Retail
6 8 (5.00%) Law
7 5 (3.13%) Aviation
8 3 (1.88%) Inclusion and Diversity
8 3 (1.88%) Pharmaceutical
9 2 (1.25%) Manufacturing
9 2 (1.25%) Music Industry
9 2 (1.25%) Organisational Skills
9 2 (1.25%) Public Sector
10 1 (0.63%) Advertising
10 1 (0.63%) Banking
10 1 (0.63%) Electronics
10 1 (0.63%) Games
Job Titles
1 35 (21.88%) Azure Engineer
2 32 (20.00%) Developer
3 22 (13.75%) Platform Engineer
4 20 (12.50%) Cloud Engineer
5 17 (10.63%) Linux Engineer
5 17 (10.63%) Network Engineer
6 16 (10.00%) Cloud Platform Engineer
7 14 (8.75%) Automation Engineer
7 14 (8.75%) Infrastructure Engineer
8 13 (8.13%) Administrator
8 13 (8.13%) AWS Engineer
8 13 (8.13%) Linux Administrator
8 13 (8.13%) Operations Engineer
8 13 (8.13%) Support Engineer
9 11 (6.88%) Consultant
9 11 (6.88%) DevOps Engineer
9 11 (6.88%) Linux Systems Administrator
9 11 (6.88%) Software Consultant
10 10 (6.25%) Linux Developer
10 10 (6.25%) Unix Linux Systems Administrator
Libraries, Frameworks & Software Standards
1 21 (13.13%) HTML
2 17 (10.63%) Node.js
3 15 (9.38%) XML
4 11 (6.88%) React
5 10 (6.25%) CSS
5 10 (6.25%) LAMP
5 10 (6.25%) POSIX
6 8 (5.00%) ARM Templates
6 8 (5.00%) Laravel
6 8 (5.00%) RESTful
7 7 (4.38%) REST
8 6 (3.75%) JSON
9 5 (3.13%) NumPy
9 5 (3.13%) RabbitMQ
9 5 (3.13%) Vue
10 4 (2.50%) Akka
10 4 (2.50%) NETCONF
10 4 (2.50%) SOAP
10 4 (2.50%) Spring
11 3 (1.88%) RESTCONF
Miscellaneous
1 11 (6.88%) Embedded Systems
1 11 (6.88%) Replication
2 10 (6.25%) Hybrid Cloud
3 7 (4.38%) Client/Server
3 7 (4.38%) Product Ownership
4 6 (3.75%) Public Cloud
5 5 (3.13%) Clustering
6 4 (2.50%) Data Centre
7 3 (1.88%) Enterprise Software
8 2 (1.25%) Cloud Native
8 2 (1.25%) Mobile App
8 2 (1.25%) Private Cloud
8 2 (1.25%) Self-Motivation
9 1 (0.63%) Data Structures
9 1 (0.63%) Foreign Exchange (FX)
9 1 (0.63%) Hedge funds
9 1 (0.63%) Life Science
9 1 (0.63%) Mainframe
9 1 (0.63%) Music Streaming
9 1 (0.63%) Video Conferencing
Operating Systems
1 140 (87.50%) Linux
2 39 (24.38%) Unix
2 39 (24.38%) Windows
3 30 (18.75%) Red Hat Enterprise Linux
4 22 (13.75%) CentOS
5 20 (12.50%) CoreOS
6 19 (11.88%) Windows Server
7 14 (8.75%) Windows Server 2016
8 12 (7.50%) Ubuntu
9 11 (6.88%) VMS
10 9 (5.63%) Windows Server 2019
11 7 (4.38%) Windows 10
12 2 (1.25%) Android
12 2 (1.25%) Apple iOS
12 2 (1.25%) Debian
12 2 (1.25%) Mac OS
13 1 (0.63%) Fedora
13 1 (0.63%) openSUSE
Processes & Methodologies
1 68 (42.50%) DevOps
2 44 (27.50%) CI/CD
2 44 (27.50%) Configuration Management
3 41 (25.63%) Agile
4 37 (23.13%) Problem-Solving
5 36 (22.50%) Time Management
6 28 (17.50%) Infrastructure as Code
7 25 (15.63%) Software Testing
8 23 (14.38%) ITIL
9 22 (13.75%) Platform Engineering
10 21 (13.13%) Change Management
10 21 (13.13%) Test Automation
11 20 (12.50%) Infrastructure Engineering
12 19 (11.88%) Containerisation
13 17 (10.63%) Customer Service
13 17 (10.63%) Open Source
14 16 (10.00%) Analytics
14 16 (10.00%) Continuous Improvement
15 15 (9.38%) Collaborative Working
15 15 (9.38%) Deployment Automation
Programming Languages
1 88 (55.00%) Python
2 75 (46.88%) Bash
3 44 (27.50%) SQL
4 35 (21.88%) PowerShell
5 34 (21.25%) Java
6 22 (13.75%) PHP
7 19 (11.88%) JavaScript
8 16 (10.00%) C
9 15 (9.38%) Go
10 14 (8.75%) Perl
10 14 (8.75%) Shell Script
11 12 (7.50%) C++
12 11 (6.88%) Ruby
13 10 (6.25%) C#
13 10 (6.25%) TypeScript
14 8 (5.00%) PL/SQL
15 7 (4.38%) Groovy
16 5 (3.13%) MATLAB
16 5 (3.13%) OCaml
16 5 (3.13%) SystemTap
Qualifications
1 29 (18.13%) Degree
2 25 (15.63%) Security Cleared
3 16 (10.00%) SC Cleared
4 13 (8.13%) Azure Certification
5 8 (5.00%) DV Cleared
6 7 (4.38%) Computer Science Degree
7 5 (3.13%) AWS Certification
7 5 (3.13%) Cisco Certification
8 4 (2.50%) Chartered Engineer
8 4 (2.50%) HNC
8 4 (2.50%) HND
9 3 (1.88%) AWS Certified DevOps Engineer
9 3 (1.88%) AWS Certified Solutions Architect
10 1 (0.63%) AWS Certified Cloud Practitioner
10 1 (0.63%) CCNA
10 1 (0.63%) DBS Check
10 1 (0.63%) ITIL Certification
10 1 (0.63%) Microsoft Certification
Quality Assurance & Compliance
1 5 (3.13%) QA
2 1 (0.63%) Cyber Essentials
2 1 (0.63%) Cyber Essentials PLUS
2 1 (0.63%) GDPR
2 1 (0.63%) ISO/IEC 27001
2 1 (0.63%) SLA
System Software
1 49 (30.63%) Docker
2 19 (11.88%) Active Directory
3 9 (5.63%) vSphere
4 3 (1.88%) VirtualBox
5 2 (1.25%) Virtual Machines
6 1 (0.63%) Firmware
6 1 (0.63%) Hyper-V
6 1 (0.63%) Samba
Systems Management
1 51 (31.88%) Kubernetes
2 47 (29.38%) Ansible
3 44 (27.50%) Puppet
4 34 (21.25%) Terraform
5 23 (14.38%) Progress Chef
6 17 (10.63%) Grafana
7 13 (8.13%) Prometheus
8 11 (6.88%) Salt
9 10 (6.25%) Microsoft Intune
10 9 (5.63%) SCCM
11 5 (3.13%) Docker Swarm
12 3 (1.88%) Kibana
13 2 (1.25%) ZABBIX
14 1 (0.63%) Jamf Pro
14 1 (0.63%) logstash
14 1 (0.63%) Nmap
14 1 (0.63%) OpenNMS
14 1 (0.63%) Single Sign-On
14 1 (0.63%) systemd
Vendors
1 25 (15.63%) Microsoft
2 24 (15.00%) Red Hat
3 13 (8.13%) Palo Alto
4 11 (6.88%) Cisco
4 11 (6.88%) ServiceNow
5 10 (6.25%) Remedy
5 10 (6.25%) Synology
5 10 (6.25%) Veeam
6 9 (5.63%) Aruba
6 9 (5.63%) ProCurve
6 9 (5.63%) VMware
6 9 (5.63%) Zerto
7 7 (4.38%) New Relic
7 7 (4.38%) SaltStack
8 6 (3.75%) BMC
9 4 (2.50%) Google
9 4 (2.50%) Oracle
9 4 (2.50%) SolarWinds
9 4 (2.50%) Thales
10 2 (1.25%) Blue Prism