Red Hat
UK

The table below provides summary statistics for permanent job vacancies requiring knowledge or experience of Red Hat products and/or services. It includes a benchmarking guide to the annual salaries offered in vacancies that cited Red Hat over the 6 months leading up to 31 May 2025, comparing them to the same period in the previous two years.

The figures below represent the IT labour market in general and are not representative of salaries within Red Hat, Inc.

6 months to
31 May 2025
Same period 2024 Same period 2023
Rank 415 309 368
Rank change year-on-year -106 +59 +134
Permanent jobs citing Red Hat 308 942 858
As % of all permanent jobs advertised in the UK 0.55% 0.91% 0.90%
As % of the Vendors category 1.38% 2.57% 2.16%
Number of salaries quoted 143 319 350
10th Percentile £37,750 £41,450 £41,875
25th Percentile £52,500 £46,750 £51,250
Median annual salary (50th Percentile) £65,000 £60,000 £62,500
Median % change year-on-year +8.33% -4.00% +4.17%
75th Percentile £76,250 £81,500 £79,688
90th Percentile £84,750 £96,250 £110,000
UK excluding London median annual salary £60,000 £52,500 £55,000
% change year-on-year +14.29% -4.55% +10.00%

All Vendors
UK

Red Hat falls under the Vendor Products and Services category. For comparison with the information above, the following table provides summary statistics for all permanent job vacancies requiring knowledge or experience of all vendor products and services.

Permanent vacancies with a requirement for knowledge or experience of vendor products and services 22,290 36,673 39,803
As % of all permanent jobs advertised in the UK 39.92% 35.37% 41.55%
Number of salaries quoted 12,073 24,880 23,381
10th Percentile £25,750 £26,700 £31,250
25th Percentile £36,246 £36,000 £41,250
Median annual salary (50th Percentile) £54,793 £50,000 £57,500
Median % change year-on-year +9.59% -13.04% +4.55%
75th Percentile £70,600 £68,750 £75,000
90th Percentile £88,750 £87,500 £92,500
UK excluding London median annual salary £47,773 £45,543 £50,000
% change year-on-year +4.90% -8.91% +5.26%

Red Hat
Job Vacancy Trend

Job postings citing Red Hat as a proportion of all IT jobs advertised.
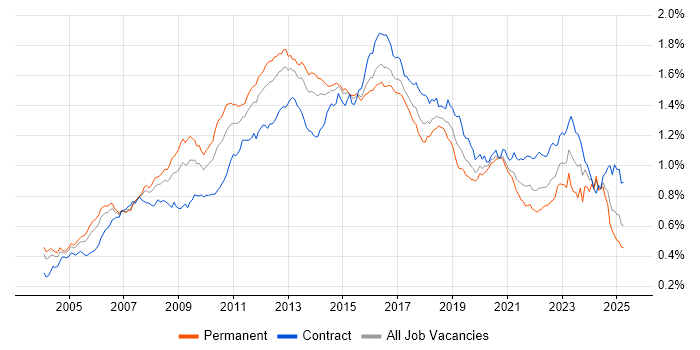
Job vacancy trend for Red Hat in the UK

Red Hat
Salary Trend

3-month moving average salary quoted in jobs citing Red Hat.

Salary trend for Red Hat in the UK

Red Hat
Salary Histogram

Salary distribution for jobs citing Red Hat over the 6 months to 31 May 2025.

Salary histogram for Red Hat in the UK

Red Hat
Top 16 Job Locations

The table below looks at the demand and provides a guide to the median salaries quoted in IT jobs citing Red Hat within the UK over the 6 months to 31 May 2025. The 'Rank Change' column provides an indication of the change in demand within each location based on the same 6 month period last year.

Location Rank Change
on Same Period
Last Year
Matching
Permanent
IT Job Ads
Median Salary
Past 6 Months
Median Salary
% Change
on Same Period
Last Year
Live
Jobs
England -136 291 £65,000 +8.33% 239
UK excluding London -131 187 £60,000 +14.29% 172
London +25 104 £71,250 -16.18% 90
Work from Home +29 83 £70,000 +16.67% 162
South East -36 83 £70,000 +40.00% 28
South West -5 35 £61,250 +16.67% 29
Midlands -3 28 £32,500 -35.00% 37
North of England -107 21 £63,603 +21.15% 38
East Midlands -28 16 £47,500 +91.92% 27
Yorkshire +47 13 £70,000 +47.37% 15
West Midlands +64 12 £31,250 -47.92% 10
East of England +27 9 £57,500 -4.17% 14
North West -137 7 £56,103 +2.00% 19
Scotland +112 6 £37,500 -22.68% 10
Northern Ireland +42 5 £55,000 - 14
North East +49 1 £55,000 +10.00% 4

Red Hat
Co-occurring Skills and Capabilities by Category

The follow tables expand on the table above by listing co-occurrences grouped by category. The same employment type, locality and period is covered with up to 20 co-occurrences shown in each of the following categories:

Application Platforms
1 13 (4.22%) Tomcat
2 12 (3.90%) Microsoft Exchange
2 12 (3.90%) nginx
3 10 (3.25%) Apache
4 7 (2.27%) Apache Airflow
4 7 (2.27%) Apache Spark
5 6 (1.95%) SharePoint
6 5 (1.62%) Confluence
7 4 (1.30%) IIS
8 3 (0.97%) WinCC
9 2 (0.65%) OpenEdge
10 1 (0.32%) ColdFusion
10 1 (0.32%) Drupal
10 1 (0.32%) JBoss
10 1 (0.32%) Oracle SOA Suite
Applications
1 4 (1.30%) Microsoft Excel
2 1 (0.32%) Trello
Business Applications
1 7 (2.27%) Oracle EBS
2 5 (1.62%) Fidessa
3 3 (0.97%) Remedy ITSM
4 2 (0.65%) MFGPRO
5 1 (0.32%) iTrent
Cloud Services
1 73 (23.70%) Azure
2 63 (20.45%) AWS
3 33 (10.71%) Azure DevOps
4 18 (5.84%) GitHub
5 15 (4.87%) OpenShift
6 10 (3.25%) Microsoft 365
7 9 (2.92%) Cloud Computing
8 8 (2.60%) Amazon ElastiCache
8 8 (2.60%) Amazon OpenSearch
8 8 (2.60%) Amazon SQS
8 8 (2.60%) GCP
9 6 (1.95%) Amazon ECR
9 6 (1.95%) Nutanix
9 6 (1.95%) PaaS
10 5 (1.62%) Amazon ECS
10 5 (1.62%) Azure ExpressRoute
10 5 (1.62%) Azure Monitor
10 5 (1.62%) Entra ID
10 5 (1.62%) GitHub Actions
11 4 (1.30%) Azure AKS
Communications & Networking
1 27 (8.77%) TCP/IP
2 21 (6.82%) DNS
3 19 (6.17%) Firewall
4 14 (4.55%) DHCP
5 12 (3.90%) Ethernet
6 11 (3.57%) Cisco ISE
6 11 (3.57%) MPLS
6 11 (3.57%) SAN
7 9 (2.92%) LAN
8 7 (2.27%) NAS
9 6 (1.95%) WAN
9 6 (1.95%) Wireshark
10 5 (1.62%) FIX Connectivity
10 5 (1.62%) VPN
11 4 (1.30%) HTTP
11 4 (1.30%) Multicast
11 4 (1.30%) Telnet
11 4 (1.30%) VLAN
12 3 (0.97%) Cisco ASA
12 3 (0.97%) Remote Desktop
Database & Business Intelligence
1 26 (8.44%) PostgreSQL
2 19 (6.17%) NoSQL
3 15 (4.87%) SQL Server
4 14 (4.55%) Elasticsearch
5 13 (4.22%) DB2
6 12 (3.90%) MongoDB
6 12 (3.90%) MySQL
7 11 (3.57%) Amazon RDS
8 9 (2.92%) Amazon Aurora
9 7 (2.27%) Data Warehouse
9 7 (2.27%) Hadoop
9 7 (2.27%) Oracle ODI
10 6 (1.95%) Apache Hudi
10 6 (1.95%) Apache Iceberg
10 6 (1.95%) Delta Lake
10 6 (1.95%) Relational Database
11 2 (0.65%) Big Data
12 1 (0.32%) Couchbase
12 1 (0.32%) MariaDB
12 1 (0.32%) Tableau
Development Applications
1 41 (13.31%) Git
2 16 (5.19%) Jenkins
3 15 (4.87%) Bitbucket
4 10 (3.25%) JUnit
5 9 (2.92%) SonarQube
6 8 (2.60%) Cucumber
6 8 (2.60%) Maven
6 8 (2.60%) Mockito
6 8 (2.60%) Postman
6 8 (2.60%) Selenium
6 8 (2.60%) TestNG
7 7 (2.27%) GitLab
8 5 (1.62%) JIRA
8 5 (1.62%) Subversion
9 2 (0.65%) Robot Framework
9 2 (0.65%) WebSpeed
10 1 (0.32%) Eclipse
10 1 (0.32%) IntelliJ
10 1 (0.32%) NetBeans
10 1 (0.32%) Octopus Deploy
General
1 93 (30.19%) Inclusion and Diversity
2 87 (28.25%) Public Sector
3 77 (25.00%) Finance
4 41 (13.31%) Social Skills
5 27 (8.77%) Analytical Skills
5 27 (8.77%) Banking
6 15 (4.87%) Law
7 10 (3.25%) Manufacturing
8 5 (1.62%) Police
8 5 (1.62%) Telecoms
9 4 (1.30%) Back Office
9 4 (1.30%) Military
9 4 (1.30%) Spanish Language
10 3 (0.97%) Presentation Skills
11 2 (0.65%) Aerospace
11 2 (0.65%) Marketing
11 2 (0.65%) Organisational Skills
12 1 (0.32%) Electronics
12 1 (0.32%) Financial Institution
12 1 (0.32%) Front Office
Job Titles
1 65 (21.10%) DevOps Engineer
2 51 (16.56%) Senior
3 46 (14.94%) Administrator
4 41 (13.31%) Azure Engineer
5 36 (11.69%) Systems Administrator
6 28 (9.09%) Linux Administrator
7 24 (7.79%) Developer
8 21 (6.82%) Azure DevOps Engineer
8 21 (6.82%) Linux Systems Administrator
9 20 (6.49%) Java Engineer
10 19 (6.17%) Linux Engineer
11 18 (5.84%) Infrastructure Engineer
12 17 (5.52%) Oracle Developer
13 16 (5.19%) Consultant
13 16 (5.19%) Senior DevOps
13 16 (5.19%) Technical Consultant
14 15 (4.87%) Integration Consultant
14 15 (4.87%) Oracle Consultant
14 15 (4.87%) Oracle Technical Consultant
14 15 (4.87%) Senior DevOps Engineer
Libraries, Frameworks & Software Standards
1 17 (5.52%) Kafka
2 16 (5.19%) React
3 15 (4.87%) AngularJS
4 14 (4.55%) REST
5 13 (4.22%) Bootstrap
5 13 (4.22%) jQuery
6 12 (3.90%) Backbone.js
6 12 (3.90%) Ember.js
7 11 (3.57%) Elastic Stack
8 9 (2.92%) FIX Protocol
8 9 (2.92%) RESTful
8 9 (2.92%) Spring
8 9 (2.92%) Spring Boot
9 8 (2.60%) Gherkin
9 8 (2.60%) Guice
9 8 (2.60%) JAX-RS
9 8 (2.60%) Middleware
9 8 (2.60%) Mustache
9 8 (2.60%) Swagger
9 8 (2.60%) WireMock
Miscellaneous
1 111 (36.04%) Hybrid Cloud
2 103 (33.44%) e-Learning
3 19 (6.17%) Data Structures
4 18 (5.84%) Data Centre
5 15 (4.87%) Management Information System
6 14 (4.55%) Clustering
7 12 (3.90%) Algorithms
8 9 (2.92%) Equities
8 9 (2.92%) Fixed Income
9 8 (2.60%) Legacy Systems
9 8 (2.60%) Life Science
9 8 (2.60%) Public Cloud
10 7 (2.27%) Derivative
11 5 (1.62%) Bitcoin
11 5 (1.62%) Eurex
11 5 (1.62%) Mobile App
12 4 (1.30%) Onboarding
12 4 (1.30%) Reference Data
12 4 (1.30%) Replication
12 4 (1.30%) SCADA
Operating Systems
1 181 (58.77%) Linux
2 96 (31.17%) Red Hat Enterprise Linux
3 48 (15.58%) Windows
4 34 (11.04%) Unix
5 33 (10.71%) CentOS
6 22 (7.14%) Ubuntu
7 20 (6.49%) Rocky
8 18 (5.84%) Windows Server
9 14 (4.55%) Solaris
10 12 (3.90%) Android
10 12 (3.90%) Apple iOS
11 9 (2.92%) Debian
12 7 (2.27%) Windows Server 2019
13 4 (1.30%) Oracle Linux
14 3 (0.97%) VMS
14 3 (0.97%) Windows Server 2012
15 2 (0.65%) AIX
15 2 (0.65%) SUSE
15 2 (0.65%) Windows Server 2016
15 2 (0.65%) zOS
Processes & Methodologies
1 118 (38.31%) DevOps
2 103 (33.44%) Artificial Intelligence
3 95 (30.84%) Mentoring
4 88 (28.57%) Coaching
5 83 (26.95%) Agile
6 55 (17.86%) Containerisation
7 51 (16.56%) Test Automation
8 49 (15.91%) CI/CD
9 38 (12.34%) Problem-Solving
10 27 (8.77%) ITIL
11 26 (8.44%) Continuous Improvement
12 25 (8.12%) Configuration Management
13 24 (7.79%) High Availability
14 23 (7.47%) Innovative Thinking
15 21 (6.82%) Infrastructure as Code
15 21 (6.82%) Infrastructure Engineering
16 20 (6.49%) Disaster Recovery
16 20 (6.49%) Performance Monitoring
17 19 (6.17%) Code Quality
18 18 (5.84%) Root Cause Analysis
Programming Languages
1 64 (20.78%) Python
2 56 (18.18%) SQL
3 50 (16.23%) Bash
4 34 (11.04%) Java
5 24 (7.79%) PowerShell
6 18 (5.84%) Perl
7 10 (3.25%) C++
8 9 (2.92%) JavaScript
9 7 (2.27%) PL/SQL
10 6 (1.95%) Shell Script
11 5 (1.62%) C#
12 3 (0.97%) R
12 3 (0.97%) SystemVerilog
12 3 (0.97%) Tcl
12 3 (0.97%) VB
13 2 (0.65%) C
13 2 (0.65%) Go
13 2 (0.65%) Korn
13 2 (0.65%) Kusto Query Language
13 2 (0.65%) PHP
Qualifications
1 46 (14.94%) Security Cleared
2 34 (11.04%) SC Cleared
3 33 (10.71%) DV Cleared
4 32 (10.39%) Degree
5 25 (8.12%) Cisco Certification
6 23 (7.47%) CCNP
6 23 (7.47%) RHCSA
7 10 (3.25%) RHCE
8 9 (2.92%) AWS Certification
8 9 (2.92%) CCNA
9 8 (2.60%) Network+ Certification
9 8 (2.60%) VMware Certified Professional (VCP)
10 7 (2.27%) Azure Certification
10 7 (2.27%) Computer Science Degree
10 7 (2.27%) MCSA
10 7 (2.27%) Microsoft Certification
11 6 (1.95%) MCSE
12 4 (1.30%) ITIL Certification
13 3 (0.97%) Linux+ Certification
13 3 (0.97%) Master's Degree
Quality Assurance & Compliance
1 11 (3.57%) GDPR
2 9 (2.92%) Sarbanes-Oxley
3 8 (2.60%) QA
4 7 (2.27%) SLA
5 6 (1.95%) Accessibility
5 6 (1.95%) Data Quality
6 4 (1.30%) ISO/IEC 27001
7 3 (0.97%) HIPAA
8 1 (0.32%) ISO 15022
8 1 (0.32%) ISO 20022
8 1 (0.32%) PMO
System Software
1 55 (17.86%) VMware Infrastructure
2 33 (10.71%) Docker
3 15 (4.87%) Hyper-V
4 12 (3.90%) Active Directory
5 8 (2.60%) Veritas Cluster Server
6 6 (1.95%) HDFS
7 5 (1.62%) Virtual Desktop
7 5 (1.62%) vSphere
8 4 (1.30%) Virtual Machines
9 3 (0.97%) Dovecot
9 3 (0.97%) NFS
9 3 (0.97%) Postfix
10 2 (0.65%) Citrix Hypervisor
11 1 (0.32%) KVM
11 1 (0.32%) VMware ESXi
Systems Management
1 67 (21.75%) Ansible
2 50 (16.23%) Kubernetes
3 44 (14.29%) Terraform
4 15 (4.87%) Grafana
4 15 (4.87%) Nagios
5 12 (3.90%) Puppet
6 9 (2.92%) Red Hat Satellite
7 8 (2.60%) Kustomize
7 8 (2.60%) Packer
8 5 (1.62%) Progress Chef
8 5 (1.62%) SCCM
9 4 (1.30%) SCOM
9 4 (1.30%) WSUS
10 3 (0.97%) Active Directory Federation Services
10 3 (0.97%) Functional Safety
10 3 (0.97%) Microsoft Intune
10 3 (0.97%) NetBackup
10 3 (0.97%) Prometheus
11 2 (0.65%) Microsoft Data Protection Manager
12 1 (0.32%) NetApp OnCommand
Vendors
1 113 (36.69%) IBM
2 68 (22.08%) VMware
3 55 (17.86%) Cisco
4 54 (17.53%) Oracle
5 37 (12.01%) Microsoft
6 13 (4.22%) SolarWinds
7 12 (3.90%) Atlassian
7 12 (3.90%) Juniper
8 11 (3.57%) SevOne
8 11 (3.57%) Splunk
9 8 (2.60%) Dell
9 8 (2.60%) Veritas
10 7 (2.27%) Citrix
10 7 (2.27%) Palo Alto
10 7 (2.27%) Symantec
11 6 (1.95%) Commvault
11 6 (1.95%) Pure Storage
12 5 (1.62%) Bloomberg
12 5 (1.62%) HP
12 5 (1.62%) Reuters