Change Management Jobs with Hybrid/Remote/WFH Options

Change Management
UK > Work from Home

The table below provides summary statistics for permanent remote or hybrid work requiring Change Management skills. It includes a benchmarking guide to the annual salaries offered in vacancies that cited Change Management over the 6 months leading up to 29 May 2025, comparing them to the same period in the previous two years.

6 months to
29 May 2025
Same period 2024 Same period 2023
Rank 138 84 139
Rank change year-on-year -54 +55 +19
Permanent jobs citing Change Management 502 1,209 987
As % of all permanent jobs with a WFH option 2.69% 3.52% 2.48%
As % of the Processes & Methodologies category 2.86% 3.89% 2.58%
Number of salaries quoted 316 678 693
10th Percentile £37,375 £37,101 £37,885
25th Percentile £46,247 £44,813 £45,300
Median annual salary (50th Percentile) £60,000 £57,500 £57,396
Median % change year-on-year +4.35% +0.18% -4.34%
75th Percentile £73,886 £72,375 £75,000
90th Percentile £95,500 £90,000 £89,852
UK median annual salary £53,688 £55,000 £55,000
% change year-on-year -2.39% - -

All Process and Methodology Skills
Work from Home

Change Management falls under the Processes and Methodologies category. For comparison with the information above, the following table provides summary statistics for all permanent job vacancies with remote or hybrid options requiring process or methodology skills.

Permanent vacancies with a requirement for process or methodology skills 17,565 31,100 38,209
As % of all permanent jobs with a WFH option 93.96% 90.53% 96.07%
Number of salaries quoted 9,249 23,476 26,508
10th Percentile £27,000 £33,750 £37,500
25th Percentile £42,500 £42,500 £47,500
Median annual salary (50th Percentile) £57,500 £57,500 £62,621
Median % change year-on-year - -8.18% +4.37%
75th Percentile £77,500 £75,000 £82,500
90th Percentile £101,250 £95,000 £100,000
UK median annual salary £57,500 £55,000 £61,000
% change year-on-year +4.55% -9.84% +1.67%

Change Management
Trend for Jobs with a WFH Option

Job vacancies with remote working options citing Change Management as a proportion of all IT jobs advertised.
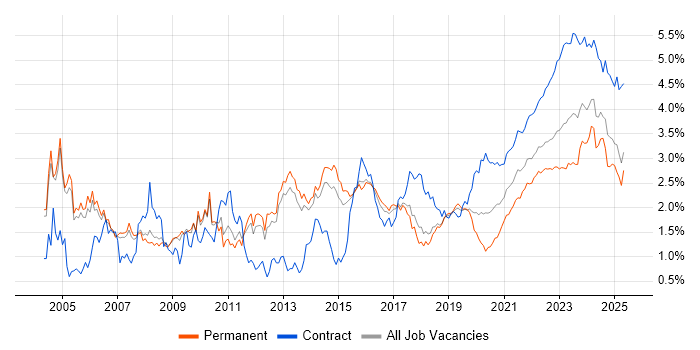
Change Management trend for jobs with Hybrid/Remote/WFH options

Change Management
Salary Trend for Jobs with a WFH Option

3-month moving average salary quoted in job vacancies with remote working options citing Change Management.

Change Management salary trend for jobs with a WFH option

Change Management
Salary Histogram for Jobs with a WFH Option

Salary distribution for jobs with remote working options citing Change Management over the 6 months to 29 May 2025.

Change Management salary histogram for jobs with a WFH option

Change Management
Co-occurring Skills and Capabilities with WFH Options by Category

The follow tables expand on the table above by listing co-occurrences grouped by category. The same employment type, locality and period is covered with up to 20 co-occurrences shown in each of the following categories:

Application Platforms
1 20 (3.98%) SharePoint
2 19 (3.78%) Microsoft Exchange
3 17 (3.39%) IIS
4 8 (1.59%) Confluence
5 7 (1.39%) WordPress
6 5 (1.00%) Apache
Applications
1 52 (10.36%) Microsoft Office
2 17 (3.39%) Microsoft Excel
3 13 (2.59%) Microsoft Project
3 13 (2.59%) MS Visio
4 12 (2.39%) Trello
5 9 (1.79%) Microsoft PowerPoint
6 2 (0.40%) Spreadsheet
Business Applications
1 11 (2.19%) NetSuite
2 10 (1.99%) Remedy ITSM
3 7 (1.39%) Dynamics CRM
4 6 (1.20%) SAP CO
4 6 (1.20%) SAP FI
4 6 (1.20%) SAP FI/CO
5 4 (0.80%) CA PPM
6 2 (0.40%) Carpe Diem
6 2 (0.40%) Dynamics NAV
6 2 (0.40%) Elite 3E
6 2 (0.40%) Infor M3
6 2 (0.40%) Oracle ERP
6 2 (0.40%) SAP S/4HANA
7 1 (0.20%) Dynamics AX
7 1 (0.20%) Workday HCM
Cloud Services
1 96 (19.12%) Azure
2 55 (10.96%) Microsoft 365
3 44 (8.76%) AWS
4 39 (7.77%) SaaS
5 34 (6.77%) Power Platform
6 26 (5.18%) Entra ID
7 20 (3.98%) GCP
8 15 (2.99%) Azure Logic Apps
9 14 (2.79%) Azure Monitor
10 12 (2.39%) Dynamics 365
11 11 (2.19%) npm
12 10 (1.99%) AWS Direct Connect
12 10 (1.99%) PowerApps
13 9 (1.79%) Azure DevOps
13 9 (1.79%) Power Automate
14 7 (1.39%) Azure Data Factory
14 7 (1.39%) Smartsheet
14 7 (1.39%) Stripe
15 6 (1.20%) Cloud Computing
16 5 (1.00%) Google Workspace
Communications & Networking
1 80 (15.94%) Broadband
2 36 (7.17%) Firewall
2 36 (7.17%) WAN
3 31 (6.18%) VPN
4 30 (5.98%) LAN
5 22 (4.38%) WLAN
6 20 (3.98%) Wi-Fi
7 19 (3.78%) BGP
8 18 (3.59%) SD-WAN
9 17 (3.39%) TCP/IP
10 16 (3.19%) IPsec
10 16 (3.19%) OSPF
10 16 (3.19%) Wireless
11 15 (2.99%) Cisco ASA
11 15 (2.99%) Remote Desktop
12 14 (2.79%) Cisco Firepower
13 13 (2.59%) DNS
14 12 (2.39%) MPLS
14 12 (2.39%) NX-OS
15 7 (1.39%) DHCP
Database & Business Intelligence
1 39 (7.77%) SQL Server
2 19 (3.78%) Power BI
2 19 (3.78%) Relational Database
3 12 (2.39%) Tableau
4 10 (1.99%) Data Lake
5 8 (1.59%) Big Data
5 8 (1.59%) Data Warehouse
5 8 (1.59%) DB2
5 8 (1.59%) NoSQL
6 7 (1.39%) SQL Server Integration Services
7 6 (1.20%) Oracle Reports
8 5 (1.00%) PostgreSQL
9 2 (0.40%) Azure SQL Database
9 2 (0.40%) BigQuery
9 2 (0.40%) Cloud Spanner
9 2 (0.40%) MongoDB
9 2 (0.40%) RDBMS
9 2 (0.40%) SQL Server Reporting Services
10 1 (0.20%) GIS
10 1 (0.20%) MS Access
Development Applications
1 30 (5.98%) JIRA
2 18 (3.59%) Git
3 11 (2.19%) Cucumber
3 11 (2.19%) Cypress.io
3 11 (2.19%) Sonatype Nexus
3 11 (2.19%) webpack
4 7 (1.39%) Visual Studio
5 2 (0.40%) Jenkins
General
1 280 (55.78%) Social Skills
2 151 (30.08%) Finance
3 79 (15.74%) Games
4 75 (14.94%) Analytical Skills
5 46 (9.16%) Banking
6 38 (7.57%) Law
7 31 (6.18%) Legal
8 24 (4.78%) Presentation Skills
9 23 (4.58%) Inclusion and Diversity
10 22 (4.38%) Public Sector
11 21 (4.18%) Organisational Skills
12 15 (2.99%) Influencing Skills
12 15 (2.99%) Retail
13 13 (2.59%) Local Government
13 13 (2.59%) Marketing
14 11 (2.19%) Billing
14 11 (2.19%) Publishing
15 10 (1.99%) Back Office
15 10 (1.99%) Manufacturing
16 9 (1.79%) Automotive
Job Titles
1 119 (23.71%) Senior
2 90 (17.93%) Analyst
3 83 (16.53%) Senior Manager
3 83 (16.53%) ServiceNow Manager
4 79 (15.74%) Engineering Manager
5 78 (15.54%) Senior Service Manager
6 53 (10.56%) Lead
7 44 (8.76%) Project Manager
8 28 (5.58%) Consultant
8 28 (5.58%) Support Analyst
9 26 (5.18%) Business Analyst
10 25 (4.98%) Senior Analyst
11 21 (4.18%) Applications Support
12 20 (3.98%) IT Manager
13 18 (3.59%) Developer
14 16 (3.19%) Change Manager
14 16 (3.19%) Network Engineer
15 14 (2.79%) Administrator
16 13 (2.59%) Applications Manager
16 13 (2.59%) Support Manager
Libraries, Frameworks & Software Standards
1 21 (4.18%) .NET
2 13 (2.59%) Web Services
3 12 (2.39%) CSS
3 12 (2.39%) HTML
3 12 (2.39%) RESTful
4 11 (2.19%) Jest
4 11 (2.19%) Spring Boot
5 8 (1.59%) .NET Framework
6 7 (1.39%) ASP.NET
6 7 (1.39%) Middleware
6 7 (1.39%) Node.js
6 7 (1.39%) React
7 5 (1.00%) AngularJS
7 5 (1.00%) JSON
7 5 (1.00%) YAML
8 4 (0.80%) FIX Protocol
8 4 (0.80%) HTML5 Canvas
9 2 (0.40%) Kafka
9 2 (0.40%) PostGIS
9 2 (0.40%) Razor View Engine
Miscellaneous
1 145 (28.88%) Management Information System
2 101 (20.12%) Product Ownership
3 79 (15.74%) Video\Live Streaming
4 34 (6.77%) Data Centre
5 19 (3.78%) Self-Motivation
6 18 (3.59%) Onboarding
7 16 (3.19%) Client/Server
7 16 (3.19%) Legacy Systems
8 13 (2.59%) Social Media
9 10 (1.99%) Cloud Native
9 10 (1.99%) Private Cloud
10 9 (1.79%) Public Cloud
11 8 (1.59%) Clustering
12 7 (1.39%) Distributed Applications
12 7 (1.39%) Learning Management System
12 7 (1.39%) PMI
12 7 (1.39%) Virtual Team
13 6 (1.20%) Driving Licence
13 6 (1.20%) Legacy Applications
13 6 (1.20%) Mainframe
Operating Systems
1 80 (15.94%) Windows
2 22 (4.38%) Windows Server
3 19 (3.78%) Linux
4 14 (2.79%) Unix
5 13 (2.59%) Apple iOS
6 11 (2.19%) Mac OS
6 11 (2.19%) Windows Vista
7 10 (1.99%) Windows 10
8 8 (1.59%) Red Hat Enterprise Linux
9 1 (0.20%) SUSE
9 1 (0.20%) Windows Server 2016
9 1 (0.20%) Windows Server 2019
Processes & Methodologies
1 148 (29.48%) Problem Management
2 146 (29.08%) Service Delivery
3 145 (28.88%) ITSM
4 128 (25.50%) Problem-Solving
5 124 (24.70%) Incident Management
6 118 (23.51%) Roadmaps
7 117 (23.31%) ITIL
8 106 (21.12%) Agile
9 102 (20.32%) Continuous Improvement
10 100 (19.92%) Computer Science
11 91 (18.13%) Software Engineering
12 89 (17.73%) Project Management
12 89 (17.73%) Software Delivery
13 82 (16.33%) Validation
14 79 (15.74%) Deployment Automation
15 78 (15.54%) Service Management
16 70 (13.94%) Customer Service
17 62 (12.35%) Stakeholder Management
18 57 (11.35%) Project Delivery
19 45 (8.96%) Process Improvement
Programming Languages
1 60 (11.95%) SQL
2 22 (4.38%) PowerShell
3 19 (3.78%) T-SQL
4 18 (3.59%) C#
4 18 (3.59%) JavaScript
5 16 (3.19%) Java
5 16 (3.19%) Python
6 8 (1.59%) PL/SQL
7 7 (1.39%) PHP
7 7 (1.39%) VB.NET
8 5 (1.00%) Shell Script
9 3 (0.60%) TypeScript
10 2 (0.40%) C++
10 2 (0.40%) VB
11 1 (0.20%) ABAP
11 1 (0.20%) RPG
11 1 (0.20%) RPG IV
11 1 (0.20%) SAPscript
Qualifications
1 150 (29.88%) Degree
2 81 (16.14%) Computer Science Degree
3 26 (5.18%) PMI Certification
4 21 (4.18%) PMP
5 16 (3.19%) DBS Check
5 16 (3.19%) ITIL Certification
5 16 (3.19%) Microsoft Certification
6 11 (2.19%) Security Cleared
7 9 (1.79%) CISSP
7 9 (1.79%) MCITP
7 9 (1.79%) Network+ Certification
8 6 (1.20%) Cisco Certification
9 5 (1.00%) AWS Certification
9 5 (1.00%) CCNP
9 5 (1.00%) CSPO
10 3 (0.60%) Azure Certification
10 3 (0.60%) CCNA
10 3 (0.60%) GISP
10 3 (0.60%) SC Cleared
11 2 (0.40%) A+ Certification
Quality Assurance & Compliance
1 43 (8.57%) QA
2 42 (8.37%) SLA
3 15 (2.99%) PMO
4 7 (1.39%) Accessibility
4 7 (1.39%) WCAG
5 6 (1.20%) IFRS
5 6 (1.20%) IFRS 9
6 5 (1.00%) P3O
7 4 (0.80%) Data Quality
8 3 (0.60%) GDPR
8 3 (0.60%) Sarbanes-Oxley
9 2 (0.40%) 21 CFR Part 11
9 2 (0.40%) GMP
9 2 (0.40%) GRC
10 1 (0.20%) COBIT
10 1 (0.20%) Cyber Essentials
10 1 (0.20%) Cyber Essentials PLUS
10 1 (0.20%) ISO 9001
10 1 (0.20%) ISO/IEC 27001
System Software
1 44 (8.76%) Active Directory
2 17 (3.39%) Firmware
3 15 (2.99%) VMware Infrastructure
4 14 (2.79%) Docker
5 9 (1.79%) BitLocker
6 5 (1.00%) Terminal Services
6 5 (1.00%) Veritas Cluster Server
7 2 (0.40%) Hyper-V
8 1 (0.20%) vSphere
Systems Management
1 19 (3.78%) Microsoft Intune
2 12 (2.39%) Ansible
3 11 (2.19%) SCCM
4 10 (1.99%) Terraform
5 5 (1.00%) ZABBIX
6 4 (0.80%) Progress Chef
6 4 (0.80%) Puppet
7 2 (0.40%) Kubernetes
8 1 (0.20%) FortiGate
8 1 (0.20%) Nessus
8 1 (0.20%) NetBackup
8 1 (0.20%) SCOM
8 1 (0.20%) Single Sign-On
8 1 (0.20%) WSUS
Vendors
1 133 (26.49%) Microsoft
2 99 (19.72%) ServiceNow
3 41 (8.17%) Cisco
4 33 (6.57%) Oracle
5 23 (4.58%) SAP
6 22 (4.38%) Salesforce
6 22 (4.38%) VMware
7 20 (3.98%) CheckPoint
7 20 (3.98%) SolarWinds
8 19 (3.78%) Apple
9 13 (2.59%) Google
10 12 (2.39%) Meraki
11 10 (1.99%) Dynatrace
11 10 (1.99%) Infoblox
11 10 (1.99%) Remedy
12 9 (1.79%) HP
12 9 (1.79%) MobileIron
13 8 (1.59%) iManage
13 8 (1.59%) Intapp
13 8 (1.59%) Red Hat