Lead Jobs with Hybrid/Remote/WFH Options

Leader
UK > Work from Home

The median Leader salary for remote or hybrid work is £75,000 per year, according to job vacancies posted during the 6 months leading to 28 May 2025.

The table below provides salary benchmarking and summary statistics, comparing them to the same period in the previous two years.

6 months to
28 May 2025
Same period 2024 Same period 2023
Rank 30 19 27
Rank change year-on-year -11 +8 +13
Permanent jobs requiring a Lead 1,442 3,401 3,416
As % of all permanent jobs with a WFH option 7.74% 9.95% 8.54%
As % of the Job Titles category 8.48% 10.35% 8.90%
Number of salaries quoted 792 2,722 2,586
10th Percentile £47,683 £47,000 £47,500
25th Percentile £60,000 £56,000 £57,500
Median annual salary (50th Percentile) £75,000 £74,137 £72,500
Median % change year-on-year +1.16% +2.26% -3.33%
75th Percentile £97,500 £86,250 £93,750
90th Percentile £125,000 £106,125 £112,500
UK median annual salary £71,991 £70,000 £72,500
% change year-on-year +2.84% -3.45% -

All Permanent IT Job Vacancies
Work from Home

For comparison with the information above, the following table provides summary statistics for all permanent IT job vacancies with WFH or hybrid options. Most job vacancies include a discernible job title that can be normalized. As such, the figures in the second row provide an indication of the number of permanent jobs in our overall sample.

Permanent vacancies in Work from Home with a recognized job title 17,000 32,872 38,382
% of permanent jobs with a recognized job title 91.30% 96.16% 95.92%
Number of salaries quoted 9,335 25,152 27,304
10th Percentile £27,500 £33,127 £36,750
25th Percentile £41,250 £42,500 £47,447
Median annual salary (50th Percentile) £57,500 £56,000 £62,500
Median % change year-on-year +2.68% -10.40% +4.17%
75th Percentile £76,250 £75,000 £81,250
90th Percentile £100,000 £93,750 £100,000
UK median annual salary £55,000 £52,500 £60,000
% change year-on-year +4.76% -12.50% -

Lead
Trend for Jobs with a WFH Option

Job vacancies with remote working options which featured Lead in the job title as a proportion of all IT jobs advertised.
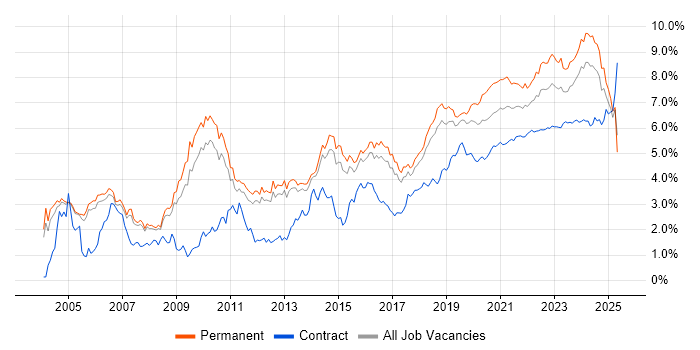
Lead trend for jobs with Hybrid/Remote/WFH options

Lead
Salary Trend for Jobs with a WFH Option

3-month moving average salary quoted in job vacancies with remote working options citing Lead.

Lead salary trend for jobs with a WFH option

Lead
Salary Histogram for Jobs with a WFH Option

Salary distribution for jobs with remote working options citing Lead over the 6 months to 28 May 2025.

Lead salary histogram for jobs with a WFH option

Lead Skill Set
Top 30 Co-occurring Skills and Capabilities in Job Vacancies with WFH Options

For the 6 months to 28 May 2025, Lead job roles required the following skills and capabilities in order of popularity. The figures indicate the absolute number co-occurrences and as a proportion of all permanent jobs with hybrid or remote work options featuring Lead in the job title.

1 730 (50.62%) Mentoring
2 617 (42.79%) Roadmaps
3 571 (39.60%) Social Skills
4 527 (36.55%) Agile
5 476 (33.01%) Product Management
6 462 (32.04%) High Availability
7 453 (31.41%) Broadband
8 422 (29.26%) Problem-Solving
9 394 (27.32%) DevOps
10 379 (26.28%) AWS
11 374 (25.94%) Python
12 351 (24.34%) JavaScript
13 324 (22.47%) Degree
14 308 (21.36%) Kubernetes
15 303 (21.01%) Java
16 297 (20.60%) Inclusion and Diversity
17 294 (20.39%) Docker
18 293 (20.32%) Terraform
19 274 (19.00%) Computer Science
20 270 (18.72%) Finance
21 266 (18.45%) Containerisation
22 261 (18.10%) Linux
23 258 (17.89%) Infrastructure as Code
24 257 (17.82%) Computer Science Degree
25 253 (17.55%) Google
26 248 (17.20%) Ansible
27 243 (16.85%) Continuous Integration
28 237 (16.44%) NoSQL
28 237 (16.44%) Broadcast Engineering
29 235 (16.30%) Go

Lead Skill Set
Co-occurring Skills and Capabilities with WFH Options by Category

The follow tables expand on the table above by listing co-occurrences grouped by category. The same employment type, locality and period is covered with up to 20 co-occurrences shown in each of the following categories:

Application Platforms
1 26 (1.80%) SharePoint
2 19 (1.32%) CMS
3 12 (0.83%) Umbraco
4 11 (0.76%) Confluence
4 11 (0.76%) Drupal
4 11 (0.76%) Microsoft Exchange
5 9 (0.62%) WordPress
6 8 (0.55%) Apache Spark
7 7 (0.49%) Apache
8 6 (0.42%) Apache Airflow
8 6 (0.42%) SAS
9 5 (0.35%) Oracle Workflow
10 4 (0.28%) nginx
11 3 (0.21%) Apache Solr
11 3 (0.21%) IIS
11 3 (0.21%) OpenEdge
12 2 (0.14%) ArcGIS
12 2 (0.14%) Kinematics
12 2 (0.14%) Mendix
13 1 (0.069%) Skype for Business
Applications
1 73 (5.06%) Microsoft Office
2 40 (2.77%) Simulink
3 26 (1.80%) Microsoft Excel
4 9 (0.62%) Chatbot
5 8 (0.55%) Microsoft PowerPoint
6 3 (0.21%) Adobe Creative Suite
7 2 (0.14%) Adobe Illustrator
7 2 (0.14%) CATIA
7 2 (0.14%) Oracle Smart View
7 2 (0.14%) Sketch
7 2 (0.14%) Spreadsheet
8 1 (0.069%) Adobe XD
8 1 (0.069%) InVision
8 1 (0.069%) Moqups
Business Applications
1 12 (0.83%) Dynamics CRM
2 8 (0.55%) Oracle EBS
3 7 (0.49%) Shopify
4 6 (0.42%) Magento
4 6 (0.42%) Oracle Applications
5 5 (0.35%) Oracle Financials
6 4 (0.28%) Oracle EBS R12
6 4 (0.28%) SAP PP
6 4 (0.28%) SAP S/4HANA
7 3 (0.21%) Oracle ERP
7 3 (0.21%) SAP IBP
7 3 (0.21%) Sparx Enterprise Architect
8 2 (0.14%) NetSuite
8 2 (0.14%) Oracle Assets
8 2 (0.14%) Oracle Cash Management
8 2 (0.14%) Oracle General Ledger
8 2 (0.14%) Oracle Receivables
8 2 (0.14%) SAP EHS
8 2 (0.14%) SAP MM
8 2 (0.14%) Workday HCM
Cloud Services
1 379 (26.28%) AWS
2 221 (15.33%) Azure
3 216 (14.98%) Pulumi
4 84 (5.83%) GCP
5 64 (4.44%) SaaS
6 61 (4.23%) Power Platform
7 60 (4.16%) Microsoft 365
8 31 (2.15%) Serverless
9 25 (1.73%) Dynamics 365
9 25 (1.73%) GitHub
10 23 (1.60%) Azure DevOps
11 18 (1.25%) Entra ID
12 17 (1.18%) AWS Lambda
12 17 (1.18%) PowerApps
13 15 (1.04%) Google Analytics
14 13 (0.90%) Power Automate
15 11 (0.76%) GitHub Actions
15 11 (0.76%) PaaS
16 8 (0.55%) Azure AKS
16 8 (0.55%) Microsoft Purview
Communications & Networking
1 453 (31.41%) Broadband
2 35 (2.43%) Firewall
3 29 (2.01%) WAN
4 26 (1.80%) VPN
5 19 (1.32%) Internet
5 19 (1.32%) LAN
5 19 (1.32%) Wi-Fi
6 16 (1.11%) TCP/IP
7 14 (0.97%) Network Security
8 12 (0.83%) OSPF
8 12 (0.83%) SD-WAN
9 11 (0.76%) VLAN
10 10 (0.69%) BGP
11 9 (0.62%) Cisco ASA
11 9 (0.62%) Cisco Firepower
11 9 (0.62%) DNS
12 8 (0.55%) IPsec
12 8 (0.55%) Wireless
13 7 (0.49%) WLAN
14 6 (0.42%) Bluetooth
Database & Business Intelligence
1 237 (16.44%) NoSQL
2 222 (15.40%) Relational Database
3 215 (14.91%) RDBMS
4 59 (4.09%) SQL Server
5 45 (3.12%) Power BI
6 41 (2.84%) Data Lake
7 26 (1.80%) BigQuery
8 23 (1.60%) PostgreSQL
9 21 (1.46%) Data Warehouse
10 20 (1.39%) MongoDB
11 16 (1.11%) Tableau
12 12 (0.83%) Metadata
13 10 (0.69%) Big Data
13 10 (0.69%) Looker
13 10 (0.69%) SQL Server Integration Services
14 8 (0.55%) Data Hub
14 8 (0.55%) Hadoop
15 7 (0.49%) Azure SQL Database
15 7 (0.49%) MySQL
15 7 (0.49%) SQL Server Reporting Services
Development Applications
1 215 (14.91%) Jaeger
2 44 (3.05%) JIRA
3 43 (2.98%) Jenkins
4 38 (2.64%) Git
5 15 (1.04%) GitLab
5 15 (1.04%) Selenium
6 12 (0.83%) webpack
7 11 (0.76%) SonarQube
8 9 (0.62%) Cypress.io
8 9 (0.62%) Maven
9 8 (0.55%) Cucumber
9 8 (0.55%) Oracle Forms
10 7 (0.49%) Gradle
10 7 (0.49%) Postman
11 6 (0.42%) Bitbucket
11 6 (0.42%) Sonatype Nexus
12 5 (0.35%) KGDB
12 5 (0.35%) TeamCity
13 4 (0.28%) Bazaar
13 4 (0.28%) SoapUI
General
1 571 (39.60%) Social Skills
2 297 (20.60%) Inclusion and Diversity
3 270 (18.72%) Finance
4 108 (7.49%) Banking
5 85 (5.89%) Multimedia
6 68 (4.72%) Analytical Skills
7 51 (3.54%) Law
8 47 (3.26%) Aerospace
9 41 (2.84%) Front Office
10 36 (2.50%) Legal
11 26 (1.80%) Marketing
11 26 (1.80%) Public Sector
12 25 (1.73%) Games
12 25 (1.73%) Retail
13 20 (1.39%) Organisational Skills
14 19 (1.32%) Presentation Skills
15 18 (1.25%) Influencing Skills
16 13 (0.90%) Advertising
16 13 (0.90%) Electronics
16 13 (0.90%) Publishing
Libraries, Frameworks & Software Standards
1 217 (15.05%) Elastic Stack
2 215 (14.91%) OpenTelemetry
3 106 (7.35%) React
4 71 (4.92%) .NET
5 46 (3.19%) CSS
6 43 (2.98%) REST
7 39 (2.70%) Node.js
8 38 (2.64%) Kafka
9 37 (2.57%) HTML
10 31 (2.15%) RESTful
11 27 (1.87%) React Native
12 26 (1.80%) .NET Core
13 22 (1.53%) AngularJS
14 18 (1.25%) Spring Boot
14 18 (1.25%) Web Services
15 17 (1.18%) Django
16 15 (1.04%) Vue
17 14 (0.97%) Middleware
17 14 (0.97%) Spring
18 13 (0.90%) OAuth
Miscellaneous
1 70 (4.85%) Product Ownership
2 50 (3.47%) Cloud Native
3 41 (2.84%) Management Information System
4 40 (2.77%) Derivative
4 40 (2.77%) Foreign Exchange (FX)
5 35 (2.43%) Equities
5 35 (2.43%) Fixed Income
5 35 (2.43%) Mobile App
6 33 (2.29%) Hedge funds
7 31 (2.15%) Distributed Systems
8 30 (2.08%) Algorithms
9 25 (1.73%) Data Centre
10 22 (1.53%) Public Cloud
11 21 (1.46%) Onboarding
12 18 (1.25%) Hybrid Cloud
12 18 (1.25%) Legacy Systems
12 18 (1.25%) Self-Motivation
13 16 (1.11%) Private Cloud
13 16 (1.11%) Robotics
13 16 (1.11%) Virtual Team
Operating Systems
1 261 (18.10%) Linux
2 219 (15.19%) Unix
3 58 (4.02%) Windows
4 27 (1.87%) Windows Server
5 26 (1.80%) Android
6 25 (1.73%) Apple iOS
7 4 (0.28%) Red Hat Enterprise Linux
7 4 (0.28%) Windows 10
8 3 (0.21%) Embedded Linux
8 3 (0.21%) Windows Server 2016
9 2 (0.14%) Debian
9 2 (0.14%) Robot Operating System
9 2 (0.14%) Windows Server 2019
10 1 (0.069%) Amazon Linux
10 1 (0.069%) VMS
10 1 (0.069%) Windows Server 2003
Processes & Methodologies
1 730 (50.62%) Mentoring
2 617 (42.79%) Roadmaps
3 527 (36.55%) Agile
4 476 (33.01%) Product Management
5 462 (32.04%) High Availability
6 422 (29.26%) Problem-Solving
7 394 (27.32%) DevOps
8 274 (19.00%) Computer Science
9 266 (18.45%) Containerisation
10 258 (17.89%) Infrastructure as Code
11 243 (16.85%) Continuous Integration
12 237 (16.44%) Broadcast Engineering
13 225 (15.60%) Task Automation
14 224 (15.53%) Performance Optimisation
15 221 (15.33%) Resource Management
16 217 (15.05%) Cost Optimisation
17 215 (14.91%) Budget Control
17 215 (14.91%) GitOps
18 170 (11.79%) Software Engineering
19 162 (11.23%) Coaching
Programming Languages
1 374 (25.94%) Python
2 351 (24.34%) JavaScript
3 303 (21.01%) Java
4 235 (16.30%) Go
5 234 (16.23%) Bash
6 136 (9.43%) SQL
7 88 (6.10%) C#
8 70 (4.85%) TypeScript
9 33 (2.29%) C++
9 33 (2.29%) PowerShell
10 25 (1.73%) PHP
11 17 (1.18%) MATLAB
12 16 (1.11%) Kotlin
13 12 (0.83%) Ruby
14 8 (0.55%) C
14 8 (0.55%) PL/SQL
14 8 (0.55%) R
14 8 (0.55%) Swift
15 7 (0.49%) Objective-C
16 6 (0.42%) Delphi
Qualifications
1 324 (22.47%) Degree
2 257 (17.82%) Computer Science Degree
3 224 (15.53%) AWS Certification
4 56 (3.88%) Security Cleared
5 42 (2.91%) BPSS Clearance
6 40 (2.77%) SC Cleared
7 19 (1.32%) DBS Check
7 19 (1.32%) PhD
8 12 (0.83%) Cisco Certification
9 11 (0.76%) CCNP
9 11 (0.76%) Microsoft Certification
10 9 (0.62%) Master's Degree
11 7 (0.49%) CCNA
11 7 (0.49%) DV Cleared
11 7 (0.49%) MCP
11 7 (0.49%) MCSA
11 7 (0.49%) MCSE
12 6 (0.42%) CISSP
12 6 (0.42%) CITP
13 4 (0.28%) TOGAF Certification
Quality Assurance & Compliance
1 62 (4.30%) QA
2 36 (2.50%) ISO/IEC 27001
3 33 (2.29%) MiFID
4 32 (2.22%) GDPR
5 30 (2.08%) Accessibility
6 26 (1.80%) Data Quality
7 19 (1.32%) NIST
8 15 (1.04%) ISO 9001
9 14 (0.97%) SLA
10 8 (0.55%) PCI DSS
10 8 (0.55%) WCAG
11 7 (0.49%) NCSC
12 6 (0.42%) Def Stans
12 6 (0.42%) HIPAA
12 6 (0.42%) Sarbanes-Oxley
12 6 (0.42%) SOC 2
13 5 (0.35%) IFRS
13 5 (0.35%) PMO
14 4 (0.28%) Basel III
14 4 (0.28%) IFRS 9
System Software
1 294 (20.39%) Docker
2 30 (2.08%) Active Directory
3 13 (0.90%) VMware Infrastructure
4 11 (0.76%) Hyper-V
5 10 (0.69%) Firmware
6 4 (0.28%) HDFS
7 3 (0.21%) BitLocker
7 3 (0.21%) Virtual Machines
8 2 (0.14%) VMware ESXi
8 2 (0.14%) vSphere
9 1 (0.069%) Virtual Desktop
Systems Management
1 308 (21.36%) Kubernetes
2 293 (20.32%) Terraform
3 248 (17.20%) Ansible
4 218 (15.12%) Prometheus
5 215 (14.91%) Argo
5 215 (14.91%) Kustomize
6 16 (1.11%) Single Sign-On
7 8 (0.55%) Microsoft Intune
7 8 (0.55%) Puppet
8 6 (0.42%) Progress Chef
8 6 (0.42%) SCCM
9 5 (0.35%) Grafana
10 2 (0.14%) Iperf
11 1 (0.069%) Active Directory Federation Services
11 1 (0.069%) Nessus
11 1 (0.069%) NetBackup
11 1 (0.069%) Packer
11 1 (0.069%) SCOM
11 1 (0.069%) SCOrch
11 1 (0.069%) SCSM
Vendors
1 253 (17.55%) Google
2 211 (14.63%) Microsoft
3 40 (2.77%) MathWorks
4 39 (2.70%) Cisco
5 30 (2.08%) Oracle
6 28 (1.94%) ServiceNow
7 27 (1.87%) VMware
8 22 (1.53%) Salesforce
9 21 (1.46%) Databricks
10 19 (1.32%) SAP
11 11 (0.76%) Fortinet
12 10 (0.69%) Aruba
12 10 (0.69%) Palo Alto
13 9 (0.62%) CheckPoint
13 9 (0.62%) Informatica
13 9 (0.62%) NetApp
13 9 (0.62%) SolarWinds
14 8 (0.55%) Mellanox
14 8 (0.55%) New Relic
14 8 (0.55%) NVIDIA