Oracle Jobs with Hybrid/Remote/WFH Options

Oracle
UK > Work from Home

The table below provides summary statistics for permanent remote or hybrid work requiring knowledge or experience of Oracle products and/or services. It includes a benchmarking guide to the annual salaries offered in vacancies that cited Oracle over the 6 months leading up to 3 May 2025, comparing them to the same period in the previous two years.

The figures below represent the IT labour market in general and are not representative of salaries within the Oracle Corporation.

6 months to
3 May 2025
Same period 2024 Same period 2023
Rank 107 74 75
Rank change year-on-year -33 +1 +35
Permanent jobs citing Oracle 464 1,328 1,766
As % of all permanent jobs with a WFH option 3.06% 3.93% 4.15%
As % of the Vendors category 6.64% 9.44% 10.29%
Number of salaries quoted 292 597 1,081
10th Percentile £43,000 £41,250 £40,500
25th Percentile £51,875 £50,500 £48,750
Median annual salary (50th Percentile) £65,000 £67,500 £60,000
Median % change year-on-year -3.70% +12.50% -
75th Percentile £80,000 £82,500 £77,500
90th Percentile £97,500 £95,000 £90,000
UK median annual salary £62,500 £60,500 £62,500
% change year-on-year +3.31% -3.20% +8.70%

All Vendors
Work from Home

Oracle falls under the Vendor Products and Services category. For comparison with the information above, the following table provides summary statistics for all permanent job vacancies with a remote or hybrid options requiring knowledge or experience of all vendor products and services.

Permanent vacancies with a requirement for knowledge or experience of vendor products and services 6,985 14,063 17,156
As % of all permanent jobs with a WFH option 46.04% 41.57% 40.30%
Number of salaries quoted 4,506 10,069 11,423
10th Percentile £25,087 £31,250 £32,500
25th Percentile £37,170 £41,250 £43,750
Median annual salary (50th Percentile) £57,000 £55,000 £59,191
Median % change year-on-year +3.64% -7.08% +2.94%
75th Percentile £72,500 £71,222 £77,500
90th Percentile £93,764 £87,500 £92,500
UK median annual salary £55,000 £50,000 £57,500
% change year-on-year +10.00% -13.04% +4.55%

Oracle
Trend for Jobs with a WFH Option

Job vacancies with remote working options citing Oracle as a proportion of all IT jobs advertised.
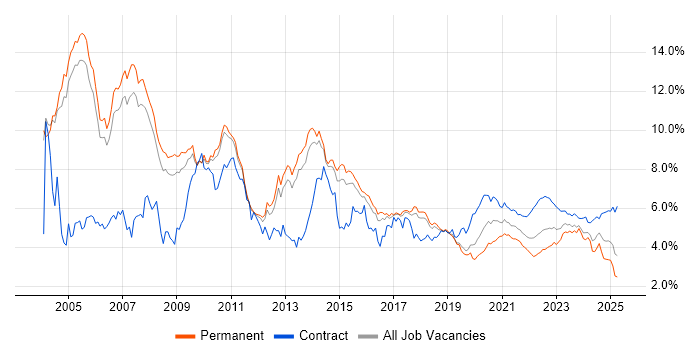
Oracle trend for jobs with Hybrid/Remote/WFH options

Oracle
Salary Trend for Jobs with a WFH Option

3-month moving average salary quoted in job vacancies with remote working options citing Oracle.

Oracle salary trend for jobs with a WFH option

Oracle
Salary Histogram for Jobs with a WFH Option

Salary distribution for jobs with remote working options citing Oracle over the 6 months to 3 May 2025.

Oracle salary histogram for jobs with a WFH option

Oracle
Co-occurring Skills and Capabilities with WFH Options by Category

The follow tables expand on the table above by listing co-occurrences grouped by category. The same employment type, locality and period is covered with up to 20 co-occurrences shown in each of the following categories:

Application Platforms
1 76 (16.38%) Oracle Application Server
2 26 (5.60%) IIS
3 12 (2.59%) Apache
3 12 (2.59%) Tomcat
4 9 (1.94%) Oracle SOA Suite
5 7 (1.51%) Apache Spark
5 7 (1.51%) Confluence
6 6 (1.29%) Oracle Workflow
7 5 (1.08%) NetWeaver
8 4 (0.86%) JBoss
8 4 (0.86%) WebSphere
9 3 (0.65%) GemFire
9 3 (0.65%) SharePoint
10 2 (0.43%) ColdFusion
10 2 (0.43%) Ethereum
10 2 (0.43%) SAS
10 2 (0.43%) WebSphere Application Server
11 1 (0.22%) WebLogic
Applications
1 29 (6.25%) Microsoft Office
2 24 (5.17%) Microsoft Excel
3 12 (2.59%) Microsoft PowerPoint
4 3 (0.65%) Oracle Smart View
4 3 (0.65%) Spreadsheet
5 1 (0.22%) SPSS
Business Applications
1 48 (10.34%) Oracle EBS
2 28 (6.03%) Oracle ERP
3 19 (4.09%) Oracle Applications
4 17 (3.66%) Oracle Payables
5 16 (3.45%) NEC Housing
6 15 (3.23%) Oracle Financials
6 15 (3.23%) Oracle Receivables
7 8 (1.72%) Oracle Subledger Accounting
8 6 (1.29%) Oracle EBS R12
9 5 (1.08%) Oracle Assets
9 5 (1.08%) Oracle General Ledger
10 4 (0.86%) Oracle Retail
10 4 (0.86%) PeopleSoft HCM
11 3 (0.65%) Salesforce CRM
12 2 (0.43%) NetSuite
12 2 (0.43%) Oracle BPM
12 2 (0.43%) Oracle Cash Management
12 2 (0.43%) Oracle Procure-to-Pay
12 2 (0.43%) Payment Gateway
12 2 (0.43%) SAP Business One
Cloud Services
1 89 (19.18%) Azure
2 62 (13.36%) AWS
3 53 (11.42%) SaaS
4 51 (10.99%) OCI
5 32 (6.90%) GCP
6 22 (4.74%) Microsoft 365
7 21 (4.53%) PaaS
8 13 (2.80%) IaaS
9 12 (2.59%) Azure DevOps
9 12 (2.59%) Power Platform
10 8 (1.72%) Cloud Computing
11 6 (1.29%) Entra ID
12 5 (1.08%) Azure Data Factory
12 5 (1.08%) Azure Logic Apps
12 5 (1.08%) GitHub
12 5 (1.08%) Microsoft Copilot
12 5 (1.08%) Power Automate
12 5 (1.08%) Snowflake
13 4 (0.86%) Azure Synapse Analytics
14 3 (0.65%) Nutanix
Communications & Networking
1 15 (3.23%) DNS
2 10 (2.16%) HTTP
3 8 (1.72%) DHCP
3 8 (1.72%) Firewall
3 8 (1.72%) TCP/IP
4 7 (1.51%) NAS
4 7 (1.51%) SAN
4 7 (1.51%) SSL
5 6 (1.29%) VPN
6 5 (1.08%) DMARC
6 5 (1.08%) VSAN
7 3 (0.65%) HTTPS
7 3 (0.65%) IPsec
7 3 (0.65%) SSH
7 3 (0.65%) WAN
8 2 (0.43%) FTP
8 2 (0.43%) iSCSI
8 2 (0.43%) LAN
8 2 (0.43%) Multicast
8 2 (0.43%) Network Security
Database & Business Intelligence
1 101 (21.77%) Oracle Reports
2 92 (19.83%) Data Warehouse
3 90 (19.40%) SQL Server
4 79 (17.03%) Enterprise Data Warehouse
5 53 (11.42%) Oracle Database
6 24 (5.17%) Relational Database
7 23 (4.96%) PostgreSQL
8 19 (4.09%) OLTP
9 18 (3.88%) MongoDB
10 12 (2.59%) Power BI
11 11 (2.37%) MySQL
11 11 (2.37%) Oracle BI Publisher
12 10 (2.16%) Metadata
12 10 (2.16%) SQL Server Integration Services
12 10 (2.16%) Tableau
13 9 (1.94%) Big Data
13 9 (1.94%) SAP BW
14 8 (1.72%) BusinessObjects
15 7 (1.51%) Hadoop
15 7 (1.51%) NoSQL
Development Applications
1 38 (8.19%) Git
1 38 (8.19%) Oracle Forms
2 12 (2.59%) JIRA
2 12 (2.59%) NUnit
3 11 (2.37%) JUnit
4 9 (1.94%) Jenkins
5 8 (1.72%) Team Foundation Server
6 7 (1.51%) Oracle APEX
7 4 (0.86%) Mocha
7 4 (0.86%) Octopus Deploy
7 4 (0.86%) TeamCity
8 3 (0.65%) Visual Studio
9 2 (0.43%) Atlassian Bamboo
9 2 (0.43%) Maven
9 2 (0.43%) Mockito
9 2 (0.43%) SoapUI
9 2 (0.43%) SonarQube
9 2 (0.43%) Sonatype Nexus
9 2 (0.43%) Subversion
9 2 (0.43%) Xcode
General
1 233 (50.22%) Finance
2 209 (45.04%) Social Skills
3 128 (27.59%) Analytical Skills
4 87 (18.75%) Organisational Skills
5 78 (16.81%) Military
6 53 (11.42%) Banking
7 52 (11.21%) Inclusion and Diversity
8 32 (6.90%) Law
9 31 (6.68%) Public Sector
10 28 (6.03%) Manufacturing
11 25 (5.39%) Local Government
11 25 (5.39%) Marketing
12 24 (5.17%) Presentation Skills
13 23 (4.96%) Retail
14 20 (4.31%) Police
15 18 (3.88%) Back Office
16 11 (2.37%) General Ledger
17 9 (1.94%) Investment Banking
18 6 (1.29%) Front Office
19 5 (1.08%) Legal
Job Titles
1 78 (16.81%) Developer
2 74 (15.95%) Senior
3 53 (11.42%) Analyst
4 44 (9.48%) Consultant
5 42 (9.05%) Architect
6 39 (8.41%) Oracle Developer
7 30 (6.47%) Database Engineer
8 28 (6.03%) Lead
9 26 (5.60%) Applications Support
10 25 (5.39%) Senior Developer
10 25 (5.39%) Support Analyst
11 22 (4.74%) Oracle Consultant
12 21 (4.53%) Implementation Consultant
13 20 (4.31%) Cloud Architect
13 20 (4.31%) Senior Oracle Developer
14 19 (4.09%) SQL Developer
15 18 (3.88%) Oracle Analyst
16 17 (3.66%) PL/SQL Developer
16 17 (3.66%) Technical Consultant
17 16 (3.45%) Software Engineer
Libraries, Frameworks & Software Standards
1 55 (11.85%) Oracle Fusion
2 53 (11.42%) .NET
3 34 (7.33%) XML
4 31 (6.68%) SOAP
5 30 (6.47%) Middleware
6 25 (5.39%) Kafka
7 24 (5.17%) HTML
7 24 (5.17%) React
8 19 (4.09%) Node.js
9 18 (3.88%) JSON
9 18 (3.88%) REST
10 15 (3.23%) .NET Core
11 12 (2.59%) Jest
12 11 (2.37%) Web Services
13 7 (1.51%) AngularJS
14 6 (1.29%) CSS
14 6 (1.29%) Express.js
14 6 (1.29%) Spring
15 5 (1.08%) Tailwind CSS
16 4 (0.86%) Kendo UI
Miscellaneous
1 42 (9.05%) Management Information System
2 19 (4.09%) Client/Server
3 16 (3.45%) Cloud Native
4 15 (3.23%) Data Centre
4 15 (3.23%) Private Cloud
5 14 (3.02%) Enterprise Software
5 14 (3.02%) Self-Motivation
6 12 (2.59%) Operational Technology
7 11 (2.37%) Hybrid Cloud
7 11 (2.37%) Onboarding
8 10 (2.16%) Data Structures
8 10 (2.16%) Derivative
8 10 (2.16%) Product Ownership
9 9 (1.94%) Manufacturing Execution System
10 8 (1.72%) Distributed Systems
10 8 (1.72%) Replication
11 7 (1.51%) Foreign Exchange (FX)
11 7 (1.51%) Legacy Systems
11 7 (1.51%) SCADA
12 6 (1.29%) Clustering
Operating Systems
1 78 (16.81%) Linux
2 49 (10.56%) Windows
3 43 (9.27%) Unix
4 17 (3.66%) Windows Server
5 11 (2.37%) AIX
5 11 (2.37%) Red Hat Enterprise Linux
6 6 (1.29%) Oracle Linux
6 6 (1.29%) Solaris
7 3 (0.65%) Windows Server 2008
7 3 (0.65%) Windows Server 2012
7 3 (0.65%) Windows Server 2016
7 3 (0.65%) Windows Server 2019
8 2 (0.43%) CentOS
9 1 (0.22%) Mac OS
Processes & Methodologies
1 154 (33.19%) Agile
2 133 (28.66%) DevOps
3 127 (27.37%) Problem-Solving
4 109 (23.49%) ITIL
5 100 (21.55%) Analytics
6 98 (21.12%) Service Management
7 95 (20.47%) Data Management
8 94 (20.26%) Data Modelling
9 91 (19.61%) Data Integration
10 90 (19.40%) Customer Experience
11 76 (16.38%) Business Analysis
12 63 (13.58%) ERP
13 52 (11.21%) Migration
14 51 (10.99%) Mentoring
15 46 (9.91%) CI/CD
16 44 (9.48%) Business Intelligence
17 43 (9.27%) Continuous Improvement
18 39 (8.41%) Data Migration
19 34 (7.33%) Change Management
20 33 (7.11%) Project Management
Programming Languages
1 192 (41.38%) SQL
2 82 (17.67%) PL/SQL
3 47 (10.13%) Java
4 31 (6.68%) C#
5 30 (6.47%) JavaScript
5 30 (6.47%) Python
6 22 (4.74%) PowerShell
6 22 (4.74%) Shell Script
7 14 (3.02%) T-SQL
8 11 (2.37%) Korn
8 11 (2.37%) TypeScript
9 9 (1.94%) C-shell
10 8 (1.72%) C
10 8 (1.72%) VBA
11 5 (1.08%) R
12 3 (0.65%) C++
12 3 (0.65%) Delphi
12 3 (0.65%) Perl
12 3 (0.65%) PHP
13 2 (0.43%) AWK
Qualifications
1 91 (19.61%) DBS Check
2 34 (7.33%) Degree
3 32 (6.90%) Security Cleared
4 30 (6.47%) SC Cleared
5 17 (3.66%) Computer Science Degree
6 14 (3.02%) ITIL Certification
7 13 (2.80%) Oracle Certification
8 12 (2.59%) TOGAF Certification
9 9 (1.94%) PhD
10 8 (1.72%) PMI Certification
11 7 (1.51%) PMP
12 6 (1.29%) Microsoft Certification
13 5 (1.08%) Azure Certification
13 5 (1.08%) Master's Degree
13 5 (1.08%) VMware Certified Professional (VCP)
14 4 (0.86%) BPSS Clearance
14 4 (0.86%) OCA
14 4 (0.86%) OCP
15 3 (0.65%) DV Cleared
15 3 (0.65%) ITIL Foundation Certificate
Quality Assurance & Compliance
1 23 (4.96%) Accessibility
2 15 (3.23%) QA
2 15 (3.23%) SLA
3 7 (1.51%) Data Quality
4 5 (1.08%) ISO/IEC 27001
5 3 (0.65%) PMO
6 2 (0.43%) Dublin Core
6 2 (0.43%) GDPR
7 1 (0.22%) ISO 15022
7 1 (0.22%) ISO 20022
7 1 (0.22%) PCI DSS
System Software
1 18 (3.88%) Docker
2 13 (2.80%) Active Directory
3 11 (2.37%) VMware Infrastructure
4 5 (1.08%) HDFS
4 5 (1.08%) VMware NSX
5 4 (0.86%) Hyper-V
5 4 (0.86%) KVM
6 3 (0.65%) VMware ESXi
7 2 (0.43%) NFS
7 2 (0.43%) Oracle RAC
7 2 (0.43%) Postfix
7 2 (0.43%) Sendmail
7 2 (0.43%) SRDF
7 2 (0.43%) Veritas Cluster Server
7 2 (0.43%) Xen
8 1 (0.22%) LXC
8 1 (0.22%) Samba
8 1 (0.22%) Virtual Machines
Systems Management
1 18 (3.88%) Kubernetes
2 16 (3.45%) Terraform
3 13 (2.80%) Ansible
4 7 (1.51%) Single Sign-On
5 5 (1.08%) Microsoft Intune
5 5 (1.08%) Progress Chef
5 5 (1.08%) Tivoli Storage Manager
5 5 (1.08%) ZABBIX
6 4 (0.86%) Oracle RMAN
6 4 (0.86%) Puppet
7 3 (0.65%) Grafana
8 2 (0.43%) Microsoft Data Protection Manager
8 2 (0.43%) Nagios
8 2 (0.43%) Nessus
8 2 (0.43%) SCCM
8 2 (0.43%) SCOM
8 2 (0.43%) Systems Management Server (SMS)
8 2 (0.43%) WSUS
9 1 (0.22%) Kibana
Vendors
1 77 (16.59%) Microsoft
2 35 (7.54%) SAP
3 24 (5.17%) IBM
4 23 (4.96%) VMware
5 17 (3.66%) Google
6 16 (3.45%) NEC
7 14 (3.02%) Salesforce
7 14 (3.02%) ServiceNow
8 11 (2.37%) PeopleSoft
9 8 (1.72%) Okta
9 8 (1.72%) Red Hat
10 7 (1.51%) Concur
10 7 (1.51%) Workday
11 6 (1.29%) Informatica
11 6 (1.29%) JD Edwards
11 6 (1.29%) Teradata
12 5 (1.08%) EMC
12 5 (1.08%) Hyperion
13 4 (0.86%) Databricks
13 4 (0.86%) Splunk