Management Information System Jobs with Hybrid/Remote/WFH Options

Management Information Systems
UK > Work from Home

The table below looks at the prevalence of the term Management Information System in remote or hybrid work. Included is a benchmarking guide to the salaries offered in vacancies that cited Management Information System over the 6 months leading up to 7 May 2025, comparing them to the same period in the previous two years.

6 months to
7 May 2025
Same period 2024 Same period 2023
Rank 98 107 123
Rank change year-on-year +9 +16 +30
Permanent jobs citing Management Information System 539 926 1,183
As % of all permanent jobs with a WFH option 3.29% 2.73% 2.79%
As % of the Miscellaneous category 8.53% 7.69% 7.22%
Number of salaries quoted 256 723 709
10th Percentile £28,875 £32,500 £36,250
25th Percentile £45,000 £41,000 £47,500
Median annual salary (50th Percentile) £60,000 £52,500 £61,180
Median % change year-on-year +14.29% -14.19% +5.48%
75th Percentile £68,750 £68,250 £77,715
90th Percentile £84,375 £84,919 £102,500
UK median annual salary £56,000 £50,000 £57,396
% change year-on-year +12.00% -12.89% +4.36%

All Generic Skills
Work from Home

Management Information System falls under the General and Transferable Skills category. For comparison with the information above, the following table provides summary statistics for all permanent job vacancies with remote or hybrid options requiring generic IT skills.

Permanent vacancies with a requirement for generic IT skills 6,321 12,035 16,379
As % of all permanent jobs with a WFH option 38.53% 35.54% 38.65%
Number of salaries quoted 3,873 9,257 11,852
10th Percentile £35,000 £32,500 £39,000
25th Percentile £47,231 £42,500 £48,750
Median annual salary (50th Percentile) £65,000 £59,500 £65,000
Median % change year-on-year +9.24% -8.46% -
75th Percentile £85,000 £78,750 £86,250
90th Percentile £122,500 £101,250 £107,500
UK median annual salary £60,000 £55,000 £65,000
% change year-on-year +9.09% -15.38% +4.00%

Management Information System
Trend for Jobs with a WFH Option

Job vacancies with remote working options citing Management Information System as a proportion of all IT jobs advertised.
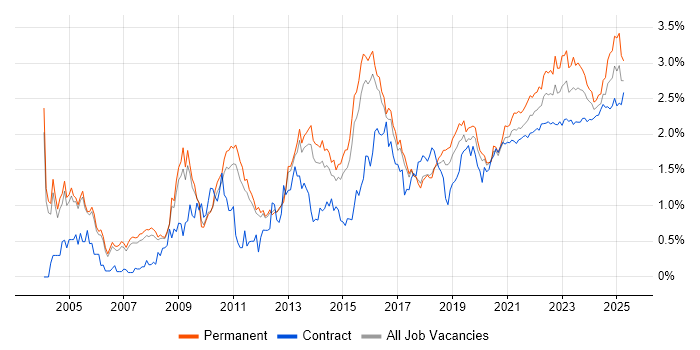
Management Information System trend for jobs with Hybrid/Remote/WFH options

Management Information System
Salary Trend for Jobs with a WFH Option

3-month moving average salary quoted in job vacancies with remote working options citing Management Information System.

Management Information System salary trend for jobs with a WFH option

Management Information System
Salary Histogram for Jobs with a WFH Option

Salary distribution for jobs with remote working options citing Management Information System over the 6 months to 7 May 2025.

Management Information System salary histogram for jobs with a WFH option

Management Information System
Co-occurring Skills and Capabilities with WFH Options by Category

The follow tables expand on the table above by listing co-occurrences grouped by category. The same employment type, locality and period is covered with up to 20 co-occurrences shown in each of the following categories:

Application Platforms
1 29 (5.38%) Microsoft Exchange
2 24 (4.45%) SharePoint
3 20 (3.71%) IIS
4 13 (2.41%) CMS
4 13 (2.41%) Confluence
5 10 (1.86%) Apache
6 7 (1.30%) SAS
6 7 (1.30%) Umbraco
6 7 (1.30%) WordPress
7 3 (0.56%) Apache Airflow
8 2 (0.37%) Apache Spark
8 2 (0.37%) Drupal
8 2 (0.37%) nginx
8 2 (0.37%) ThingWorx
Applications
1 70 (12.99%) Microsoft Excel
2 52 (9.65%) Microsoft Office
3 14 (2.60%) Microsoft PowerPoint
4 7 (1.30%) Microsoft Project
5 6 (1.11%) Trello
6 4 (0.74%) MS Visio
6 4 (0.74%) Spreadsheet
7 2 (0.37%) Notion
8 1 (0.19%) Adobe Illustrator
8 1 (0.19%) Adobe Premiere
8 1 (0.19%) Photoshop
8 1 (0.19%) SPSS
Business Applications
1 6 (1.11%) Dynamics CRM
2 5 (0.93%) Salesforce CRM
3 3 (0.56%) Oracle EBS
4 2 (0.37%) Dynamics AX
4 2 (0.37%) ResourceLink
4 2 (0.37%) SAP Oil and Gas
4 2 (0.37%) SAP S/4HANA
5 1 (0.19%) CiviCRM
5 1 (0.19%) Dynamics NAV
5 1 (0.19%) Infor M3
5 1 (0.19%) SAP ERP
5 1 (0.19%) SystmOne
Cloud Services
1 151 (28.01%) AWS
2 139 (25.79%) Azure
3 90 (16.70%) Power Platform
4 57 (10.58%) Microsoft 365
5 56 (10.39%) GCP
6 54 (10.02%) SaaS
7 38 (7.05%) PaaS
8 31 (5.75%) Serverless
9 29 (5.38%) AWS Lambda
10 25 (4.64%) PowerApps
11 23 (4.27%) Azure DevOps
11 23 (4.27%) IaaS
12 21 (3.90%) Cloud Computing
13 20 (3.71%) Dynamics 365
14 18 (3.34%) Datadog
15 17 (3.15%) Power Automate
16 16 (2.97%) Amazon EC2
17 15 (2.78%) Amazon S3
18 14 (2.60%) Amazon EKS
19 13 (2.41%) GitHub
Communications & Networking
1 55 (10.20%) Firewall
2 40 (7.42%) Network Security
3 19 (3.53%) TCP/IP
4 17 (3.15%) DNS
5 16 (2.97%) VPN
6 14 (2.60%) WAN
6 14 (2.60%) Wi-Fi
7 11 (2.04%) SD-WAN
8 10 (1.86%) LAN
9 9 (1.67%) DHCP
10 8 (1.48%) BGP
10 8 (1.48%) Cisco ASA
10 8 (1.48%) Cisco Firepower
10 8 (1.48%) Intrusion Detection
10 8 (1.48%) IPsec
10 8 (1.48%) MPLS
10 8 (1.48%) NX-OS
10 8 (1.48%) OSPF
10 8 (1.48%) WLAN
11 5 (0.93%) Internet
Database & Business Intelligence
1 74 (13.73%) Power BI
2 39 (7.24%) SQL Server
3 38 (7.05%) Data Warehouse
4 27 (5.01%) NoSQL
5 21 (3.90%) Relational Database
6 15 (2.78%) Data Lake
7 10 (1.86%) Oracle Reports
8 9 (1.67%) Big Data
8 9 (1.67%) SQL Server Integration Services
8 9 (1.67%) SQL Server Reporting Services
8 9 (1.67%) Star Schema
9 8 (1.48%) Metadata
9 8 (1.48%) MySQL
9 8 (1.48%) Tick Data
10 7 (1.30%) Data Mining
10 7 (1.30%) Tableau
11 6 (1.11%) Hadoop
12 4 (0.74%) MariaDB
12 4 (0.74%) Neo4j
12 4 (0.74%) SAP HANA
Development Applications
1 42 (7.79%) Git
2 39 (7.24%) Jenkins
3 22 (4.08%) JIRA
4 16 (2.97%) GitLab
5 14 (2.60%) Cucumber
5 14 (2.60%) IntelliJ
5 14 (2.60%) JUnit
5 14 (2.60%) Maven
5 14 (2.60%) Mockito
5 14 (2.60%) SonarQube
6 10 (1.86%) SQL Server Management Studio (SSMS)
7 5 (0.93%) AppScan
7 5 (0.93%) Atlassian Bamboo
8 2 (0.37%) Babel
8 2 (0.37%) gulp
8 2 (0.37%) webpack
9 1 (0.19%) Bitbucket
9 1 (0.19%) kappa
General
1 181 (33.58%) Finance
2 171 (31.73%) Social Skills
3 64 (11.87%) Analytical Skills
4 49 (9.09%) Inclusion and Diversity
5 39 (7.24%) Banking
6 33 (6.12%) Public Sector
7 32 (5.94%) Law
8 23 (4.27%) Marketing
9 22 (4.08%) Retail
10 21 (3.90%) German Language
11 18 (3.34%) Legal
11 18 (3.34%) Telecoms
12 17 (3.15%) Organisational Skills
13 14 (2.60%) Back Office
14 11 (2.04%) Influencing Skills
14 11 (2.04%) Tech for Good
15 9 (1.67%) Advertising
15 9 (1.67%) Manufacturing
15 9 (1.67%) Presentation Skills
16 7 (1.30%) Military
Job Titles
1 93 (17.25%) Analyst
2 73 (13.54%) Senior
3 59 (10.95%) Architect
4 45 (8.35%) Lead
5 38 (7.05%) Developer
6 34 (6.31%) Data Analyst
7 32 (5.94%) AWS Architect
8 29 (5.38%) Solutions Architect
9 26 (4.82%) Procurement Analyst
10 21 (3.90%) AWS DevOps
10 21 (3.90%) Information Security Specialist
10 21 (3.90%) Information Specialist
10 21 (3.90%) Security Engineer
10 21 (3.90%) Security Specialist
10 21 (3.90%) Senior DevOps
11 19 (3.53%) Cloud Architect
11 19 (3.53%) Cloud Engineer
11 19 (3.53%) Development Manager
12 18 (3.34%) Administrator
13 17 (3.15%) ETL Developer
Libraries, Frameworks & Software Standards
1 30 (5.57%) .NET
2 21 (3.90%) Elastic Stack
2 21 (3.90%) SailPoint
3 20 (3.71%) Node.js
4 17 (3.15%) Kafka
5 15 (2.78%) Spring
6 14 (2.60%) ActiveMQ
6 14 (2.60%) JMS
6 14 (2.60%) Spring Boot
7 13 (2.41%) HTML
8 12 (2.23%) EDI
9 11 (2.04%) Azure Blueprints
10 9 (1.67%) CSS
10 9 (1.67%) XML
11 8 (1.48%) ARM Templates
12 5 (0.93%) React
12 5 (0.93%) REST
13 4 (0.74%) Leaflet
13 4 (0.74%) NumPy
13 4 (0.74%) Pandas
Miscellaneous
1 37 (6.86%) Virtual Team
2 34 (6.31%) Data Centre
3 31 (5.75%) Onboarding
4 26 (4.82%) Enterprise Software
5 24 (4.45%) Public Cloud
6 20 (3.71%) Cloud Native
7 19 (3.53%) Client/Server
7 19 (3.53%) Self-Motivation
8 17 (3.15%) Product Ownership
8 17 (3.15%) Security Posture
9 14 (2.60%) Credit Derivative
9 14 (2.60%) Private Cloud
10 13 (2.41%) Hybrid Cloud
11 10 (1.86%) NHS
11 10 (1.86%) Social Media
12 9 (1.67%) CSOC
13 8 (1.48%) Cyber Threat
13 8 (1.48%) Operational Technology
14 7 (1.30%) Clustering
14 7 (1.30%) Tandem
Operating Systems
1 91 (16.88%) Linux
2 75 (13.91%) Windows
3 20 (3.71%) Windows Server
4 14 (2.60%) Windows 10
5 12 (2.23%) Unix
6 10 (1.86%) Red Hat Enterprise Linux
7 9 (1.67%) Ubuntu
8 8 (1.48%) AIX
9 7 (1.30%) Mac OS
10 6 (1.11%) CentOS
11 5 (0.93%) VMS
12 4 (0.74%) Robot Operating System
12 4 (0.74%) Windows Server 2016
13 3 (0.56%) Windows Server 2019
14 2 (0.37%) Oracle Linux
15 1 (0.19%) Debian
15 1 (0.19%) Mac OS X
15 1 (0.19%) Windows 7
Processes & Methodologies
1 133 (24.68%) Analytics
2 119 (22.08%) DevOps
3 118 (21.89%) Information Security
4 105 (19.48%) Risk Management
5 101 (18.74%) Cybersecurity
6 95 (17.63%) Agile
7 91 (16.88%) Problem-Solving
8 89 (16.51%) Computer Science
9 88 (16.33%) Data Management
10 84 (15.58%) Mentoring
11 80 (14.84%) Continuous Improvement
12 74 (13.73%) CI/CD
13 71 (13.17%) Change Management
13 71 (13.17%) ITIL
14 69 (12.80%) Software Engineering
15 67 (12.43%) Decision-Making
16 64 (11.87%) Data Analysis
17 63 (11.69%) Project Management
18 57 (10.58%) Process Improvement
19 56 (10.39%) Infrastructure as Code
Programming Languages
1 88 (16.33%) Python
2 82 (15.21%) SQL
3 56 (10.39%) Java
4 46 (8.53%) PowerShell
5 17 (3.15%) T-SQL
6 16 (2.97%) C++
7 13 (2.41%) R
8 12 (2.23%) JavaScript
9 11 (2.04%) C#
10 10 (1.86%) Bash
11 5 (0.93%) Perl
11 5 (0.93%) Shell Script
12 4 (0.74%) TypeScript
13 2 (0.37%) AWK
13 2 (0.37%) C
13 2 (0.37%) Korn
13 2 (0.37%) Kusto Query Language
13 2 (0.37%) PHP
13 2 (0.37%) VB.NET
14 1 (0.19%) Bicep
Qualifications
1 185 (34.32%) Degree
2 51 (9.46%) Security Cleared
3 37 (6.86%) Computer Science Degree
4 36 (6.68%) AWS Certification
5 29 (5.38%) CISSP
6 28 (5.19%) SC Cleared
7 23 (4.27%) ITIL Certification
8 21 (3.90%) AWS Certified Solutions Architect
9 17 (3.15%) Cisco Certification
9 17 (3.15%) Master's Degree
10 15 (2.78%) DBS Check
11 14 (2.60%) CISM
11 14 (2.60%) Microsoft Certification
12 11 (2.04%) BPSS Clearance
13 10 (1.86%) Azure Certification
14 9 (1.67%) MCP
14 9 (1.67%) PMI Certification
14 9 (1.67%) PMP
15 8 (1.48%) CISA
15 8 (1.48%) CompTIA Security+
Quality Assurance & Compliance
1 63 (11.69%) GDPR
2 55 (10.20%) Data Quality
3 46 (8.53%) ISO/IEC 27001
4 32 (5.94%) NIST
4 32 (5.94%) SLA
5 22 (4.08%) HIPAA
6 21 (3.90%) Accessibility
7 16 (2.97%) Cyber Essentials
8 14 (2.60%) NCSC
8 14 (2.60%) PCI DSS
9 11 (2.04%) COBIT
10 8 (1.48%) ISO/IEC 27002 (supersedes ISO/IEC 17799)
10 8 (1.48%) QA
11 7 (1.30%) Basel II
11 7 (1.30%) Basel III
11 7 (1.30%) Dodd-Frank
11 7 (1.30%) IFRS
11 7 (1.30%) IFRS 9
12 6 (1.11%) Sarbanes-Oxley
13 5 (0.93%) GRC
System Software
1 56 (10.39%) Active Directory
2 44 (8.16%) Docker
3 21 (3.90%) VMware Infrastructure
4 13 (2.41%) Hyper-V
5 4 (0.74%) Firmware
5 4 (0.74%) Virtual Machines
5 4 (0.74%) Virtual Servers
5 4 (0.74%) VMware ESXi
5 4 (0.74%) vSphere
6 3 (0.56%) Veritas Cluster Server
7 2 (0.37%) KVM
7 2 (0.37%) Postfix
7 2 (0.37%) Sendmail
Systems Management
1 63 (11.69%) Terraform
2 61 (11.32%) Kubernetes
3 51 (9.46%) Ansible
4 20 (3.71%) Prometheus
5 18 (3.34%) Grafana
6 12 (2.23%) SCCM
7 9 (1.67%) Puppet
7 9 (1.67%) QRadar
8 7 (1.30%) PaperCut
8 7 (1.30%) Progress Chef
9 6 (1.11%) Microsoft Intune
10 5 (0.93%) ZABBIX
11 4 (0.74%) Failover Clustering
11 4 (0.74%) Single Sign-On
12 3 (0.56%) CASB
12 3 (0.56%) FortiGate
12 3 (0.56%) Istio
12 3 (0.56%) linkerd
12 3 (0.56%) Nagios
13 2 (0.37%) NetBackup
Vendors
1 154 (28.57%) Microsoft
2 54 (10.02%) Salesforce
3 48 (8.91%) SAP
4 42 (7.79%) Google
4 42 (7.79%) Oracle
5 27 (5.01%) VMware
6 24 (4.45%) IBM
7 22 (4.08%) Okta
8 19 (3.53%) Cisco
9 17 (3.15%) Databricks
10 16 (2.97%) ServiceNow
11 12 (2.23%) Red Hat
12 8 (1.48%) CheckPoint
12 8 (1.48%) Dynatrace
12 8 (1.48%) Infoblox
12 8 (1.48%) Meraki
12 8 (1.48%) SolarWinds
13 7 (1.30%) YouTube
14 6 (1.11%) Atlassian
14 6 (1.11%) Citrix