Roadmaps Jobs with Hybrid/Remote/WFH Options

Roadmaps
UK > Work from Home

The table below provides summary statistics for permanent remote or hybrid work requiring Roadmaps skills. It includes a benchmarking guide to the annual salaries offered in vacancies that cited Roadmaps over the 6 months leading up to 17 May 2025, comparing them to the same period in the previous two years.

6 months to
17 May 2025
Same period 2024 Same period 2023
Rank 21 27 20
Rank change year-on-year +6 -7 +6
Permanent jobs citing Roadmaps 2,007 2,481 4,242
As % of all permanent jobs with a WFH option 10.78% 7.34% 10.44%
As % of the Processes & Methodologies category 11.44% 8.05% 10.87%
Number of salaries quoted 723 1,565 2,262
10th Percentile £47,500 £42,238 £48,750
25th Percentile £61,250 £52,500 £57,150
Median annual salary (50th Percentile) £78,500 £67,500 £75,000
Median % change year-on-year +16.30% -10.00% +7.14%
75th Percentile £115,000 £85,000 £93,750
90th Percentile £141,056 £105,000 £115,000
UK median annual salary £75,874 £70,000 £72,500
% change year-on-year +8.39% -3.45% +3.57%

All Process and Methodology Skills
Work from Home

Roadmaps falls under the Processes and Methodologies category. For comparison with the information above, the following table provides summary statistics for all permanent job vacancies with remote or hybrid options requiring process or methodology skills.

Permanent vacancies with a requirement for process or methodology skills 17,539 30,831 39,032
As % of all permanent jobs with a WFH option 94.25% 91.25% 96.06%
Number of salaries quoted 9,801 23,355 27,082
10th Percentile £28,500 £33,750 £37,500
25th Percentile £42,500 £42,500 £47,500
Median annual salary (50th Percentile) £60,000 £57,500 £62,500
Median % change year-on-year +4.35% -8.00% +4.17%
75th Percentile £77,500 £75,000 £82,500
90th Percentile £101,250 £95,000 £100,000
UK median annual salary £57,500 £55,000 £61,000
% change year-on-year +4.55% -9.84% +1.67%

Roadmaps
Trend for Jobs with a WFH Option

Job vacancies with remote working options citing Roadmaps as a proportion of all IT jobs advertised.
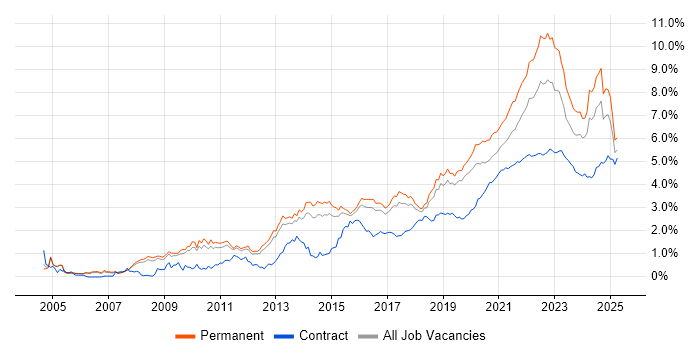
Roadmaps trend for jobs with Hybrid/Remote/WFH options

Roadmaps
Salary Trend for Jobs with a WFH Option

3-month moving average salary quoted in job vacancies with remote working options citing Roadmaps.

Roadmaps salary trend for jobs with a WFH option

Roadmaps
Salary Histogram for Jobs with a WFH Option

Salary distribution for jobs with remote working options citing Roadmaps over the 6 months to 17 May 2025.

Roadmaps salary histogram for jobs with a WFH option

Roadmaps
Co-occurring Skills and Capabilities with WFH Options by Category

The follow tables expand on the table above by listing co-occurrences grouped by category. The same employment type, locality and period is covered with up to 20 co-occurrences shown in each of the following categories:

Application Platforms
1 36 (1.79%) SharePoint
2 23 (1.15%) CMS
3 11 (0.55%) IIS
4 10 (0.50%) Confluence
5 8 (0.40%) Tomcat
6 7 (0.35%) Microsoft Exchange
7 6 (0.30%) Apache Spark
7 6 (0.30%) Kentico
7 6 (0.30%) WordPress
8 5 (0.25%) Apache
8 5 (0.25%) Umbraco
9 4 (0.20%) IBM Domino
10 3 (0.15%) Drupal
10 3 (0.15%) SAS
11 2 (0.100%) Apache Solr
11 2 (0.100%) Sitecore CMS
11 2 (0.100%) WebSphere
12 1 (0.050%) nginx
12 1 (0.050%) OpenStack
12 1 (0.050%) Oracle Workflow
Applications
1 23 (1.15%) Microsoft Office
2 18 (0.90%) Microsoft Excel
3 10 (0.50%) Trello
4 8 (0.40%) Chatbot
4 8 (0.40%) Microsoft Project
5 7 (0.35%) Microsoft PowerPoint
6 5 (0.25%) MS Visio
Business Applications
1 17 (0.85%) Dynamics CRM
2 13 (0.65%) SAP S/4HANA
3 8 (0.40%) SAP FI
4 6 (0.30%) SAP CO
4 6 (0.30%) SAP FI/CO
5 5 (0.25%) Magento
6 4 (0.20%) SAP SCM
6 4 (0.20%) Shopify
7 3 (0.15%) Dynamics AX
7 3 (0.15%) NetSuite
7 3 (0.15%) SAP Oil and Gas
8 2 (0.100%) SAP PM
9 1 (0.050%) Dynamics GP
9 1 (0.050%) Dynamics NAV
9 1 (0.050%) Oracle EBS
9 1 (0.050%) Oracle EBS R12
9 1 (0.050%) Sage 200
9 1 (0.050%) Salesforce CRM
9 1 (0.050%) SAP EWM
9 1 (0.050%) SAP SD
Cloud Services
1 386 (19.23%) AWS
2 217 (10.81%) Pulumi
3 187 (9.32%) Azure
4 111 (5.53%) SaaS
5 73 (3.64%) Microsoft 365
6 63 (3.14%) Power Platform
7 52 (2.59%) Entra ID
8 51 (2.54%) GCP
9 39 (1.94%) Power Automate
10 32 (1.59%) PaaS
11 29 (1.44%) Azure DevOps
12 22 (1.10%) Dynamics 365
13 20 (1.00%) IaaS
14 19 (0.95%) Serverless
15 18 (0.90%) Azure AI
15 18 (0.90%) Azure Monitor
15 18 (0.90%) PowerApps
16 17 (0.85%) Azure Key Vault
16 17 (0.85%) Azure Service Bus
16 17 (0.85%) GitHub
Communications & Networking
1 988 (49.23%) Broadband
2 37 (1.84%) Firewall
3 31 (1.54%) WAN
4 25 (1.25%) VPN
5 22 (1.10%) DNS
6 19 (0.95%) SD-WAN
7 16 (0.80%) Internet
8 15 (0.75%) LAN
9 13 (0.65%) Network Security
10 10 (0.50%) SSL
11 9 (0.45%) Wireless
12 8 (0.40%) DMARC
13 7 (0.35%) Wi-Fi
14 6 (0.30%) Bluetooth
15 4 (0.20%) BGP
15 4 (0.20%) Cisco ISE
15 4 (0.20%) DHCP
15 4 (0.20%) MPLS
15 4 (0.20%) OSPF
15 4 (0.20%) TCP/IP
Database & Business Intelligence
1 234 (11.66%) NoSQL
2 229 (11.41%) Relational Database
3 225 (11.21%) RDBMS
4 137 (6.83%) Data Lake
5 52 (2.59%) Power BI
6 32 (1.59%) PostgreSQL
6 32 (1.59%) SQL Server
7 25 (1.25%) MySQL
7 25 (1.25%) Tableau
8 19 (0.95%) Data Warehouse
9 18 (0.90%) MongoDB
10 12 (0.60%) Looker
11 10 (0.50%) BigQuery
12 7 (0.35%) SQL Server Integration Services
13 6 (0.30%) SQL Server Reporting Services
14 5 (0.25%) Amazon RDS
15 4 (0.20%) Data Mining
15 4 (0.20%) Elasticsearch
15 4 (0.20%) Metadata
16 3 (0.15%) Amazon Athena
Development Applications
1 271 (13.50%) JIRA
2 215 (10.71%) Jaeger
3 45 (2.24%) Git
4 13 (0.65%) Jenkins
5 8 (0.40%) Maven
5 8 (0.40%) Oracle Forms
6 6 (0.30%) GitLab
7 4 (0.20%) ER Studio
7 4 (0.20%) Postman
7 4 (0.20%) SoapUI
8 3 (0.15%) TeamCity
8 3 (0.15%) Visual Studio
9 2 (0.100%) ERwin
9 2 (0.100%) MSBuild
9 2 (0.100%) Storybook
9 2 (0.100%) webpack
10 1 (0.050%) Bitbucket
10 1 (0.050%) Cypress.io
10 1 (0.050%) Eclipse
10 1 (0.050%) Selenium
General
1 854 (42.55%) Social Skills
2 328 (16.34%) Finance
3 284 (14.15%) Inclusion and Diversity
4 143 (7.13%) Analytical Skills
5 107 (5.33%) Front Office
6 104 (5.18%) Marketing
7 94 (4.68%) Banking
8 83 (4.14%) Multimedia
9 62 (3.09%) Presentation Skills
10 58 (2.89%) Retail
11 43 (2.14%) Public Sector
12 41 (2.04%) Law
13 31 (1.54%) Organisational Skills
14 28 (1.40%) Legal
15 27 (1.35%) Influencing Skills
16 25 (1.25%) Manufacturing
17 14 (0.70%) Advertising
17 14 (0.70%) Electronics
17 14 (0.70%) Games
18 12 (0.60%) Pharmaceutical
Job Titles
1 626 (31.19%) Lead
2 295 (14.70%) Team Leader
3 218 (10.86%) Embedded Engineer
4 215 (10.71%) Release Engineer
5 176 (8.77%) Architect
6 157 (7.82%) Systems Engineer
7 109 (5.43%) Senior
8 105 (5.23%) Engineering Manager
9 98 (4.88%) Product Manager
10 69 (3.44%) Solutions Architect
11 49 (2.44%) Software Engineer
12 47 (2.34%) Analyst
13 45 (2.24%) Product Owner
14 44 (2.19%) Enterprise Architect
15 40 (1.99%) Developer
16 37 (1.84%) Consultant
17 33 (1.64%) IT Manager
18 32 (1.59%) Data Governance Analyst
18 32 (1.59%) Data Governance Manager
18 32 (1.59%) Governance Manager
Libraries, Frameworks & Software Standards
1 217 (10.81%) Elastic Stack
1 217 (10.81%) Middleware
2 215 (10.71%) OpenTelemetry
3 56 (2.79%) React
4 45 (2.24%) .NET
5 28 (1.40%) Node.js
5 28 (1.40%) REST
6 26 (1.30%) HTML
7 25 (1.25%) CSS
8 22 (1.10%) Kafka
9 19 (0.95%) AngularJS
9 19 (0.95%) RESTful
10 18 (0.90%) SOAP
11 14 (0.70%) XML
12 13 (0.65%) .NET Core
12 13 (0.65%) JSON
12 13 (0.65%) Laravel
13 12 (0.60%) Vue
14 11 (0.55%) React Native
15 10 (0.50%) TensorFlow
Miscellaneous
1 221 (11.01%) Embedded Systems
2 157 (7.82%) Product Ownership
3 106 (5.28%) Derivative
3 106 (5.28%) Equities
3 106 (5.28%) Fixed Income
3 106 (5.28%) Foreign Exchange (FX)
3 106 (5.28%) Hedge funds
4 43 (2.14%) Management Information System
5 39 (1.94%) Cloud Native
6 34 (1.69%) Public Cloud
7 31 (1.54%) Enterprise Software
8 30 (1.49%) Data Centre
9 27 (1.35%) Self-Motivation
9 27 (1.35%) Virtual Team
10 24 (1.20%) Distributed Systems
10 24 (1.20%) NHS
11 22 (1.10%) Onboarding
11 22 (1.10%) Private Cloud
12 20 (1.00%) Algorithms
12 20 (1.00%) Security Posture
Operating Systems
1 260 (12.95%) Linux
2 234 (11.66%) Unix
3 40 (1.99%) Windows
4 24 (1.20%) Android
5 16 (0.80%) Apple iOS
6 10 (0.50%) Red Hat Enterprise Linux
6 10 (0.50%) Windows Server
7 8 (0.40%) zOS
8 4 (0.20%) Oracle Linux
8 4 (0.20%) Ubuntu
9 3 (0.15%) FreeRTOS
10 2 (0.100%) AIX
10 2 (0.100%) CentOS
10 2 (0.100%) Mac OS
10 2 (0.100%) Windows Server 2019
10 2 (0.100%) Windows Vista
11 1 (0.050%) Amazon Linux
11 1 (0.050%) Debian
11 1 (0.050%) VMS
11 1 (0.050%) Windows Server 2016
Processes & Methodologies
1 902 (44.94%) Mentoring
2 852 (42.45%) Agile
3 845 (42.10%) Product Management
4 780 (38.86%) High Availability
5 775 (38.61%) Problem-Solving
6 639 (31.84%) Computer Science
7 557 (27.75%) Broadcast Engineering
8 358 (17.84%) DevOps
9 316 (15.74%) Artificial Intelligence
10 310 (15.45%) CI/CD
11 274 (13.65%) Strategic Thinking
12 265 (13.20%) Infrastructure as Code
13 261 (13.00%) Containerisation
14 235 (11.71%) Continuous Integration
15 227 (11.31%) Resource Management
16 224 (11.16%) Performance Optimisation
17 223 (11.11%) Software Delivery
18 221 (11.01%) Cost Optimisation
19 219 (10.91%) Task Automation
20 215 (10.71%) Release Automation
Programming Languages
1 321 (15.99%) Python
2 294 (14.65%) JavaScript
3 273 (13.60%) Java
4 228 (11.36%) Go
5 224 (11.16%) Bash
6 119 (5.93%) SQL
7 59 (2.94%) C#
8 42 (2.09%) PowerShell
9 36 (1.79%) TypeScript
10 30 (1.49%) PHP
11 21 (1.05%) Bicep
12 18 (0.90%) C++
13 14 (0.70%) C
14 11 (0.55%) Kotlin
14 11 (0.55%) Perl
15 8 (0.40%) Ruby
15 8 (0.40%) VBA
16 7 (0.35%) PL/SQL
17 5 (0.25%) R
17 5 (0.25%) Rust
Qualifications
1 713 (35.53%) Degree
2 593 (29.55%) Computer Science Degree
3 240 (11.96%) AWS Certification
4 46 (2.29%) DBS Check
4 46 (2.29%) Security Cleared
5 36 (1.79%) Azure Certification
6 30 (1.49%) SC Cleared
7 26 (1.30%) CISSP
8 23 (1.15%) Master's Degree
9 17 (0.85%) PMI Certification
10 16 (0.80%) PMP
11 13 (0.65%) AWS Certified Solutions Architect
11 13 (0.65%) PhD
12 11 (0.55%) CISM
12 11 (0.55%) CSPO
12 11 (0.55%) TOGAF Certification
13 10 (0.50%) AWS Certified Cloud Practitioner
14 6 (0.30%) Six Sigma Black Belt
15 5 (0.25%) BPSS Clearance
15 5 (0.25%) Cisco Certification
Quality Assurance & Compliance
1 52 (2.59%) MiFID
2 36 (1.79%) ISO/IEC 27001
3 34 (1.69%) QA
4 29 (1.44%) GDPR
5 27 (1.35%) NIST
6 22 (1.10%) Accessibility
7 17 (0.85%) Data Quality
8 15 (0.75%) Cyber Essentials
9 14 (0.70%) HIPAA
10 11 (0.55%) PMO
11 8 (0.40%) Cyber Essentials PLUS
11 8 (0.40%) PCI DSS
12 6 (0.30%) COBIT
12 6 (0.30%) Def Stans
12 6 (0.30%) NIST 800
12 6 (0.30%) Sarbanes-Oxley
12 6 (0.30%) SOC 2
13 5 (0.25%) 21 CFR Part 11
13 5 (0.25%) IFRS
13 5 (0.25%) IFRS 9
System Software
1 279 (13.90%) Docker
2 30 (1.49%) Active Directory
3 23 (1.15%) Virtual Machines
4 8 (0.40%) VMware Infrastructure
5 3 (0.15%) KVM
6 2 (0.100%) Postfix
6 2 (0.100%) Sendmail
6 2 (0.100%) vSphere
7 1 (0.050%) Forefront TMG
7 1 (0.050%) ISA Server
7 1 (0.050%) Virtual Desktop
7 1 (0.050%) Xen
Systems Management
1 280 (13.95%) Kubernetes
2 266 (13.25%) Terraform
3 231 (11.51%) Ansible
4 216 (10.76%) Prometheus
5 215 (10.71%) Argo
5 215 (10.71%) Kustomize
6 25 (1.25%) Single Sign-On
7 12 (0.60%) Microsoft Intune
8 6 (0.30%) Puppet
9 4 (0.20%) Automic
9 4 (0.20%) Progress Chef
10 3 (0.15%) Grafana
11 2 (0.100%) AWS Copilot
11 2 (0.100%) FortiGate
11 2 (0.100%) Jamf Pro
11 2 (0.100%) Nagios
11 2 (0.100%) Nessus
11 2 (0.100%) SCCM
11 2 (0.100%) Tivoli NetView
12 1 (0.050%) CASB
Vendors
1 295 (14.70%) Google
2 134 (6.68%) Microsoft
3 44 (2.19%) SAP
4 40 (1.99%) Databricks
5 33 (1.64%) Oracle
6 32 (1.59%) Salesforce
7 23 (1.15%) Cisco
8 21 (1.05%) IBM
8 21 (1.05%) Meraki
9 16 (0.80%) ServiceNow
9 16 (0.80%) VMware
10 14 (0.70%) Palo Alto
11 13 (0.65%) Fortinet
12 9 (0.45%) Apple
12 9 (0.45%) Avaloq
13 8 (0.40%) Anaplan
13 8 (0.40%) Aruba
13 8 (0.40%) Informatica
13 8 (0.40%) Mellanox
13 8 (0.40%) NVIDIA