DevSecOps
UK

The following table provides summary statistics for permanent job vacancies with a requirement for DevSecOps skills. Included is a benchmarking guide to the salaries offered in vacancies that have cited DevSecOps over the 6 months to 11 May 2024 with a comparison to the same period in the previous 2 years.

6 months to
11 May 2024
Same period 2023 Same period 2022
Rank 452 352 492
Rank change year-on-year -100 +140 -92
Permanent jobs citing DevSecOps 519 960 1,108
As % of all permanent jobs advertised in the UK 0.52% 0.95% 0.70%
As % of the Processes & Methodologies category 0.61% 1.00% 0.73%
Number of salaries quoted 330 466 595
10th Percentile £48,625 £47,500 £48,750
25th Percentile £56,375 £63,750 £63,270
Median annual salary (50th Percentile) £75,000 £81,928 £80,000
Median % change year-on-year -8.46% +2.41% +6.67%
75th Percentile £97,500 £100,000 £97,500
90th Percentile £107,578 £113,750 £122,500
UK excluding London median annual salary £67,500 £75,000 £70,000
% change year-on-year -10.00% +7.14% +12.00%

All Process and Methodology Skills
UK

DevSecOps is in the Processes and Methodologies category. The following table is for comparison with the above and provides summary statistics for all permanent job vacancies with a requirement for process or methodology skills.

Permanent vacancies with a requirement for process or methodology skills 84,921 96,445 150,777
As % of all permanent jobs advertised in the UK 85.57% 95.59% 95.69%
Number of salaries quoted 59,902 56,808 82,456
10th Percentile £29,010 £34,000 £33,645
25th Percentile £40,000 £45,000 £43,750
Median annual salary (50th Percentile) £55,000 £61,000 £60,000
Median % change year-on-year -9.84% +1.67% +9.09%
75th Percentile £72,500 £81,250 £80,000
90th Percentile £92,500 £100,000 £96,250
UK excluding London median annual salary £50,000 £55,000 £52,500
% change year-on-year -9.09% +4.76% +10.53%

DevSecOps
Job Vacancy Trend

Job postings citing DevSecOps as a proportion of all IT jobs advertised.
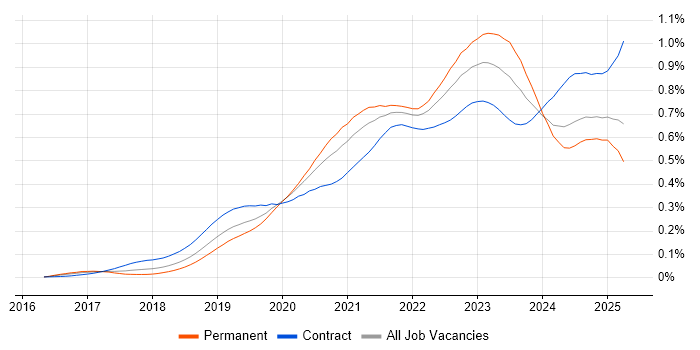
Job vacancy trend for DevSecOps in the UK

DevSecOps
Salary Trend

3-month moving average salary quoted in jobs citing DevSecOps.

Salary trend for DevSecOps in the UK

DevSecOps
Salary Histogram

Salary distribution for jobs citing DevSecOps over the 6 months to 11 May 2024.

Salary histogram for DevSecOps in the UK

DevSecOps
Top 16 Job Locations

The table below looks at the demand and provides a guide to the median salaries quoted in IT jobs citing DevSecOps within the UK over the 6 months to 11 May 2024. The 'Rank Change' column provides an indication of the change in demand within each location based on the same 6 month period last year.

Location Rank Change
on Same Period
Last Year
Matching
Permanent
IT Job Ads
Median Salary
Past 6 Months
Median Salary
% Change
on Same Period
Last Year
Live
Jobs
England -90 462 £75,000 -8.46% 135
UK excluding London -89 273 £67,500 -10.00% 75
Work from Home -73 221 £82,500 +9.03% 77
London -44 210 £92,500 +2.78% 60
South East +9 93 £64,250 -24.41% 22
South West -9 59 £75,000 +33.33% 18
Midlands -1 51 £72,500 -3.33% 13
West Midlands +21 40 £72,500 -3.33% 10
North of England -91 36 £65,000 -13.33% 11
Scotland -65 21 £60,000 -20.00% 6
Yorkshire +12 14 £55,173 -33.12% 7
North West -68 14 £65,000 -3.70% 2
East Midlands -22 11 £72,500 -3.33% 3
North East +2 8 £70,000 -1.75% 2
Wales -2 8 - - 3
East of England +21 7 £55,173 -21.18% 4

DevSecOps
Co-occurring Skills and Capabilities by Category

The follow tables expand on the table above by listing co-occurrences grouped by category. The same employment type, locality and period is covered with up to 20 co-occurrences shown in each of the following categories:

Application Platforms
1 12 (2.31%) Confluence
2 9 (1.73%) SharePoint
3 6 (1.16%) Microsoft Exchange
4 5 (0.96%) Apache
5 2 (0.39%) Apache Airflow
5 2 (0.39%) CMS
6 1 (0.19%) ArcGIS
6 1 (0.19%) Ethereum
6 1 (0.19%) nginx
6 1 (0.19%) Tomcat
6 1 (0.19%) WordPress
Applications
1 5 (0.96%) Microsoft Project
2 3 (0.58%) MS Visio
Business Applications
1 14 (2.70%) Dynamics CRM
2 4 (0.77%) SAP S/4HANA
Cloud Services
1 227 (43.74%) Azure
2 209 (40.27%) AWS
3 68 (13.10%) Serverless
4 53 (10.21%) GitHub
5 51 (9.83%) AWS CloudFormation
5 51 (9.83%) SaaS
6 47 (9.06%) PaaS
7 45 (8.67%) AWS Lambda
8 44 (8.48%) GCP
9 38 (7.32%) Azure AKS
10 36 (6.94%) Azure DevOps
11 29 (5.59%) IaaS
12 28 (5.39%) Amazon S3
13 27 (5.20%) Amazon EKS
14 23 (4.43%) CloudFront
14 23 (4.43%) GitHub Actions
14 23 (4.43%) Microsoft 365
15 22 (4.24%) Amazon ECS
15 22 (4.24%) Entra ID
16 21 (4.05%) Azure Functions
Communications & Networking
1 93 (17.92%) Firewall
2 55 (10.60%) DNS
3 48 (9.25%) WAN
4 47 (9.06%) VPN
5 36 (6.94%) Internet
5 36 (6.94%) LAN
6 32 (6.17%) TCP/IP
7 30 (5.78%) HTTP
8 29 (5.59%) DHCP
9 22 (4.24%) Network Security
10 12 (2.31%) SD-WAN
11 5 (0.96%) OSPF
12 4 (0.77%) BGP
12 4 (0.77%) HSRP
12 4 (0.77%) Intrusion Detection
12 4 (0.77%) OpenLDAP
12 4 (0.77%) Unified Communications
12 4 (0.77%) Wi-Fi
13 1 (0.19%) AMQP
13 1 (0.19%) Software-Defined Networking
Database & Business Intelligence
1 40 (7.71%) NoSQL
2 14 (2.70%) Relational Database
2 14 (2.70%) SQL Server
3 13 (2.50%) Big Data
4 11 (2.12%) PostgreSQL
5 9 (1.73%) Elasticsearch
5 9 (1.73%) Hadoop
5 9 (1.73%) MongoDB
6 8 (1.54%) CockroachDB
7 7 (1.35%) Amazon RDS
7 7 (1.35%) Power BI
7 7 (1.35%) Redis
8 6 (1.16%) Delta Lake
8 6 (1.16%) Metadata
9 4 (0.77%) Data Warehouse
9 4 (0.77%) Parquet
9 4 (0.77%) SAP BW
10 2 (0.39%) BigQuery
10 2 (0.39%) MySQL
10 2 (0.39%) Tableau
Development Applications
1 53 (10.21%) Git
2 34 (6.55%) Jenkins
3 32 (6.17%) GitLab
4 16 (3.08%) JIRA
5 13 (2.50%) Burp Suite
5 13 (2.50%) SonarQube
6 10 (1.93%) Sonatype Nexus
7 9 (1.73%) CircleCI
8 8 (1.54%) Jaeger
8 8 (1.54%) Metasploit
9 7 (1.35%) Katalon Studio
10 6 (1.16%) git-flow
11 5 (0.96%) Postman
12 3 (0.58%) TeamCity
13 2 (0.39%) Atlassian Bamboo
13 2 (0.39%) Bitbucket
13 2 (0.39%) Cucumber
13 2 (0.39%) JUnit
13 2 (0.39%) Octopus Deploy
13 2 (0.39%) Spinnaker
General
1 181 (34.87%) Social Skills
2 160 (30.83%) Finance
3 60 (11.56%) Retail
4 45 (8.67%) Inclusion and Diversity
5 29 (5.59%) Public Sector
6 26 (5.01%) Banking
7 23 (4.43%) Analytical Skills
8 16 (3.08%) Automotive
8 16 (3.08%) Presentation Skills
9 15 (2.89%) Telecoms
10 13 (2.50%) Influencing Skills
11 11 (2.12%) Health Technology
11 11 (2.12%) Law
12 10 (1.93%) Tech for Good
13 8 (1.54%) Documentation Skills
13 8 (1.54%) Financial Institution
14 7 (1.35%) Organisational Skills
15 6 (1.16%) Games
16 5 (0.96%) Police
17 3 (0.58%) Retail Banking
Job Titles
1 141 (27.17%) Architect
2 112 (21.58%) Senior
3 87 (16.76%) Lead
4 49 (9.44%) DevOps Engineer
5 48 (9.25%) Developer
6 37 (7.13%) Security Engineer
7 35 (6.74%) Cloud Architect
8 30 (5.78%) DevSecOps Engineer
9 25 (4.82%) Consultant
9 25 (4.82%) Lead Developer
9 25 (4.82%) Security Manager
10 23 (4.43%) Infrastructure Architect
10 23 (4.43%) Senior DevOps
10 23 (4.43%) Solutions Architect
11 22 (4.24%) Azure Engineer
11 22 (4.24%) Senior Architect
11 22 (4.24%) Technical Architect
12 21 (4.05%) Cloud Engineer
13 20 (3.85%) Security Architect
14 19 (3.66%) Software Engineer
Libraries, Frameworks & Software Standards
1 71 (13.68%) OpenID
2 69 (13.29%) REST
3 53 (10.21%) SAML
4 51 (9.83%) .NET
5 46 (8.86%) OAuth
6 42 (8.09%) HTML
7 35 (6.74%) Middleware
8 27 (5.20%) Node.js
9 25 (4.82%) Web Services
10 23 (4.43%) Kafka
11 16 (3.08%) Spring Boot
12 13 (2.50%) React
12 13 (2.50%) YAML
13 12 (2.31%) ADO
14 11 (2.12%) CSS
14 11 (2.12%) GraphQL
15 9 (1.73%) ARM Templates
16 8 (1.54%) Azure Blueprints
16 8 (1.54%) OpenTelemetry
16 8 (1.54%) Spring
Miscellaneous
1 62 (11.95%) Cloud Native
2 58 (11.18%) Management Information System
3 30 (5.78%) Cyberattack
4 26 (5.01%) Mobile App
5 24 (4.62%) Onboarding
6 23 (4.43%) Virtual Team
7 21 (4.05%) Security Posture
8 14 (2.70%) PKI
9 12 (2.31%) Self-Motivation
10 11 (2.12%) Cloud Security Posture
10 11 (2.12%) Greenfield Project
11 10 (1.93%) Blockchain
11 10 (1.93%) Distributed Systems
11 10 (1.93%) Public Cloud
12 9 (1.73%) Hybrid Cloud
13 8 (1.54%) Enterprise Cloud
14 7 (1.35%) Reinsurance
15 5 (0.96%) Distributed Denial-of-Service
15 5 (0.96%) PropTech
16 4 (0.77%) Analytical Mindset
Operating Systems
1 116 (22.35%) Linux
2 64 (12.33%) Windows
3 48 (9.25%) Ubuntu
4 38 (7.32%) VMS
5 12 (2.31%) Windows Server
6 9 (1.73%) Unix
7 8 (1.54%) Solaris
8 5 (0.96%) CentOS
9 4 (0.77%) Windows Server 2016
10 2 (0.39%) Red Hat Enterprise Linux
11 1 (0.19%) Android
11 1 (0.19%) Apple iOS
11 1 (0.19%) HPUX
Processes & Methodologies
1 283 (54.53%) Agile
2 175 (33.72%) DevOps
3 140 (26.97%) CI/CD
4 114 (21.97%) Cloud Security
5 104 (20.04%) Infrastructure as Code
6 103 (19.85%) Cybersecurity
7 102 (19.65%) Application Security
8 93 (17.92%) Software Engineering
9 91 (17.53%) Scrum
10 89 (17.15%) Microservices
11 83 (15.99%) Containerisation
12 79 (15.22%) Identity Access Management
13 70 (13.49%) Roadmaps
14 68 (13.10%) Mentoring
15 67 (12.91%) Information Security
16 66 (12.72%) Kanban
17 61 (11.75%) Problem-Solving
18 58 (11.18%) TDD
19 54 (10.40%) Collaborative Culture
20 52 (10.02%) SDLC
Programming Languages
1 95 (18.30%) Java
2 88 (16.96%) Python
3 67 (12.91%) SQL
4 43 (8.29%) PowerShell
5 33 (6.36%) JavaScript
6 28 (5.39%) C#
7 20 (3.85%) Kotlin
8 15 (2.89%) TypeScript
9 13 (2.50%) Bash
9 13 (2.50%) Kusto Query Language
10 7 (1.35%) Shell Script
11 6 (1.16%) Go
12 5 (0.96%) Bicep
12 5 (0.96%) Ruby
12 5 (0.96%) VB
13 4 (0.77%) Scala
14 3 (0.58%) PHP
15 1 (0.19%) C++
15 1 (0.19%) R
Qualifications
1 150 (28.90%) Security Cleared
2 75 (14.45%) DV Cleared
3 63 (12.14%) AWS Certification
4 59 (11.37%) Degree
5 52 (10.02%) SC Cleared
6 42 (8.09%) AWS Certified Solutions Architect
7 32 (6.17%) Azure Certification
8 31 (5.97%) CISSP
9 22 (4.24%) CISM
10 21 (4.05%) BPSS Clearance
11 18 (3.47%) Microsoft Certification
12 13 (2.50%) CEH
13 12 (2.31%) (ISC)2 CCSP
13 12 (2.31%) Cisco Certification
14 11 (2.12%) Computer Science Degree
15 9 (1.73%) GIAC
16 8 (1.54%) CCSP
16 8 (1.54%) GPEN
17 7 (1.35%) OSCP
18 6 (1.16%) MCSE
Quality Assurance & Compliance
1 40 (7.71%) ISO/IEC 27001
2 37 (7.13%) NIST
3 34 (6.55%) QA
4 18 (3.47%) PCI DSS
5 14 (2.70%) NCSC
6 13 (2.50%) GRC
7 12 (2.31%) Cyber Essentials
7 12 (2.31%) GDPR
8 6 (1.16%) NIST 800
8 6 (1.16%) SOC 2
9 4 (0.77%) Cyber Essentials PLUS
9 4 (0.77%) ISO/IEC 27002 (supersedes ISO/IEC 17799)
10 3 (0.58%) Data Quality
11 2 (0.39%) COBIT
11 2 (0.39%) ISO 9000
12 1 (0.19%) ISO 20022
12 1 (0.19%) ISO 22301
12 1 (0.19%) ISO 31000
12 1 (0.19%) PMO
System Software
1 86 (16.57%) Docker
2 55 (10.60%) Active Directory
3 25 (4.82%) Virtual Machines
4 18 (3.47%) Virtual Servers
5 5 (0.96%) VMware Infrastructure
6 4 (0.77%) vSphere
7 1 (0.19%) Hyper-V
7 1 (0.19%) LXC
Systems Management
1 146 (28.13%) Terraform
2 129 (24.86%) Kubernetes
3 82 (15.80%) Ansible
4 12 (2.31%) Nessus
5 9 (1.73%) Nmap
5 9 (1.73%) Puppet
5 9 (1.73%) Single Sign-On
6 8 (1.54%) Kiali
7 7 (1.35%) Grafana
8 6 (1.16%) CASB
8 6 (1.16%) Computer Emergency Response Teams
9 5 (0.96%) Kibana
10 4 (0.77%) FortiGate
10 4 (0.77%) Prometheus
10 4 (0.77%) vCenter Server
11 2 (0.39%) Istio
11 2 (0.39%) Podman
11 2 (0.39%) Progress Chef
12 1 (0.19%) HAProxy
12 1 (0.19%) Icinga
Vendors
1 123 (23.70%) Microsoft
2 19 (3.66%) Splunk
3 16 (3.08%) ForgeRock
3 16 (3.08%) Sitecore
4 12 (2.31%) Qualys
4 12 (2.31%) Red Hat
5 11 (2.12%) Google
6 10 (1.93%) VMware
7 9 (1.73%) ServiceNow
8 8 (1.54%) AppDynamics
8 8 (1.54%) Oracle
9 7 (1.35%) Databricks
10 6 (1.16%) Confluent
10 6 (1.16%) Informatica
10 6 (1.16%) McAfee
11 4 (0.77%) Cisco
11 4 (0.77%) Dataiku
11 4 (0.77%) IBM
11 4 (0.77%) Meraki
11 4 (0.77%) SAP